ORIGINAL ARTICLE
Evaluation of cortical thickness and brain volume on 3 Tesla
magnetic resonance imaging in children with frontal lobe epilepsy
Feride Kural Rahatli1 &Taner Sezer2&Arzu Ceylan Has3&Ahmet Muhtesem Agildere4Received: 16 July 2019 / Accepted: 31 October 2019 # Fondazione Società Italiana di Neurologia 2019
Abstract
Background Frontal lobe epilepsy (FLE) is the most common epilepsy syndrome in the pediatric population; however, brain magnetic resonance imaging (MRI) of the children with FLE is frequently normal. We use both cortical thickness and brain volume measurements to report on cortical changes in children with FLE. Our aim was to determine cortical thickness and brain volume changes on 3 Tesla MRI of children with FLE and normal brain magnetic resonance imaging.
Methods Twenty-seven children with FLE and 27 healthy controls received brain magnetic resonance imaging. Cortical thick-ness and regional brain volumes were assessed using three-dimensional volumetric T1-weighted imaging and patients were compared with controls.
Results In children with FLE, statistically significant (p < 0.05) cortical thinning were found in the bilateral middle frontal gyrus, bilateral occipitotemporal and medial lingual gyrus, left subcallosal gyrus, left short insular gyrus, and right long insular gyrus. Statistically significant volume reductions in right and left hemisphere cortical white matter, total cortical white matter, bilateral thalamus, bilateral putamen, bilateral globus pallidus, right caudate nucleus, brain stem, and right cerebellar cortex were found. Conclusion Cortical thinning in frontal and extra-frontal lobes and volume loss in a variety of brain regions were found in children with FLE.
Keywords Cortical thickness . Brain volume . Children . Frontal lobe epilepsy . Magnetic resonance imaging
Introduction
Frontal lobe epilepsy (FLE) in childhood is common localization-related epilepsy [1]; however, brain magnetic res-onance imaging (MRI) of the children with FLE is frequently normal [2]. The diagnosis of FLE is based on seizure semiol-ogy, electroencephalography. In temporal lobe epilepsy which is the second most common type of epilepsy in pediatric pop-ulation temporal and extra temporal abnormalities of gray and white matter were shown in studies using brain MRI [1–4]. The frontal lobe contains widespread corticocortical and sub-cortical connections that can result in a rapid spread of seizure activity outside of the frontal lobe (both within the same hemi-sphere and to the contralateral hemihemi-sphere), thereby making the localization of seizures challenging. These seizures may lead to cortical thinning within the cortex and beyond the frontal lobe, and as in the contralateral hemisphere [3,4]. Also the probability of having secondarily generalized tonic-clonic seizures is higher in FLE patients than in temporal lobe epilepsy (TLE) patients which could be explained by the rapid spread of seizure activity [2,3]. FLE patients had seizures
* Feride Kural Rahatli [email protected]
Taner Sezer
[email protected] Arzu Ceylan Has [email protected] Ahmet Muhtesem Agildere [email protected]
1 Department of Radiology, Faculty of Medicine, Baskent University,
10. Sokak No:45, 06490 Bahcelievler, Ankara, Turkey
2
Department of Pediatric Neurology, Faculty of Medicine, Baskent University, 10. Sokak No:45, 06490 Bahcelievler, Ankara, Turkey
3
UMRAM (National Magnetic Resonance Research Center), Bilkent University, Bilkent Cyberpark, Bilkent 6. Cadde,
06800 Ankara, Turkey
4 Department of Radiology, Faculty of Medicine, Baskent University,
10. Sokak No:45, 06490 Bahcelievler, Ankara, Turkey
mainly during sleep and differing motor characteristics [4]. Children with FLE often have cognitive impairment which its etiology is unknown [5]. Childhood epilepsy could be seen with attention deficit hyperactivity disorder (ADHD), anxiety disorders, autism spectrum, depression, and headache [6]. In adult population, prevalence of epilepsy was found higher in migraine population [7]. The etiologies of comorbidity of these pathologies are unknown.
Patients who have negative brain MRI findings for FLE have poorer surgical outcomes [8], and while the reason for the poor outcomes is uncertain, they may be due to the rapid spread of seizure activity and the variety of seizure semiology [9]. As we know, the surgical outcomes of FLE with positive brain MRI findings were better than FLE with negative MRI findings [4].
We are only aware of a few published studies evaluating the cortical thickness of children with FLE. Widjaja et al. measured cortical thickness of children with FLE and normal brain MRI findings, and found frontal and extra-frontal corti-cal thinning [3]. Lawson et al. evaluated brain volumes in children with either FLE or TLE, and found frontal cortical volume loss in children with FLE and atrophied hippocampus in children with TLE [1]. In this study, we use both cortical thickness and brain volume measurements to report on cortical changes in children with FLE. Our aim was to detect regions of cortical thinning and brain volume differences in children with FLE and normal brain MRIs, using three-dimensional (3D) volumetric T1-weighted images acquired on a 3T scanner.
Methods
Patients
This study was performed in accordance with the ethical guidelines of the declaration of Helsinki and was approved by the local ethical committee. Between 2012 and 2015, 27 patients with FLE between the ages of 6 and 16 years (12 female and 15 male, median age 11 years) and 27 healthy controls between 7 and 17 years (14 female and 13 male, median age 13 years) were included in this prospective study. Informed written consent was obtained from all individual participants included in the study. All of the FLE patients had interictal or ictal electroencephalographic evidence indi-cating seizure onset in the frontal lobes, together with seizure semiology consistent with onset in the frontal lobe. The mean age at seizure onset was 11.3 ± 3.5 years, the mean duration of epilepsy was 2.19 ± 2 years, and the mean seizure frequency per year was 1.35. Ten of the patients (37%) had a family history of epilepsy, one (3.17%) had a history of status epilep-ticus, and three (11.1%) had a history of generalized tonic-clonic seizure. All patients were on antiepileptic medication
at the time of MR imaging, with 10 patients being on carba-mazepine, 15 patients on valproic acid, and 2 patients on le-vetiracetam therapy.
The control group consisted of 27 healthy subjects with normal brain MRI findings and without neurologic or psychi-atric disorders or a history of febrile or afebrile convulsions. There was no statistical difference between the age and gen-ders of the patients and controls.
Exclusion criteria for the FLE group were the presence of any other neurologic disorder, chronic systemic disease, and abnormal brain MRI findings such as tumor, cortical dyspla-sia, and infarct.
MR imaging and image processing
Twelve patients with FLE had previously undergone brain MR imaging on a 1.5T scanner (Avanto and Symphony, Siemens, Germany) using an 18-channel phased array coil. The imaging consisted of coronal oblique FLAIR (TR/TE 8000/80 ms, slice thickness 4 mm, field of view 22 cm, matrix size 190 × 320, flip angle 150°), inversion Recovery (TR/TE 4630/74 ms, slice thickness 4 mm, field of view 22 cm, matrix size 280 × 320, flip angle 150°), axial oblique T1-weighted (TR/TE 521/11 ms, slice thickness 5 mm, field of view 21 cm, matrix size 234 × 384, flip angle 90°) and T2-weighted (TR/ TE 5580/113 ms, slice thickness 5 mm, field of view 21 cm, matrix size 272 × 448, flip angle 90°), and sagittal 3D volu-metric T1-weighted (TR/TE 1790/3.56 ms, slice thickness 1 mm, field of view 24 cm, matrix size 311 × 384, flip angle 15°) sequences. Brain MRIs were evaluated independently by two experienced neuroradiologists, and all patients were found to have normal MRI findings. The brain MRIs of 15 patients who were referred from outside and who had not undergone previous brain MRI within our department were re-evaluated by two experienced neuroradiologists and report-ed as normal.
For the cortical thickness and brain volume measurements, the MRIs of all patients and controls were acquired on a 3T scanner (Trio, Siemens Medical Solutions, Erlangen, Germany) using a 32-channel phased array head coil. The imaging in both patient and control groups consisted of a sagittal 3D volumetric T1-weighted sequence (TR/TE 1900/2.6 ms, slice thickness 1 mm, field of view 22 cm, ma-trix size 256 × 256, flip angle 9°) and an axial fluid-attenuated inversion recovery (FLAIR; TR/TE 9000/91 ms, slice thick-ness 5 mm, field of view 22 cm, matrix size 323 × 512, flip angle 130°) sequence. Before the cortical thickness and brain volume measurements were performed, the axial FLAIR and sagittal 3D volumetric T1-weighted images were evaluated, and all patients were confirmed as having normal MRI findings.
Freesurfer Version 5.3.0 (http://surfer.nmr.mgh.harvard. edu/) was used for measurements of brain volume and
cortical thickness in patients and controls. The analysis procedure included nonuniform nonparametric intensity normalization [10–15], skull stripping, linear and nonlinear normalization to the Montreal Neurological Institute 305 Atlas within Freesurfer [10, 15, 16], segmentation of the white matter, and tagging of subcortical structures such as the globus pallidus, putamen, thalamus, hippocampus, amygdala, and ventricles. The volumes of the total cortex, total white matter, brainstem, corpus callosum, bilateral cerebral cortices, cerebral white matter, cerebellar cortex, cerebellar white matter, thalami, hippocampi, caudate nuclei, putamen, globus pallidus, and amygdalae were calculated. The volumetric data obtained were normalized to the estimated total intracranial volume.
To measure cortical thickness, the brain was divided into two hemispheres, with the ventricles and white matter region being filled to form a single white matter volume for each hemisphere. Tessellation of the gray–white matter boundary, inflation of the surface, and automatic correction of topologi-cal defects were performed. The gray–white matter boundary was identified by classifying all white matter voxels in the brain volume and then refining the white matter surface to achieve submillimeter accuracy in the delineation of the gray–white matter junction [3,11,12,14]. This surface was then deformed outward to identify the gray matter– cerebrospinal fluid (CSF) boundary. The cortical thickness was measured by calculating the average of (1) the shortest distance between the gray–white matter boundary and gray– CSF boundary and (2) the shortest distance between the gray– CSF boundary and gray–white matter boundary at each vertex on the tessellated surface. To optimize visualization of sulcal and gyral regions across the entire neocortex, without these regions being obscured by cortical folding, the measurements were mapped to the inflated surface of each brain reconstruc-tion. The data were then smoothed on the tessellated surface using a 10-mm full width half maximum Gaussian kernel to improve the signal to noise ratio. Each hemisphere was then divided into 34 gyral labels (11 frontal, 4 medial-temporal, 5 lateral temporal, 5 parietal, 4 occipital, and 5 cingulate) using an automated parcellation technique [16,17]. Six lobar re-gions of interest were defined in each hemisphere as the fron-tal, medial temporal, lateral temporal, pariefron-tal, cingulate, and occipital regions [17]. The mean thickness of each lobar re-gion of interest was calculated using the weighted average of the thickness within each gyral-based region of interest (mean regional thickness × number of vertices for that region/total number of vertices) [17].
Statistical analyses
Means (± standard deviation), medians, and minimum and maximum values are used to describe the quantitative vari-ables, with frequencies and percentages being given for
nominal data. Normality assumptions were checked using a Shapiro–Wilk test, which indicated that the data did not con-form to a normal distribution. The brain volumes and cortical thicknesses of the patients with FLE and controls were there-f o r e c o m p a r e d u s i n g t h e M a n n - W h i t n e y U t e s t . Nonparametric Spearman correlation analysis was used to an-alyze the relationships of age, duration of epilepsy, and seizure frequency, with the measurements of cortical thickness and brain volume. For all analyses, IBM-SPSS version 20.0 (IBM Corp., Armonk, NY, USA) was used, with the statistical significance set at p < 0.05.
Results
Cortical thickness measurements
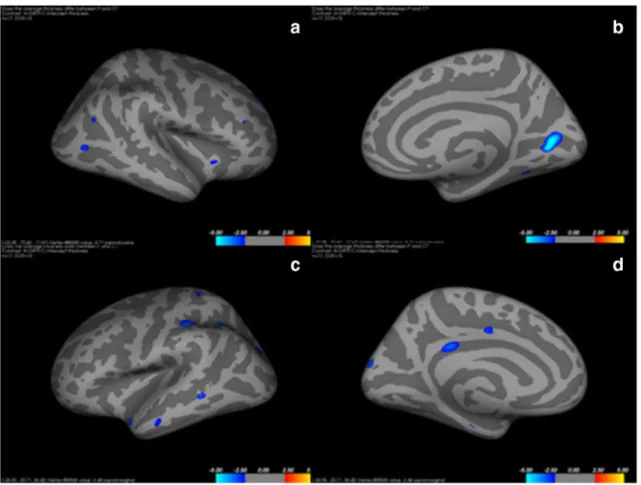
In comparison with the normal control subjects, patients with FLE demonstrated a statistically significant cortical thinning in the left middle frontal gyrus (p = 0.031), left occipitotemporal gyrus (p = 0.011), medial lingual gyrus (p = 0.011), left subcallosal gyrus (p = 0.04), left short insular gyrus (p = 0.041), right middle frontal gyrus (p = 0.003), right long insular gyrus (p = 0.03), right occipitotemporal gyrus (p = 0.027), and medial lingual gyrus (p = 0.027; Fig.1). Lateral and medial views of inflated right and left hemispheres show-ing regions of cortical thinnshow-ing are shown in Fig.1. Figure2 shows the regions of cortical thinning that were significantly lower in patients with FLE than in healthy controls. Table1 shows the cortical thickness of the brain regions that were significantly lower in patients.
Brain volume measurements
In comparison with the normal control subjects, patients with FLE demonstrated statistically significant reductions in the volumes of the left cortical white matter (p = 0.012), right cortical white matter (p = 0.005), total cortical white matter (p = 0.008), left thalamus (p = 0.001), left putamen (p = 0.001), left globus pallidus (p = 0.001), brainstem (p = 0.004), right cerebellar cortex (p = 0.042), right thalamus (p = 0.001), right caudate (p = 0.003), right putamen (p = 0.001), and right globus pallidus (p = 0.001). Lateral and medial views of inflated right and left hemispheres showing regions of brain volume loss are shown in Fig.3. Figure4shows the mean reduction in the volumes of regions that were signifi-cantly lower in patients with FLE than in healthy controls.
We did not find that cortical thickness or brain volume measurements showed any significant correlations with sei-zure onset, duration of epilepsy, or seisei-zure frequency in chil-dren with FLE.
Discussion
The major findings of our study are those of frontal and extra-frontal cortical thinning and brain volume loss in a variety of brain regions in children with FLE. We demonstrate regions showing statistically significant cortical thinning and volume loss using diagrams (Figs.2and4). One possible reason for these findings could be the intense connectivity within frontal regions, and with other cortical and subcortical regions; these connections present multiple potential pathways for the spread of seizure from an epileptogenic focus in the frontal lobe [18]. da Silva et al. [19] performed a fluorodeoxyglucose positron emission tomography (FDG-PET) study of children with FLE and found hypometabolism affecting the frontal, temporal, and parietal cortices. They hypothesized that these findings could be due to factors such as seizure spread within and outside the frontal lobe, a large epileptogenic focus in both frontal and extra-frontal lobes, and development of a second-ary epileptogenic focus. In the current study, we found cortical thinning in bilateral frontal, temporal, and occipital lobes. A loss of neurons in the epileptogenic focus may be a possible mechanism for cortical thinning in epileptic patients [20].
Widjaja et al. [3] used 1.5 T MRI to measure cortical thick-ness in 17 children with right and left FLE, and found that
cortical thinning affected the frontal, temporal, parietal, cin-gulate, and occipital cortices in both right and left FLE. They used the localization of epileptogenic foci to divide patients into the two groups of right or left frontal lobe epilepsy, and found cortical thinning in similar regions in both groups [4]. In the current study, in which we found bilateral cortical thinning in patients with FLE, we did not divide patients into separate right and left frontal lobe epilepsy groups. We also used 3T MRI to make cortical thickness and brain volume measure-ments at the same time in children with FLE, procedures that differ from those used in previous studies on FLE.
Braakman et al. [5] evaluated the children with FLE using both cognitive tests and brain diffusion tensor imaging (DTI) and compared with healthy controls. They found that cogni-tively impaired children with FLE showed most pronounced DTI findings. In another study, Saute et al. found cortical thinning and brain volume loss in pediatric patients with FLE and ADHD [6]. In pediatric population ADHD, cognitive impairment is well known comorbidities. Also anxiety disor-ders, depression, headache, autism can be seen together. As shown in the previous studies, comorbid pathologies make brain changes more prominent [21].
Anatomopathological and radiological studies in patients with different epilepsy syndromes have revealed the presence
Fig. 1 Lateral (a) and medial (b) views of an inflated right hemisphere showing regions of cortical thinning (blue clusters). Lateral (c) and medial (d) views of an inflated left hemisphere showing regions of cortical thinning (blue clusters)
of mild abnormalities in the layering and cellularity of gray and white matter tissue, and decreases in gray matter volume including the frontal lobes [22, 23]. Tondelli et al. studied cortical and subcortical alterations in juvenile absence epilep-sy, and found gray matter volume and surface area reductions in bilateral frontal regions, the anterior cingulate, and the right mesial temporal lobe [24]. In another study, Widjaja et al. used 3T MRI to evaluate cortical thickness in 29 children with new onset epilepsy, and found significant cortical thinning in the right cingulate, medial temporal, and left frontal cortices [17]. Lawson et al. evaluated children with FLE and TLE, using 1.5T MRI to measure the brain volumes of 39 patients with FLE, 17 patients with TLE, and 42 controls [1]. They found that patients with FLE showed bilateral frontal volume loss in comparison with controls and those with TLE. Lawson et al. [1] performed manual measurements of cortical thickness; however, we used an automated procedure to standardize the measurements. They also found bilateral electroencephalo-gram (EEG) abnormalities and suggested that FLE was a bi-lateral disease, as they did not find a significant correlation between the lateralization of the epilepsy and frontal cortical volume loss [1]. According to the literature, temporal lobe epilepsy patients exhibit notable reductions of gray matter volume in the contralateral hippocampus, thalamus, caudate, putamen, and inferior frontal gyrus [25]. Brain tissue abnor-malities in thalamic and frontal regions have also been identi-fied very early in the course of idiopathic generalized epilep-sies [26].
Thalamic volume loss, as found in this study, has been documented in different epilepsy types, in both pediatric and
adult patients. The thalamus may play an important role in the development of epileptogenic foci; further radiologic and pathologic studies with larger sample sizes are required to explain the role of the thalamus in epilepsy.
Widjaja et al. [3] did not find a significant association be-tween cortical thickness and seizure onset, duration of epilep-sy, seizure frequency, or number of antiepileptic medications in children with FLE. Jones et al. [27] evaluated cortical thick-ness and brain volume in children with recent-onset epilepsy with a current anxiety disorder, epilepsy with no current anx-iety disorder, and controls. The epilepsy with anxanx-iety group showed a significant thinning in the anterior prefrontal cortex. They found no association between cortical thickness and age, sex, age of seizure onset, duration of epilepsy, and medica-tions. In the present study, we also found no association be-tween cortical thickness or brain volume and seizure onset, duration of epilepsy, seizure frequency, and number of antiep-ileptic medications in children with FLE. Linn et al. [28] eval-uated adult patients with TLE and found that parietal and frontal cortical thickness ipsilateral to the epileptogenic focus demonstrated a significant association with the duration of epilepsy. In a previous study, McDonald et al. [29] measured the cortical thickness of 21 adult patients with TLE and 21 controls, and found an association between increased duration of epilepsy and cortical thinning in the right parietal region. Our findings on the association between cortical thickness and duration of epilepsy are similar to those in the pediatric liter-ature, but are different to those found on adult TLE patients. This may be explained by the shorter duration of the epilepsy in our, and other pediatric studies. The mean epilepsy duration
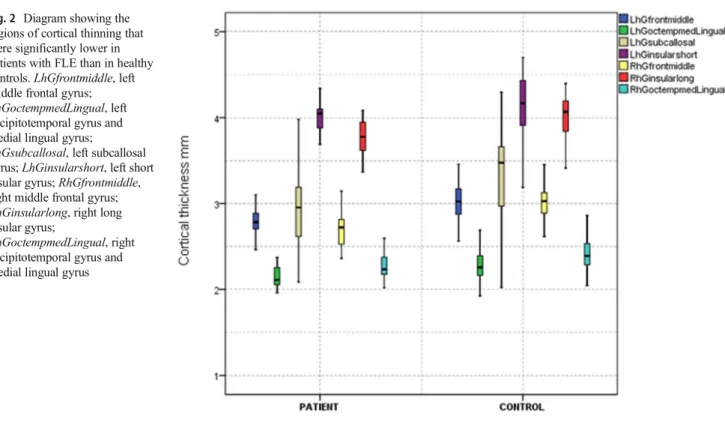
Fig. 2 Diagram showing the regions of cortical thinning that were significantly lower in patients with FLE than in healthy controls. LhGfrontmiddle, left middle frontal gyrus; LhGoctempmedLingual, left occipitotemporal gyrus and medial lingual gyrus;
LhGsubcallosal, left subcallosal gyrus; LhGinsularshort, left short insular gyrus; RhGfrontmiddle, right middle frontal gyrus; RhGinsularlong, right long insular gyrus;
RhGoctempmedLingual, right occipitotemporal gyrus and medial lingual gyrus
was 2.19 years in the present study and 6.5 years in the study by Widjaja et al. [3], while it was 23 years in the study by McDonald et al. [29] on adult patients with TLE.
Phal et al. [30] compared 1.5T and 3T MRI for the evalu-ation of epilepsy. In their study, in which 25 patients underwent MRI of the brain on both 1.5T and 3T scanners, they found that 3T was superior to 1.5T for the detection and characterization of lesions. Zijlmans et al. [31] compared 1.5T and 3T MRI in the evaluation of 37 patients with epilepsy and found that the 3T scans allowed detection of different lesions to the 1.5T scans. They suggested that 3T scans may be useful
in patients with a suspicion of dysplasia. The increased signal to noise ratio and improved spatial resolution were suggested to be the explanations for the increased sensitivity of 3T in comparison with1.5T MRI. In this study, we made cortical thickness and brain volume measurements on a 3T scanner. We analyzed brain MRIs of patients both scanned in 1.5 Tesla and 3 Tesla scanners and we found both brain MRIs in normal limits.
Also advanced MRI techniques can be used in epilepsy imaging such as magnetic resonance spectroscopy (MRS), arterial spin labeling, and diffusion tensor imaging. MRS
Fig. 3 Lateral (a) and medial (b) views of an inflated right hemisphere showing regions of brain volume loss (blue clusters). Lateral (c) and medial (d) views of an inflated left hemisphere showing regions of brain volume loss (blue clusters)
Table 1 Cortical thickness (mm) of statistically significant regions in patients with FLE and healthy controls
Regions Controls (N = 27) FLE (N = 27) p value Left middle frontal gyrus 3.031778 2.777259 p = 0.031 Left occipitotemporal and medial lingual gyrus 2.287148 2.164481 p = 0.011 Left subcallosal gyrus 3.360259 2.972111 p = 0.04 Left short insular gyrus 4.150444 4.024148 p = 0.041 Right middle frontal gyrus 2.708259 3.033963 p = 0.003 Right long insular gyrus 3.990259 3.754037 p = 0.03 Right occipitotemporal and medial lingual gyrus 2.287148 2.164481 p = 0.027 FLE, frontal lobe epilepsy; values are expressed as mean in mm
and arterial spin labeling are basically used in differential diagnosis of brain tumors, evaluation of residual/ recur-rent lesions, pseudo progression, radiation necrosis [32, 33]. MRS also can be used in diagnosis of metabolic syndromes in pediatric population. There are a few studies that evaluated adult population with metabolic syndrome using brain MRS [34].
This study has some limitations. First, the epileptogenic focus localization was based on seizure semiology and EEG, with magneto encephalography, FDG-PET, and invasive in-tracranial monitoring being unavailable for the patients. Second, we did not group patients as right and left FLE so we could not therefore lateralize the findings, and could not assess whether the laterality affected the cortical thickness and brain volume distribution. Also small sample size was another limitation of this study.
Conclusion
Brain MRI of children with FLE is frequently normal; cortical thickness and brain volume measurements can therefore be use-ful for demonstrating subtle cortical changes. In this prospective study, reduced cortical thicknesses in the frontal and extra-frontal lobes, and volume loss in a variety of brain regions, were found in children with FLE and normal brain MRI with using 3 Tesla scanner. These findings could be relevant to large epileptogenic foci that involve both frontal and extra-frontal lobes, a rapid spread of seizure activity, and the development of secondary epileptogenic foci. We demonstrated regions of cortical thinning and brain volume loss, and recommend that further studies with larger sample sizes diffusion tensor imaging should be performed to reveal possible connections between these areas of cortical thinning and volume loss.
Fig. 4 Diagrams showing the mean reduction in the volumes of regions that were significantly lower in patients with FLE than in healthy controls. a
LhCorticalWhiteMatterVol, left cortical white matter volume; RhCorticalWhiteMatterVol, right cortical white matter volume; CorticalWhiteMatterVol, total cortical white matter volume; Rightcerebellarcortex, right cerebellar cortical volume. b Leftpallidum, left globus pallidus; Rightcaudate, right caudate nucleus; Rightpallidum, right globus pallidus
Compliance with ethical standards
Conflict of interest The authors declare that they have no conflict of interest.
Ethical approval All procedures performed in studies involving human participants were in accordance with the ethical standards of our institu-tional review board (IRB) after its approval and with the 1964 Helsinki Declaration and its later amendments or comparable ethical standards. Our IRB determined that patient approval and informed consent were not required because of retrospectively reviewing images and records.
References
1. Lawson JA, Cook MJ, Vogrin S, Litewka L, Strong D, Bleasel AF, Bye AM (2002) Clinical, EEG, and quantitative MRI differences in pediatric frontal and temporal lobe epilepsy. Neurology 58:723– 729
2. Cascino GD, Jack CR Jr, Parisi JE, Marsh WR, Kelly PJ, Sharbrough FW, Hirschorn KA, Trenerry MR (1992) MRI in the presurgical evaluation of patients with frontal lobe epilepsy and children with temporal lobe epilepsy: pathologic correlation and prognostic importance. Epilepsy Res 11:51–59
3. Widjaja E, Mahmoodabadi SZ, Snead OC 3rd, Almehdar A, Smith ML (2011) Widespread cortical thinning in children with frontal lobe epilepsy. Epilepsia 52:1685–1691
4. Widjaja E, Kis A, Go C, Snead OC 3rd, Smith ML (2014) Bilateral white matter abnormality in children with frontal lobe epilepsy. Epilepsy Res 108:289–294
5. Braakman HMH, Vaessen MJ, Jansen JFA, Debeij-van Hall MHJA, de Louw A, Hofman PAM, Les JSH, Aldenkamp AP, Backes WH (2014) Pediatric frontal lobe epilepsy: white matter abnormalities and cognitive impairment. Acta Neurol Scand 129:252–262 6. Saute R, Dabbs K, Jones JE, Jackson DC, Seidenberg M, Hermann
BP (2014) Brain morphology in children with epilepsy and ADHD. PLoS One 9:e95269
7. Mutlu A (2018) Association between epilepsy and headache. Neurol Sci 39:2129–2134
8. Lorenzo NY, Parisi JE, Cascino GD, Jack CR Jr, Marsh WR, Hirschorn KA (1995) Intractable frontal lobe epilepsy: pathological and MRI features. Epilepsy Res 20:171–178
9. Jobst BC, Siegel AM, Thadani VM, Roberts DW, Rhodes HC, Williamson PD (2000) Intractable seizures of frontal lobe origin: clinical characteristics, localizing signs, and results of surgery. Epilepsia 41:1139–1152
10. Fischl B, Salat DH, van der Kouwe AJ, Makris N, Ségonne F, Quinn BT, Dale AM (2004) Sequence-independent segmentation of magnetic resonance images. Neuroimage 23:69–84
11. Fischl B, Sereno MI, Tootell RB, Dale AM (1999) High resolution intersubject averaging and a coordinate system for the cortical sur-face. Hum Brain Mapp 8:272–284
12. Fischl B, Serono MI, Dale AM (1999) Cortical surface-based anal-ysis II: inflation, flattening, and a surface-based coordinate system. Neuroimage 9:195–207
13. Fischl B, Dale AM (2000) Measuring the thickness of the human cerebral cortex from magnetic resonance images. Proc Natl Acad Sci U S A 97:11050–11055
14. Dale AM, Fischl B, Sereno MI (1999) Cortical surface-based anal-ysis. I. Segmentation and surface reconstruction. Neuroimage 9: 179–194
15. Fischl B, van der Kouwe A, Destrieux C, Halgren E, Ségonne F, Salat DH, Busa E, Seidman LJ, Goldstein J, Kennedy D, Caviness V, Makris N, Rosen B, Dale AM (2004) Automatically parcellating the human cerebral cortex. Cereb Cortex 14:11–22
16. Desikan RS, Ségonne F, Fischl B, Quinn BT, Dickerson BC, Blacker D, Buckner RL, Dale AM, Maguire RP, Hyman BT, Albert MS, Killiany RJ (2006) An automated labeling system for subdividing the human cerebral cortex on MRI scans into gyral based regions of interest. Neuroimage 31:968–980
17. Widjaja E, Zarei Mahmoodabadi S, Go C, Raybaud C, Chuang S, Snead OC, Smith ML (2012) Reduced cortical thickness in children with new-onset seizures. AJNR Am J Neuroradiol 33:673–677 18. Quesney LF, Constain M, Rasmussen T, Stefan H, Olivier A (1992)
How large are frontal lobe epileptogenic zones? EEG, ECoG, and SEEG evidence. Adv Neurol 57:311–323
19. da Silva EA, Chugani DC, Muzik O, Chugani HT (1997) Identification of frontal lobe epileptic foci in children using posi-tron emission tomography. Epilepsia 38:1198–1208
20. Mueller SG, Laxer KD, Barakos J, Cheong I, Garcia P, Weiner MW (2009) Widespread neocortical abnormalities in temporal lobe epi-lepsy with and without mesial sclerosis. Neuroimage 46:353–359 21. Vaessen MJ, Jansen JF, Braakman HM, Hofman PA, De Louw A,
Aldenkamp AP, Backes WH (2014) Functional and structural net-work impairment in childhood frontal lobe epilepsy. PLoS One 9(3):e90068
22. Enteno M, Vollmar C, Stretton J, Symms MR, Thompson PJ, Richardson MP, O’Muircheartaigh J, Duncan JS, Koepp MJ (2014) Structural changes in the temporal lobe and piriform cortex in frontal lobe epilepsy. Epilepsy Res 108:978–981
23. Eriksson SH, Malmgren K, Nordborg C (2005) Microdysgenesis in epilepsy. Acta Neurol Scand 111:279–290
24. Tondelli M, Vaudano AE, Ruggieri A, Meletti S (2016) Cortical and subcortical brain alterations in juvenile absence epilepsy. Neuroimage Clin 12:306–311
25. Hermann BP, Dabbs K, Becker T, Jones JE, Myers Y, Gutierrez A, Wendt G, Koehn MA, Sheth R, Seidenberg M (2010) Brain devel-opment in children with new onset epilepsy: a prospective con-trolled cohort investigation. Epilepsia 51:2038–2046
26. Pulsipher DT, Dabbs K, Tuchsherer V, Sheth RD, Koehn MA, H e r m a n n B P, S e i d e n b e r g M ( 2 0 11 ) T h a l a m o f r o n t a l neurodevelopment in new-onset pediatric idiopathic generalized epilepsy. Neurology 76:28–33
27. Jones JE, Jackson DC, Chambers KL, Dabbs K, Hsu DA, Stafstrom CE, Seidenberg M, Hermann BP (2015) Children with epilepsy and anxiety: subcortical and cortical differences. Epilepsia 56:283–290 28. Lin JJ, Salamon N, Lee AD, Dutton RA, Geaga JA, Hayashi KM, Luders E, Toga AW, Engel J Jr, Thompson PM (2007) Reduced neocortical thickness and complexity mapped in mesial temporal lobe epilepsy with hippocampal sclerosis. Cereb Cortex 17:2007– 2018
29. McDonald CR, Hagler DJ Jr, Ahmadi ME, Tecoma E, Iragui V, Gharapetian L, Dale AM, Halgren E (2008) Regional neocortical thinning in mesial temporal lobe epilepsy. Epilepsia 49:794–803 30. Phal PM, Usmanov A, Nesbit GM, Anderson JC, Spencer D, Wang
P, Helwig JA, Roberts C, Hamilton BE (2008) Qualitative compar-ison of 3-T and 1.5-T MRI in the evaluation of epilepsy. AJR Am J Roentgenol 191:890–895
31. Zijlmans M, de Kort GA, Witkamp TD, Huiskamp GM, Seppenwoolde JH, van Huffelen AC, Leijten FS (2009) 3T versus 1.5T phased-array MRI in the presurgical work-up of patients with partial epilepsy of uncertain focus. J Magn Reson Imaging 30:256– 262
32. Abdel Razek AAK, Talaat M, El-Serougy L, Gaballa G, Abdelsalam M (2019) Clinical applications of arterial spin labeling in brain tumors. J Comput Assist Tomogr 43:525–532
33. Razek AAKA, El-Serougy L, Abdelsalam M, Gaballa G, Talaat M (2018) Differentiation of residual/recurrent gliomas from postradiation necrosis with arterial spin labeling and diffusion ten-sor magnetic resonance imaging-derived metrics. Neuroradiology 60:169–177
34. mewafy Z, Abdel Razek AAAK, Eshmawy M, Abo El-Eneen N, EL-Biaomy A (2018) MR spectroscopy of the frontal region in patients with metabolic syndrome: correlation with an-thropometric measurement. Pol J Radiol 83:e215–e219
Publisher’s note Springer Nature remains neutral with regard to jurisdic-tional claims in published maps and institujurisdic-tional affiliations.