The importance of salivary cortisol in the diagnosis of adrenal
insufficiency in cirrhosis
Filiz Araz, Barış Soydaş, Birol Özer, Ender Serin
Department of Gastroenterology, Başkent University School of Medicine, Adana Training and Research Hospital, Adana, Turkey
INTRODUCTION
Cortisol is an important component of the stress re-sponse. It has critical roles in the maintenance of nor-mal functions in the immune system, vascular tone, car-diac output, metabolic states, and several other cellular processes (1,2). The prevalence of adrenal insufficiency (AI) has been reported to be 66% in decompensated cirrhosis, 33% in acute liver failure, 72% in patients in transplantation centers, 51% in cirrhotic patients with sepsis, 68–77% in cirrhotic patients with septic shock, and 38% in stable cirrhotic patients without any hemo-dynamic instability (1,3-7).
In clinical practice, AI is diagnosed based on basal or post-adrenocorticotrophic hormone (ACTH) stimulation levels of serum total cortisol (TC). More than 90% of cor-tisol in the serum is bound to corcor-tisol-binding globulin (CBG) or albumin. Because the serum concentrations of these proteins are reduced in liver cirrhosis, the
measure-ment of the level of free cortisol (FC), which is the biolog-ically active fraction, may be a more reliable parameter for the diagnosis of AI in cirrhotic patients (8,9).
With basal and stimulated TC levels, AI has been report-ed to be diagnosreport-ed in 40% of severely ill hypoprotein-emia ill. However, the basal and ACTH-stimulated FC levels of these patients remained within normal ranges (10). The measurement of the level of FC is technically difficult and expensive and is not routinely used (11). The level of FC can be calculated using the levels of TC and CBG (12). Salivary cortisol (SC) measurement has been suggested as an alternative method in the diag-nosis of AI. It correlates well with FC and is not affected by serum protein levels (12-15). In hemodynamically stable cirrhotic patients, the prevalence of AI has been reported to be 33% with TC measurements. However, according to SC, only 9.1% of these patients were diag-nosed with AI (16).
Address for Correspondence: Filiz Araz E-mail: [email protected] Received: January 17, 2016 Accepted: March 15, 2016
© Copyright 2016 by The Turkish Society of Gastroenterology • Available online at www.turkjgastroenterol.org • DOI: 10.5152/tjg.2016.15544 ABSTRACT
Background/Aims: Reports on adrenal insufficiency (AI) are unexpectedly high in cirrhosis, and the diagnosis of this condition remains a challenge. We aimed to define the prevalence rate of AI in stable cirrhotic patients and determine the correlations of free cortisol and salivary cortisol with total cortisol.
Materials and Methods: Between January 2011 and September 2011, 110 consecutive cirrhotic patients with-out any infection or hemodynamic instability were enrolled. Baseline total and salivary cortisol levels were measured. The free cortisol level was calculated according to the Coolens’ formula. Post-stimulation total and salivary cortisol levels were measured, and the free cortisol level was recalculated.
Results: The mean age of the patients was 62.1±11.4 years. There were 54 males (49.1%). The mean Child-Turcotte-Pugh (CTP) score was 7.2±2.3. Twenty-two (20%) patients were at the CTP-C level. AI was present in 23 (20.9%) and 17 (15.5%) of all patients according to the total and free cortisol criteria, respectively. For basal and stimulated levels, salivary cortisol rather than total cortisol correlates well with free cortisol.
Conclusion: The diagnosis of AI on the basis of total cortisol measurement overestimates the prevalence of AI in cirrhosis. Salivary cortisol, which correlates well with free cortisol, is a promising alternative for the diagnosis of AI in cirrhotic patients.
Keywords: Cirrhosis, adrenal insufficiency, total cortisol, salivary cortisol, free cortisol
Or
iginal Ar
ticle
The aims of this study were to define the prevalence rate of AI in stable cirrhotic patients and to determine the correlations of FC and SC with TC.
MATERIALS AND METHODS Study design
This prospective observational study was conducted at Başkent University Adana Training and Research Center between Janu-ary 2011 and September 2011. The study included 110 stable cirrhotic patients admitted to the outpatient clinic. The diagno-sis of cirrhodiagno-sis was based on biopsy and/or clinical, radiologic, and laboratory findings. The exclusion criteria were as follows: age<18 years; pregnancy; history of pituitary or adrenal dis-ease; active infection or sepsis; hemodynamic instability due to septic shock or bleeding; administration of albumin, fresh frozen plasma, vasopressors, or glypressin; treatment with ste-roids or other drugs known to influence cortisol secretion (e.g., etomidate, ketoconazole) or CBG level; treatment with drugs known to affect saliva secretion; active intake of alcohol; and diagnosis of Sjogren’s disease and hepatocellular carcinoma. Written informed consent was obtained from all patients. The study protocol was approved by the ethical committee of Başkent University (KA10/154).
Study protocol
On the first day, a physical examination of each patient was performed. Blood and saliva samples were taken 15 min after the insertion of an indwelling intravenous catheter. Particular attention was paid to the absence of blood in the mouth. Sixty minutes after the intramuscular administration of 250 µg cor-ticotrophin (Syancten, Novartis Pharma SAS; Rueil-Malmaison, France), blood and saliva were sampled again. The patients were not allowed to smoke, brush their teeth, eat, or drink anything for 1 h before sampling. Basal and stimulated saliva samples were collected with cotton-wrapped standard sterile sticks that were kept in the mouth for 3 min. After sampling, the saliva-imbued cotton tip was collected in a plastic tube in a standard manner according to the supplier’s instructions and was maintained at −20 °C until analysis.
Biochemical assessments, including complete blood count, prothrombin time, and total protein, albumin, bilirubin, serum TC, and CBG measurements, were performed using the basal blood samples. TC level was measured again 60 min after stim-ulation.
Biological assays
The severity of liver disease was assessed with the Child-Turcotte-Pugh (CTP) and Model for End-stage Liver Disease (MELD) scoring systems. Serum total protein, albumin, liver enzyme, and bilirubin levels were measured with calorimet-ric methods using a Roche Modular DP Autoanalyzer (Roche Diagnostics, 16 GmBH; Mannheim, Germany). The prothrom-bin time was measured by a coagulometric assay (Siemens Healthcare Diagnostic Products, GmbH). The total serum cor-tisol level was measured with ECLIA (E170, Roche Diagnostics;
Switzerland). CBG and SC measurements were performed by a radioimmunoassay (CBG-RIA-CT, DIAsource Immunoassays SA; Nivelles, Belgium) and ELISA (EUROIMMUN EQ, 6141-9601 S; Lübeck, Germany), respectively. The level of FC was calculated by Coolens’ formula as follows (12):
Serum free cortisol (FC)=√(z2+0.0122×TSC)−z
z=0.0167+0.182 (CBG−TSC) Definitions
The diagnosis of AI according to TC was defined as follows: a basal level (T0) of less than 5 µg/dL, a level of less than 18 µg/dL at 1 h after the injection of corticotrophin (T60), or an increase of less than 9 µg/dL from T0 to T60 (∆) (17,18). According to FC, AI was defined as a T60 level of less than 33 nmol/L (19-21). Statistical methods
Statistical analyses were performed using SPSS 18.0 software (SPSS Inc.; Chicago, IL, USA). Parameters were expressed as mean±SD or n (%). Continuous variables were compared by Student’s t-test. For the comparison of categorical variables, the Pearson chi-squared test was used. For comparing vari-ables of more than two groups, ANOVA was applied. The corre-lation between continuous variables was assessed with Spear-man’s correlation test. For SpearSpear-man’s coefficient, p<0.05 was accepted as significant.
RESULTS
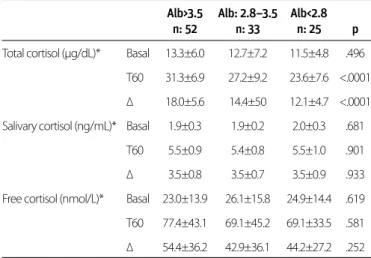
A total of 110 patients were enrolled. Their mean age was 62.1±11.4 years. Fifty-four (49.1%) patients were males. The etiologies of cirrhosis were hepatitis B, hepatitis C, and crypto-genic in 26 (24%), 33 (30%), and 33 (30%) patients, respectively. In the remaining 18 patients, other etiologic factors, including delta virus (n=3), autoimmune hepatitis (n=1), alcohol (n=7), primary biliary cirrhosis (n=5), and Budd-Chiari disease (n=2) were detected. The mean CTP score was 7.2±2.3. CBG levels were significantly different among the CTP groups (p=0.006). The demographic, clinical, and biochemical parameters of the patients according to their CTP groups are shown in Table 1. The mean basal TC levels were similar between the CTP groups (p= 0.788). From CTP-A to CTP-C patients, ∆ levels decreased in a statistically significant manner (p=0.003). No statistically sig-nificant difference was observed between the basal, T60, and ∆ levels of mean FC and SC among the CTP groups (p>0.05) (Table 2). With basal and stimulated levels, mean FC and SC, but not TC, showed similar changes between the albumin groups (≤2.5 g/dL, 2.5–3.5 g/dL, and >3.5 g/dL) (Table 3).
The mean basal TC level correlated fairly well with the mean basal FC and SC levels (p<0.0001, r=0.539, and r=0.502, respectively). There was a good correlation between the mean basal FC and SC levels (p<0.0001, r=0.706) (Figure 1). Post-stimulation levels of FC and SC were also correlated (p<0.0001, r=0.613). In CTP-C pa-tients, the basal TC level correlated fairly well with the serum FC
Or
iginal Ar
level (p=0.013, r=0.521), whereas there was a good correlation be-tween the basal FC and SC levels (r=0.748, p<0.0001).
For mean TC measurements, basal levels were similar (p>0.05) for patients with high (≥12) and low (<12) MELD scores, where-as the T60 and ∆ levels were significantly low among patients with high MELD scores (p=0.025 and p=0.007, respectively). The basal, T60, and ∆ levels of SC did not show any statistically significant differences between the MELD groups (p>0.05). However, the mean basal FC level was lower in the group with high MELD scores, and T60 and ∆ levels of FC were similar be-tween the MELD groups (p>0.05).
According to the TC levels, AI was diagnosed in 23 (20.9%) of 110 patients. In total, 34.1% (14/41) of the patients with high MELD scores and 13% (9/69) of those with low MELD scores
were diagnosed with AI. This difference was statistically signifi-cant (p=0.014).
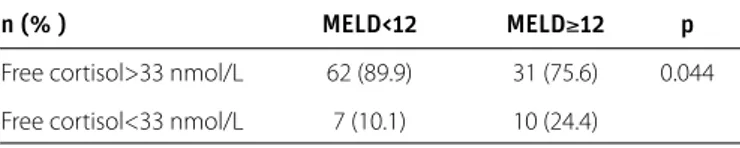
According to the FC measurements, 17 (15.5%) patients were diagnosed with AI. Within the group with high MELD scores, a significantly higher percentage of patients satisfied the crite-ria for AI (p=0.044). Patients with high (≥12) MELD scores were more likely to have AI. The difference was statistically signifi-cant (Table 4). Out of 23 patients who were diagnosed with AI based on TC levels, 9 had FC levels of less than 33 nmol/L. The agreement between these tests for the diagnosis of AI in cir-rhotic patients was low (kappa=0.331) (Table 5).
DISCUSSION
AI has been reported to be high among cirrhotic patients. Ac-cording to the low dose ACTH test results, AI with TC criteria
Or
iginal Ar
ticle
Patients CTP-A CTP-B CTP-C p*
Total cortisol Basal 12.6±6.03 13.3±7.1 12.2±5.1 .788 (µg/dL)*** T60 29.8±7.7 28.4±9.3 24.6±7.4 .046 ∆ 17.1±5.5 15.0±5.7 12.3±4.9** .003 Salivary Basal 1.9±0.27 1.9±0.2 2.0±0.3 .154 cortisol T60 5.4±0.9 5.5±0.7 5.6±1.2 .863 (ng/mL)*** ∆ 3.5±0.8 3.5±0.6 3.5±1.0 .981 Free cortisol Basal 15.3±1.2 15.7±1.4 15.9±1.6 .168 (nmol/L)*** T60 57.8±29.9 49.7±26.0 49.9±21.0 .309 ∆ 42.4±30.3 33.9±26.4 33.9±21.9 .281 ∆: increase from T0 to T60; CTP: Child-Turcotte-Pugh; T60: level at 60 minutes after stimulation Within-group comparison was performed after Bonferroni correction.
*p: for comparison within all groups. **p=0.003 for comparison between A and C. ***Mean±standard deviation
Table 2. Basal and post-stimulation levels of total, free, and salivary cortisol according to CTP groups
Alb>3.5 Alb: 2.8–3.5 Alb<2.8 n: 52 n: 33 n: 25 p Total cortisol (µg/dL)* Basal 13.3±6.0 12.7±7.2 11.5±4.8 .496
T60 31.3±6.9 27.2±9.2 23.6±7.6 <.0001 ∆ 18.0±5.6 14.4±50 12.1±4.7 <.0001 Salivary cortisol (ng/mL)* Basal 1.9±0.3 1.9±0.2 2.0±0.3 .681
T60 5.5±0.9 5.4±0.8 5.5±1.0 .901 ∆ 3.5±0.8 3.5±0.7 3.5±0.9 .933 Free cortisol (nmol/L)* Basal 23.0±13.9 26.1±15.8 24.9±14.4 .619 T60 77.4±43.1 69.1±45.2 69.1±33.5 .581 ∆ 54.4±36.2 42.9±36.1 44.2±27.2 .252 *Mean±standard deviation
T60: 60 min after stimulation; ∆: increase from T0 to T60
Table 3. Mean basal and post-stimulation levels of total, free, and salivary cortisol among albumin groups
CTP-A CTP-B CTP-C Patients n: 56 n: 32 n: 22 p** Age (years)* 60.4± 11.8 66.3±9.8 60.5±11.5 NS Hematocrit (%)* 39.1±4.3 34.4±6.0 30.7±4.9a .0001 Leukocyte (×103/µL)* 5.09± 1.97 5.66±2.25 6.43±3.22 NS Platelet (×103/µL)* 115.85±60.10 140.31±9.516 119.50±69.10 NS Albumin (g/dL)* 3.9±0.4*** 3.1±0.5*** 2.52±0.41*** <.0001 Bilirubin (mg/dL)* 1.05±0.54 1.22±0.61k 4.66±4.88 <.0001 PT (s)* 13.7±2.3 15.4±3.5 17.1±3.4 b <.0001 MELD* 8.5±2.4x 11.2±3.2m 15.9±4.9c <.0001 CBG* (µg/mL) 67.1±38.6 53.4±28.3 42.1±8.4d .006 Creatinine* (µg/dL) 0.75±0.22y 1.01±0.44 0.9±0.4 .002 Ascites Absent 46 (82.1) 5 (15.6) 1 (4.5) n (%) Mild to moderate 10 (17.9) 7 (21.9) 3 (13.6) <.0001 Severe 0 (0) 20 (62.5) 18 (81.8) Cryptogenic (%) 11(20) 12(37) 10 (45) -HBV n (%) 19 (34) 4 (13) 3 (14) -HCV n (%) 19 (34) 9 (28) 5 (23) -Other etiologies n (%) 7 (2) 7 (22) 4 (18) -Peritonitis n (%) 0 4 (13) 6 (27)e .003 Encephalopathy n (%) 0 7 (22)n 13 (59)f <.0001 Diuretic use n (%) 10 (18)g 25 (78) 18 (82)z <.0001
CTP: Child-Turcotte-Pugh; MELD: model for end-stage liver disease; CBG: cortisol-binding globu-lin; PT: prothrombin time; HBV: Hepatitis B virus; HCV: Hepatitis C virus; NS: non-significant Within-group comparison was performed after Bonferroni correction.
*Mean±standard deviation **p: for comparison within all groups.
ap<.0001, bp<.0001, cp<.0001, dp=.006, ep<.0001, fp<.0001, gp<.0001 for comparison between A
and C, respectively.
kp<.0001, mp<.0001, np<.0001 for comparison between B and C, respectively. xp=.001, yp=.003, zp<.0001 for comparison between A and B, respectively.
***p<.0001 for comparison among A- B, B-C, and A- C.
Table 1. Demographic, clinical, and biochemical parameters of patients according to CTP groups
was detected in 20.9% of our stable cirrhotic patients. In a simi-lar population, Galbois et al. (16) reported a higher rate (33%) for AI. AI was detected in 39% of patients who were on the wait-ing list for liver transplantation (22). We reported AI prevalences of 34% and 13% in the groups with high (≥12) and low (<12) MELD scores, respectively (p=0.014). Fede et al. (1) reported a relatively higher prevalence of 38% for AI. In that trial, 72% of enrolled cirrhotic patients were in the CTP-B and CTP-C groups with a mean MELD of 17. In our study, only 37.3% of all patients had MELD scores of 12 or higher. This heterogeneity of disease severity of the patients could explain the different reports of AI prevalence rates in several trials.
In serum, more than 90% of cortisol is bound to CBG and al-bumin (13). Because cirrhotic patients have low CBG levels, standard methods for measuring TC levels (including both free and protein bound fractions) may overestimate the AI rate in this population. In accordance with the literature, in our study, CBG levels decreased from the CTP-A to the CTP-C groups (16,23). Hamrahian et al. (10) reported high FC levels in critically ill hypoproteinemia patients who were diagnosed with AI according to basal and post-ACTH levels of TC. These data point to the potential misdiagnosis of AI on the basis of TC in hypoproteinemia patients and raise questions regarding the diagnostic accuracy of TC for such patients. In our study, the mean basal TC levels did not differ among albumin groups (<2.8 g/dL, 2.8–3.5 g/dL, and >3.5 g/dL), while T60 and ∆ levels were significantly lower in the low albumin group (p<0.0001). Thevenot et al. (23) reported similar FC levels for patients who had hypoalbuminemia (<2.5 g/dL), low CBG levels, and insuf-ficient response to the ACTH test. We reported similar findings with the CTP and MELD groups. In accordance with the sever-ity of cirrhosis, the trend of post-ACTH TC levels, rather than the basal measurements, is insufficient. Differences in CBG levels (i.e., decreasing with disease severity) may explain this discrep-ancy (16,23). Thevenot et al. (23) also defined the associations of MELD score, albumin level, and low CBG with insufficient cortisol responses to the ACTH test.
A post-stimulation peak FC level of <33 nmol/L has been used to define AI (19,21). Serum FC, estimated with Coolens’ formula, was lower than 33 nmol/L in 15.5% of our patients. Within the group with the high MELD (≥12) scores, this rate reached 24.4%, which was significantly higher than the rate in the group with low MELD scores (p=0.044). According to se-rum FC measurements, Tan et al. (2) reported an AI rate of 12%. All these patients had significantly high MELD scores (19±0.8 vs. 13±0.8) and presented a poor prognosis on follow-up. Salivary cortisol has been reported to be correlated with FC levels (24). In our study, the basal levels of these two measure-ments were found to be well correlated (r=0.706, p<0.0001). In a recent study reporting a similar correlation, 33% of all cirrhot-ic patients were diagnosed as having AI with the TC criteria. Considering SC, only 9% had a diagnosis of AI that was defined as fulfilling at least one of the SC criteria, which include a basal level of <1.8 ng/mL, a post-stimulation value of <12.7 ng/mL, and an increment of <3 ng/mL. Multivariate analysis indicated the independent association of hypoalbuminemia (<25 g/L) with the low agreement between SC and TC tests (kappa=0.28) for the diagnosis of AI (16).
Considering SC, there is no consensus on the standard thresh-olds for basal, T60, and ∆ levels in the diagnosis of AI. In the literature, the suggested cutoff levels are 1.81 ng/mL for basal (25), 3 ng/mL for incremental (26), and 11.7 ng/mL for T60 lev-els (19). Another reported threshold for the T60 level is 4.9 ng/ mL (27). Due to the conflicting data regarding the definition of AI on the basis of SC, it was not possible to present the preva-lence rate of AI for SC in our study.
The most important limitation of this study was the lack of standard thresholds for SC in the diagnosis of AI. It was pos-sible to determine the basal reference levels for SC with our own kit in the control group. However, due to ethical issues, we could not define the post-stimulation reference range for SC in healthy controls with our own kit.
In conclusion, the measurement of TC overestimates the diag-nosis of AI in cirrhosis. Basal and post-ACTH test levels of TC may not reflect the true prevalence of AI in cirrhotic patients, particularly among those with high MELD scores. As it corre-lates well with FC, SC may be a surrogate marker for the di-agnosis of AI in cirrhosis. For SC to be a valid alternative, more studies are needed to determine the optimal basal and post-stimulation cutoff levels for the diagnosis of AI in cirrhosis.
Ethics Committee Approval: Ethics committee approval was
re-ceived for this study from the ethics committee of Başkent University (KA10/154).
Informed Consent: Written informed consent was obtained from
pa-tients who participated in this study.
Peer-review: Externally peer-reviewed.
Or
iginal Ar
ticle
n (% ) MELD<12 MELD≥12 p
Free cortisol>33 nmol/L 62 (89.9) 31 (75.6) 0.044 Free cortisol<33 nmol/L 7 (10.1) 10 (24.4)
MELD: model for end-stage liver disease
Table 4. Adrenal insufficiency for MELD groups according to free cortisol level
Adrenal No adrenal insufficiency insufficiency according to according to
n (%) total cortisol total cortisol Kappa Free cortisol>33 nmol/L 14 (60.9) 79 (90.8)
0.331 Free cortisol<33 nmol/L 9 (39.1) 8 (9.2)
Table 5. Adrenal insufficiency rates according to total cortisol and free cortisol levels
Author Contributions: Concept - F.A., B.Ö.; Design - F.A., B.Ö.;
Supervi-sion - B.Ö., E.S.; Materials - F.A., B.Ö.; Data Collection and/or Process-ing - F.A., B.S.; Analysis and/or Interpretation - F.A., B.Ö., E.S.; Literature Review - F.A., B.S.; Writer - F.A.; Critical Review - B.Ö., E.S.
Acknowledgements: The study was funded with Başkent University
Research Fund.
Conflict of Interest: No conflict of interest was declared by the
au-thors.
Financial Disclosure: The authors declared that this study has
re-ceived no financial support.
REFERENCES
1. Fede G, Spadaro L, Tomaselli T, et al. Assessment of adrenocortical reserve in stable patients with cirrhosis. J Hepatol 2011; 54: 243-50.
[CrossRef]
2. Tan T, Chang L, Woodward A, et al. Characterizing adrenal func-tion using directly measured plasma free cortisol in stable liver disease. J Hepatol 2010; 53: 841-8. [CrossRef]
3. Marik PE, Gayowsky T, Starzl TE; Hepatic Cortisol Research and Adrenal Pathophysiology Study Group. The hepatoadrenal syn-drome: A common yet unrecognized clinical condition. Crit Care Med 2005; 33: 1254-9. [CrossRef]
4. Tsai MH, Peng YS, Chen YC, et al. Adrenal insufficiency in patients with cirrhosis, severe sepsis and septic shock. Hepatology 2006; 43: 673-81. [CrossRef]
5. Harry R, Auzinger G, Wendon J. The clinical importance of adrenal insufficiency in acute hepatic dysfunction. Hepatology 2002; 36: 395-402. [CrossRef]
6. Thierry S, Giroux Leprieur E, Brocas E, Van de Louw A. Echocardio-graphic features, mortality and adrenal function in patients with cirrhosis and septic shock. Acta Anaesthesiol Scand 2008; 52: 45-51. [CrossRef]
7. Fernández J, Escorsell A, Zabalza M, et al. Adrenal insufficiency in patients with cirrhosis and septic shock: Effect of treatment with hydrocortisone on survival. Hepatology 2006; 44: 1288-95.
[CrossRef]
8. Thevenot T, Borot S, Remy-Martin A, et al. Assessing adrenal func-tion in cirrhotic patients: Is there a reliable test? Gastroenterol Clin Biol 2009; 33: 584-8. [CrossRef]
9. Greenspan FS, Gardner DG. Basic and Clinical Endocrinology. 7thed. New York: Lange Medical Books/ McGraw-Hill; 2004. 10. Hamrahian AH, Oseini TS, Arafah BM. Measurement of serum free
cortisol in critically ill patients. N Eng J Med 2004; 350: 1629-38.
[CrossRef]
11. Gatti R, Antonelli G, Prearo M, Spinella P, Cappellin E, De Palo EF. Cortisol assays and diagnostic laboratory procedures in human biological fluids. Clin Biochem 2009; 42: 1205-17. [CrossRef]
12. Coolens JL, Van Baelen H, Heyns W. Clinical use of unbound plasma cortisol as calculated from total cortisol and corticosteroid-binding globulin. J Steroid Biochem 1987; 26: 197-202. [CrossRef]
13. Arafah BM, Nishiyama FJ, Tlaygeh H, Hejal R. Measurement of sali-vary cortisol concentration in the assessment of adrenal function in critically ill subjects: A surrogate marker of the circulating free cortisol. J Clin Endocrinol Metab 2007; 92: 2965-71. [CrossRef]
14. Annane D, Sebille V, Charpentier C, et al. Effect of treatment with low doses of hydrocortisone and fludrocortisone on mortality in patients with septic shock. JAMA 2002; 288: 862-71. [CrossRef]
15. Gröschl M. Current status of salivary hormone analysis. Clin Chem 2008; 54: 1759-69. [CrossRef]
16. Galbois A, Rudler M, Massard J, et al. Assesment of adrenal func-tion in cirrhotic patients: salivary cortisol should be preferred. J Hepatol 2010; 52: 839-45. [CrossRef]
17. Kronenberg HM, Melmed S, Polonsky KS, Larsen PR. Williams Textbook of Endocrinology. 11th edition. Philadelphia: Sounders, 2008.
18. Marik PE, Pastores SM, Annane D, et al. Recommendations for the diagnosis and management of corticosteroid insufficiency in critically ill adult patients: consensus statements from an interna-tional task force by the American College of Critical Care Medi-cine. Crit Care Med 2008; 36: 1937-49. [CrossRef]
19. Deutschbein T, Unger N, Mann K, Petersenn S. Diagnosis of sec-ondary adrenal insufficiency in patients with hypothalamic-pitu-itary disease: comparison between serum and salivary cortisol during high-dose short synacthen test. Eur J Endocrinol 2009; 160: 9-16. [CrossRef]
20. Lewis JG, Bagley CJ, Elder PA, Bachmann AW, Torpy DJ. Plasma free cortisol fraction reflects levels of functioning corticosteroid bind-ing globulin. Clin Chim Acta 2005; 359: 189-94. [CrossRef]
21. Vogeser M, Briegel J, Zachoval R. Dialyzable free cortisol after stim-ulation with Synacten. Clin Biochem 2002; 35: 539-43. [CrossRef]
22. Mc Donald JA, Handelsman DJ, Dilworth P. Hypothalamic-pitu-itary adrenal function in end-stage non-alcoholic liver disease. J Gastroenterol Hepatol 1993; 8: 247-53. [CrossRef]
23. Thevenot T, Borot S, Remy-Martin A, et al. Assessment of adrenal function in cirrhotic patients using concentration of serum-free and salivary cortisol. Liver Int 2011; 31: 425-33. [CrossRef]
24. Arafah BM. Review: Hypothalamic Pituitary Adrenal Function dur-ing Critical Illness: Limitation of Current Assessment Methods. J Clin Endocrinol Metab 2006; 91: 3725-45. [CrossRef]
25. Deutschbein T, Unger N, Mann K, Petersenn S. Diagnosis of sec-ondary adrenal insufficiency: unstimulated early morning cortisol in saliva and serum in comparison with the insulin tolerance test. Horm Metab Res 2009; 41: 834-9. [CrossRef]
26. Perogamvros I, Owen LJ, Keevil BG, Brabant G, Trainer PJ. Measure-ment of salivary cortisol with liquid chromatography-tandem mass spectrometry in patients undergoing dynamic endocrine testing. Clin Endocrinol 2010; 72: 17-21. [CrossRef]
27. Cardosa E, Persi G, Arregger AL, Contreras LN. Assessment of cor-ticoadrenal reserve through salivary steroids. The Endocriologist 2002; 12: 38-44. [CrossRef]
Or
iginal Ar