Original Article
I
ntroductIonHypertension (HT) is one of the most common risk factors for cardiovascular disease. A longstanding increase in blood pressure (BP) can lead to structural and electrical remodelling of the heart.[1‑3] It has been demonstrated
that changes in atrial size and fibrosis cause dispersion of refractoriness and alterations in atrial conduction. As a result, arrhythmia, especially atrial fibrillation (AF) may occur.[4] Pulsed wave tissue Doppler imaging (TDI) is one
of the noninvasive, easy applicable and accessible methods to evaluate atrial electromechanical conduction properties. Sequential analysis of atrial electromechanical coupling by TDI allows analysis of atrial electromechanical coupling between different regions. Total atrial activation time and interatrial electromechanical delay (defined by the dispersion
of right and left atrial electromechanical coupling) are mostly used TDI‑derived parameters. Previous studies have shown that prolongation of these parameters promote AF.[4‑6]
The aims of this study were (1) to identify early changes in atrial electromechanical conduction among hypertensive patients using TDI, (2) to assess the parameters that affect atrial electromechanical conduction.
Early Changes in Atrial Electromechanical Coupling in
Patients with Hypertension: Assessment by Tissue Doppler
Imaging
Burcak Kilickiran Avci, Oyku Gulmez, Guclu Donmez, Seckin Pehlivanoglu
Department of Cardiology, Baskent University, Istanbul Medical and Research Center, Oymacı Sok, 34662 Altunizade, Istanbul, Turkey
Background: Hypertension (HT) is associated with atrial electrophysiological abnormalities. Echocardiographic pulsed wave tissue
Doppler imaging (TDI) is one of the noninvasive methods for evaluation of atrial electromechanical properties. The aims of our study were to investigate the early changes in atrial electromechanical conduction in patients with HT and to assess the parameters that affect atrial electromechanical conduction.
Methods: Seventy‑six patients with HT (41 males, mean age 52.6 ± 9.0 years) and 41 controls (22 males, mean age 49.8 ± 7.9 years)
were included in the study. Atrial electromechanical coupling at the right (PRA), left (PLA), interatrial septum (PIS) were measured with TDI. Intra‑ (right: PIS‑PRA, left: PLA‑PIS) and inter‑atrial (PLA‑PRA) electromechanical delays were calculated. Maximum P‑wave duration (Pmax) was calculated from 12‑lead electrocardiogram.
Results: Atrial electromechanical coupling at PLA (76.6 ± 14.1 ms vs. 82.9 ± 15.8 ms, P = 0.036), left intra‑atrial (10.9 ± 5.0 ms vs.
14.0 ± 9.7 ms, P = 0.023), right intra‑atrial (10.6 ± 7.8 ms vs. 14.5 ± 10.1 ms, P = 0.035), and interatrial electromechanical (21.4 ± 9.8 ms vs. 28.3 ± 12.7 ms, P = 0.003) delays were significantly longer in patients with HT. The linear regression analysis showed that left ventricular (LV) mass index and Pmax were significantly associated with PLA (P = 0.001 and P = 0.002, respectively), and the LV mass index was the only related factor for interatrial delay (P = 0.001).
Conclusions: Intra‑ and interatrial electromechanical delay, PLA were significantly prolonged in hypertensive patients. LV mass index
and Pmax were significantly associated with PLA, and the LV mass index was the only related factor for interatrial delay. The atrial TDI can be a valuable method to assess the early changes of atrial electromechanical conduction properties in those patients.
Key words: Atrial Electromechanical Coupling; Hypertension; Tissue Doppler Imaging
Access this article online
Quick Response Code:
Website:
www.cmj.org
DOI:
10.4103/0366‑6999.182846
Abstract
Address for correspondence: Dr. Burcak Kilickiran Avci, Department of Cardiology, Baskent University, Istanbul Medical and Research Center, Oymacı Sok, No: 7; 34662 Altunizade, Istanbul, Turkey E‑Mail: [email protected]
This is an open access article distributed under the terms of the Creative Commons Attribution‑NonCommercial‑ShareAlike 3.0 License, which allows others to remix, tweak, and build upon the work non‑commercially, as long as the author is credited and the new creations are licensed under the identical terms.
For reprints contact: [email protected]
© 2016 Chinese Medical Journal ¦ Produced by Wolters Kluwer ‑ Medknow
Received: 19‑01‑2016 Edited by: Yi Cui
How to cite this article: Avci BK, Gulmez O, Donmez G, Pehlivanoglu S. Early Changes in Atrial Electromechanical Coupling in Patients with Hypertension: Assessment by Tissue Doppler Imaging. Chin Med J 2016;129:1311‑5.
M
ethodsStudy population
A total of 76 patients (41 male, mean age 52.6 ± 9.0 years), with Grade I or II HT according to the European Society of Cardiology/European Society of HT classification and a disease duration of maximum 6 months and 41 age‑matched healthy volunteers (22 male, mean age 49.8 ± 7.9 years) were included in the study. Patients with atrioventricular or intraventricular conduction defects on electrocardiogram (ECG), left ventricular (LV) ejection fraction (EF) <50%, significant valvular abnormalities, history of coronary artery disease, suspicion of secondary HT, history of diabetes mellitus, thyroid disorders, pulmonary diseases, and renal failure, electrolyte imbalance, technically insufficient echocardiographic and ECG data were excluded. All subjects were in sinus rhythm and none of them were taking medications with antiarrhythmic properties (including beta‑blockers and nondihydropyridine calcium channel blockers), tricyclic antidepressants, and antipsychotic drugs causing prolongation of PR duration. The maximal treadmill exercise test according to Bruce protocol was performed to the majority of study subjects to rule out the coronary artery disease. Control subjects were normal volunteers with no systemic diseases and no current drug users.
Ethics
The study protocol was approved by the Local Ethics Committee. All study groups understood the purpose, process of the study and provided written informed consent before participation to the study.
Electrocardiography
Standard 12‑lead ECG recordings were obtained using a recorder (Philips, PageWriter Trim II ECG Machine, Davis MEdical Electronics, California, USA) set at a rate of 50 mm/s paper speed and 2 mV/cm standardization in the supine position. P‑wave duration was measured manually with calipers and magnifying glass by a qualified investigator who was blinded to the study. The onset of the P‑wave was defined as the junction between isoelectric line and the start of the P‑wave first upward deflection. The offset of the P‑wave was defined as the junction between the end of the P‑wave downward deflection and the isoelectric line. Maximum P‑wave duration (Pmax) in any of the 12‑lead surface ECGs was measured.
Transthoracic echocardiography
Transthoracic echocardiographic examinations were performed using commercially available cardiac ultrasound scanner (Acuson Sequoia 512 System with 2.5–4.0 MHz Transducer, Siemens Mountain View, California, USA) in the left lateral position according to the criteria of the American Society of Echocardiography.[7] Loops from
five cardiac cycles were acquired at end‑expiration during quiet breathing. During echocardiography, one‑lead ECG recording was recorded continuously.
LV EF was calculated according to the biplane Simpson’s rule. The LV mass (LVM) was calculated with the Devereux
formula as LVM (g) = 1.04 ([LVID + PWT + IVST]³ −LVID³) −14 (LVID: LV internal dimension; PWT: Posterior wall thickness; IVST: IVS thickness) and indexed to the body surface area (dividing LVM by body surface area).[8] Left
atrial volumes were determined at ventricular end‑systole according to area‑length method using apical 4‑ and 2‑chamber views. The peak early diastolic velocity (E) was measured from the transmitral pulsed wave Doppler spectra. The pulsed wave TDI were performed with a sample volume of 5 mm and the monitor sweep speed was set at 100 mm/s to optimize the spectral display of myocardial velocities. The average pulsed wave TDI‑derived early diastolic myocardial velocity (E’) was obtained from the septal and lateral sides of the mitral annulus. Then, E/E’ ratio was calculated to provide an estimation of LV filling pressures.[9] The myocardial
performance index (MPI), which is a noninvasive Doppler measurement of global ventricular function, was calculated as the ratio of isovolumic contraction and relaxation times to ejection time. All Doppler spectral velocities were recorded at sweep speed of 100 mm/s and values were averaged over 3 consecutive beats.
Atrial tissue Doppler imaging
Standard two‑dimensional apical 4‑chamber views were obtained to visualize the right atrium (RA) and left atrium (LA) free walls. Pulsed wave TDI recordings were applied, and the sample volume was placed as parallel as possible to ensure the optimal angle of imaging at the RA free wall, the interatrial septum (IAS), and the LA free wall just below the level of the atrioventricular annulus. The time intervals from the onset of the P‑wave on the surface ECG to the beginning of the late diastolic TDI signal (A’), which is called atrial electromechanical coupling time, were measured from the LA (PLA), IAS (PIS), and RA (PRA). Values were averaged over 3 consecutive beats. The following parameters were calculated: “Left intra‑atrial delay” (LA delay) was defined as the differences between PLA and PIS; “Right intra‑atrial delay” (RA delay) was defined as the differences between PIS and PRA; “Interatrial delay” was defined as the difference between PLA and PRA.
Reproducibility of measurements
The intraobserver variability was assessed in twenty subjects at random from the patient study group by repeating measurements under the same basal conditions. To test the interobserver variability, the measurements were performed offline from the video recordings by a second observer. Correlation coefficients (Pearson’s r) for intraobserver variability were 0.89, 0.87, 0.90 for PLA, PIS and PRA; and interobserver variability were 0.83, 0.81, and 0.85 for PLA, PIS, and PRA, respectively.
Statistical analysis
The statistical analyses were performed with the SPSS package, version 11.0 (SPSS Inc., Chicago, IL, USA). All continuous variables were expressed as mean ± standard deviation (SD), and categorical variables were defined as percentages. All continuous variables checked with
Kolmogorov–Smirnov normality test to show their distributions. Continuous variables with normal distributions were compared using the unpaired Student’s t‑test. Continuous variables with abnormal distributions were compared using the Mann–Whitney U‑test. For categorical variables, the Chi‑square test was used. Pearson’s correlation coefficients were used to assess the strength of the relationship between continuous variables. A stepwise, multiple regression analysis was used to identify significant determinants of electromechanical delay. Thus, all predetermined independent variables that correlated with a P < 0.1 in the Pearson’s correlations were inserted into stepwise, linear regression analysis. A value of P < 0.05 was considered statistically significant.
r
esultsPatient characteristics
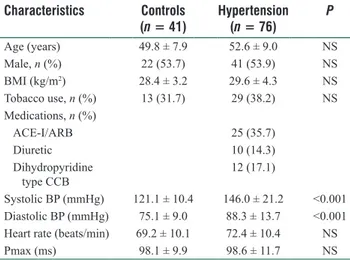
Demographic and clinical characteristics of the study population are shown in Table 1. The two groups were similar with regards to age, sex, body mass index, and smoking status. By definition, hypertensive subjects had higher BP. Most of the patients (56.6%) were given medication within the 90 days after index diagnosis with at least one of the antihypertensive drugs (i.e., angiotensin‑2 receptor blockers, angiotensin‑converting enzyme inhibitors, dihydropyridine calcium channel blockers and diuretics). Maximum P‑wave duration was not different between the groups (98.6 ± 11.7 ms vs. 98.1 ± 9.9 ms, P = 0.824, respectively). Only nine patients with HT (12%) and three subjects in the control group (7%) had P‑wave durations ≥110 ms.
Transthoracic echocardiographic parameters and atrial tissue Doppler imaging
The transthoracic echocardiographic data are presented in Table 2. LVM index, LA volume index, E/E’ and MPI ratios were higher in the hypertensive group (P < 0.001,
P = 0.014, P = 0.011 and P < 0.001, respectively). EF was
similar between the groups.
The results of atrial electromechanical coupling parameters measured by TDI are summarized in Table 3. PRA and PIS did not differ significantly between the groups (P > 0.05). PLA was significantly prolonged in the hypertensive group. To determine the influential factors of PLA, we examined potential variables which thought to be echocardiographically relevant: LVM index, LA dimension, LA volume index, E/E’ ratio, MPI, and Pmax. We found a significant correlation between PLA and Pmax (r = 0.289, P = 0.002), LA volume index (r = 0.274, P = 0.003) and LVM index (r = 0.347,
P = 0.001). The stepwise linear regression analysis showed
that the LVM index and Pmax were independent predictors of PLA (r = 0.436, P < 0.001, and P = 0.002, respectively). Interatrial delay was significantly prolonged in the hypertensive group (P < 0.05). Although there was a positive correlation between the interatrial delay and LVM index (r = 0.316, P = 0.001), there was no significant correlation between the interatrial delay and LA volume
Table 1: Patients characteristics of the study population
Characteristics Controls (n = 41) Hypertension (n = 76) P Age (years) 49.8 ± 7.9 52.6 ± 9.0 NS Male, n (%) 22 (53.7) 41 (53.9) NS BMI (kg/m2) 28.4 ± 3.2 29.6 ± 4.3 NS Tobacco use, n (%) 13 (31.7) 29 (38.2) NS Medications, n (%) ACE‑I/ARB 25 (35.7) Diuretic 10 (14.3) Dihydropyridine type CCB 12 (17.1) Systolic BP (mmHg) 121.1 ± 10.4 146.0 ± 21.2 <0.001 Diastolic BP (mmHg) 75.1 ± 9.0 88.3 ± 13.7 <0.001 Heart rate (beats/min) 69.2 ± 10.1 72.4 ± 10.4 NS
Pmax (ms) 98.1 ± 9.9 98.6 ± 11.7 NS
Data are presented as n (%) or mean ± standard deviation. BMI: Body mass index; ACE‑I: Angiotensin‑converting enzyme inhibitor; ARB: Angiotensin receptor blocker; CCB: Calcium channel blocker; NS: Not significant; BP: Blood pressure; 1mmHg=0.133kPa.
Table 2: Echocardiographic parameters
Variables Controls
(n = 41) Hypertension (n = 76) P LV end‑diastolic dimension (mm) 48 ± 3.7 49 ± 4.1 NS LV end‑systolic dimension (mm) 29 ± 3.8 29 ± 3.4 NS Septum thickness (mm) 10.8 ± 1.0 12.9 ± 1.9 0.0001 Posterior wall thickness (mm) 10.3 ± 1.0 12.1 ± 1.5 0.0001 LV mass index (g/m2) 99.7 ± 18.4 130.0 ± 37.3 <0.0001 RA dimension (mm) 34.1 ± 2.8 34.0 ± 3.4 NS LA dimension (mm) 35.4 ± 2.6 36.7 ± 3.6 0.054 LA volume index (ml/m2) 25.0 ± 4.8 27.7 ± 6.5 0.014 EF (%) 63.5 ± 3.8 62.3 ± 4.5 NS E/E’ 5.4 ± 1.4 6.1 ± 1.7 0.011 MPI 0.48 ± 0.07 0.57 ± 0.09 <0.0001 Data are presented as mean ± standard deviation. LV: Left ventricle; RA: Right atrium; LA: Left atrium; EF: Ejection fraction; E/E’: Early diastolic velocity/Early diastolic myocardial velocity; MPI: Myocardial performance index; NS: Not significant.
Table 3: Atrial electromechanical coupling findings measured by tissue Doppler imaging
Variables Controls (n = 41) Hypertension (n = 76) P PLA (ms) 76.6 ± 14.1 82.9 ± 15.8 0.036 PIS (ms) 65.8 ± 14.0 70.3 ± 15.2 NS PRA (ms) 55.3 ± 15.3 56.3 ± 17.3 NS LA delay (ms) 10.9 ± 5.0 14.0 ± 9.7 0.023 RA delay (ms) 10.6 ± 7.8 14.5 ± 10.1 0.035 Interatrial delay (ms) 21.4 ± 9.8 28.3 ± 12.7 0.003 Data are presented as mean ± standard deviation. PLA: Left atrial electromechanical coupling time; PIS: Interatrial septum electromechanical coupling time; PRA: Right atrial electromechanical coupling time; LA: Left intraatrial; RA: Right intraatrial; NS: Not significant.
index, LA diameter, RA diameter, LV MPI and E/E’ ratio. In stepwise linear regression analysis, LVM index was demonstrated to be independently associated with interatrial delay (r = 0.348, P = 0.001). The LA delay and RA delay
were also significantly prolonged in hypertensive patients. However, there was no relationship between LA delay and Pmax, LA volume index, E/E’ ratio, LV MPI ratio, or LVM index. Moreover, no significant correlation between RA delay and the other parameters were found.
d
IscussIonHT can lead to alteration in atrial conduction. Atrial conduction disorders and resultant abnormalities are associated with a higher risk of paroxysmal atrial tachyarrhythmia.[4‑6] In most
studies, atrial conduction properties are determined invasively by performing electrophysiologic studies. However, atrial electromechanical coupling and intra‑ and inter‑atrial conduction delays can be performed noninvasively by TDI, which has already been proved useful for evaluating atrial impairment in patients with paroxysmal AF and various diseases such as mitral stenosis, type 2 diabetes mellitus, scleroderma.[5,10‑15]
In this study, we used TDI to assess atrial electromechanical conduction properties in patients with HT and without history of AF. Contrary to LA size and LA volume index, prolonged atrial conduction times indicate both electrical and structural remodelling of the atria. We hypothesized that pulsed wave TDI would identify early abnormalities in atrial conduction. In our study, it was shown that PLA, intra‑ and inter‑atrial conduction delays were prolonged. The prolongation of atrial conduction times in this study confirmed the previous findings of Emiroglu et al. However, in that study, the study population included hypertensive patients for at least 4 years and whose BP remained elevated while our study population included patients with Grade I and II HT with disease duration of maximum 6 months.[16] Similarly to our results, Ermis et al., showed
that intra‑ and inter‑atrial conduction times were prolonged in prehypertensive patients.[17] On the basis of these findings, we
speculate that intra‑ and inter‑atrial electromechanical delay and PLA might occur at early times of HT.
Our study also showed that LVM index and Pmax were independent predictors of PLA which is in line with the study of Emiroglu et al. PLA has been used as noninvasive criteria to estimate the total atrial conduction time.[16,18]
Prolonged total atrial conduction times are often present in patients with increased P‑wave duration on 12‑lead ECG.[18,19] Prolonged P‑wave duration is also known as an
electrophysiological marker to evaluate the inhomogeneous conduction of sinus impulses. In the present study, although Pmax did not differ significantly between the groups, there was significant difference in the TDI‑derived PLA. The absence of prolonged P‑wave on the 12‑lead ECG might be because of the study population, which many of them recently diagnosed as hypertensive, and having normal atrial dimension and volume. Thus, TDI could demonstrate earlier period of atrial electromechanical impairment before appearance of obvious prolongation of P‑wave on the 12‑lead ECG. Moreover, the main difference of our study from the previous ones is that the previous studies mostly included patients with documented paroxysmal AF, which means atrial electrical abnormalities have already developed.[3‑6]
We demonstrated that LVM index is an independent predictor of both prolonged interatrial delay and PLA. The structural and electrophysiological changes in the myocardium caused by HT might play role in this relationship.[20] The baseline
severity of LV hypertrophy has been reported to be a significant predictor of the development of the new‑onset AF in many studies. Previous studies have shown that reducing BP with blockade of the renin‑angiotensin system, reduce AF incidence in patients with HT.[21‑23] Potential mechanisms of
AF prevention supported by these studies include regression of LV muscle mass. It is possible to consider that LA structural remodeling (i.e., altered atrial tissue architecture or interstitial fibrosis) concomitant to LV hypertrophy might lead to nonhomogeneity of atrial conduction, dispersion of atrial refractoriness and conduction delay which is associated with a higher risk of atrial tachyarrhythmia. Taken together these findings with our results, we suggest that LA structural remodelling detected by TDI might be used to predict atrial tachyarrhythmia. Further studies of the relationship of changes in atrial conduction to changing values of LVM index during antihypertensive therapy will hopefully provide greater insights into this potential mechanistic link between LVM regression and the development of atrial tachyarrhythmia.
Our study had some limitations. As this was a cross‑sectional study, follow‑up of the patients for arrhythmic episodes and the relationship between BP control and abnormal atrial electrical activity could not be done. Therefore, we cannot comment if prolongation of intra‑ and inter‑atrial delay precipitated AF in patients with HT with a disease duration of 6 months. Also, the population size was relatively small. Moreover, we included the patients with known HT with a disease duration of maximum 6 months according to the patients’ reports. For this reason, long‑term follow‑up and large‑scale prospective studies are needed to determine the clinical predictive value of prolonged intra‑ and interatrial electromechanical delays in this population.
The results of our study showed prolonged PLA and intra‑, inter‑atrial delays might be an important marker of early atrial structural and electromechanical changes in patients with Grade I and II HT and without history of AF and with disease duration of maximum 6 months. The prolongation of these parameters might be related to LVM index. TDI is a noninvasive method to assess the atrial electromechanical remodeling even in patients with normal Pmax on surface 12‑lead ECG.
Financial support and sponsorship
Nil.
Conflicts of interest
There are no conflicts of interest.
r
eferences1. Leonetti G, Cuspidi C. The heart and vascular changes in hypertension. J Hypertens Suppl 1995;13:S29‑34.
et al. Pulse pressure and risk of new‑onset atrial fibrillation. JAMA 2007;297:709‑15. doi: 10.1001/jama.297.7.709.
3. Sega R, Trocino G, Lanzarotti A, Carugo S, Cesana G, Schiavina R, et al. Alterations of cardiac structure in patients with isolated office, ambulatory, or home hypertension: Data from the general population (Pressione Arteriose Monitorate E Loro Associazioni [PAMELA] Study). Circulation 2001;104:1385‑92. doi: 10.1161/hc3701.096100.
4. De Vos CB, Weijs B, Crijns HJ, Cheriex EC, Palmans A, Habets J, et al. Atrial tissue Doppler imaging for prediction of new‑onset atrial fibrillation. Heart 2009;95:835‑40. doi: 10.1136/hrt2008.148528. 5. Cui QQ, Zhang W, Wang H, Sun X, Wang R, Yang HY, et al.
Assessment of atrial electromechanical coupling and influential factors in nonrheumatic paroxysmal atrial fibrillation. Clin Cardiol 2008;31:74‑8. doi: 10.1002/clc20162.
6. Omi W, Nagai H, Takamura M, Okura S, Okajima M, Furusho H, et al. Doppler tissue analysis of atrial electromechanical coupling in paroxysmal atrial fibrillation. J Am Soc Echocardiogr 2005;18:39‑44. doi: 10.1016/j.echo.2004.08.029.
7. Quiñones MA, Otto CM, Stoddard M, Waggoner A, Zoghbi WA; Doppler Quantification Task Force of the Nomenclature and Standards Committee of the American Society of Echocardiography. Recommendations for quantification of Doppler echocardiography: A report from the Doppler Quantification Task Force of the Nomenclature and Standards Committee of the American Society of Echocardiography. J Am Soc Echocardiogr 2002;15:167‑84. doi: 10.1067/mje.2002.120202.
8. Devereux RB, Reichek N. Echocardiographic determination of left ventricular mass in man. Anatomic validation of the method. Circulation 1977;55:613‑8. doi: 10.1161/01.CIR.55.4.613.
9. Ommen SR, Nishimura RA, Appleton CP, Miller FA, Oh JK, Redfield MM, et al. Clinical utility of Doppler echocardiography and tissue Doppler imaging in the estimation of left ventricular filling pressures: A comparative simultaneous Doppler‑catheterization study. Circulation 2000;102:1788‑94. doi: 10.1161/01. CIR.102.15.1788.
10. Sakabe K, Fukuda N, Fukuda Y, Morishita S, Shinohara H, Tamura Y. Interatrial dyssynchrony on tissue Doppler imaging predicts progression to chronic atrial fibrillation in patients with non‑valvular paroxysmal atrial fibrillation. Heart 2009;95:988‑93. doi: 10.1136/ hrt.2008.152561.
11. Acar G, Akcay A, Sokmen A, Ozkaya M, Guler E, Sokmen G, et al. Assessment of atrial electromechanical delay, diastolic functions, and left atrial mechanical functions in patients with type 1 diabetes mellitus. J Am Soc Echocardiogr 2009;22:732‑8. doi: 10.1016/j. echo.2009.03.028.
12. Ozer N, Yavuz B, Can I, Atalar E, Aksöyek S, Ovünç K, et al. Doppler tissue evaluation of intra‑atrial and interatrial electromechanical delay and comparison with P‑wave dispersion in patients with mitral
stenosis. J Am Soc Echocardiogr 2005;18:945‑8. doi: 10.1016/j. echo.2005.01.015.
13. Roshanali F, Mandegar MH, Yousefnia MA, Rayatzadeh H, Alaeddini F, Amouzadeh F. Prediction of atrial fibrillation via atrial electromechanical interval after coronary artery bypass grafting. Circulation 2007;116:2012‑7. doi: 10.1161/ CIRCULATIONAHA.107.727081.
14. Can I, Onat AM, Aytemir K, Akdogan A, Ureten K, Kiraz S, et al. Assessment of atrial conduction in patients with scleroderma by tissue Doppler echocardiography and P wave dispersion. Cardiology 2007;108:317‑21. doi: 10.1159/000099102.
15. Van Beeumen K, Duytschaever M, Tavernier R, Van de Veire N, De Sutter J. Intra‑ and interatrial asynchrony in patients with heart failure. Am J Cardiol 2007;99:79‑83. doi: 10.1016/j.amjcard.2006.07.066. 16. Emiroglu MY, Bulut M, Sahin M, Acar G, Akcakoyun M, Kargin R,
et al. Assessment of atrial conduction time in patients with essential hypertension. J Electrocardiol 2011;44:251‑6. doi: 10.1016/j. jelectrocard.2010.09.012.
17. Ermis N, Açikgöz N, Yasar E, Tasolar H, Yagmur J, Cansel M, et al. Evaluation of atrial conduction time by P wave dispersion and tissue Doppler echocardiography in prehypertensive patients. Turk Kardiyol Dern Ars 2010;38:525‑30.
18. Merckx KL, De Vos CB, Palmans A, Habets J, Cheriex EC, Crijns HJ, et al. Atrial activation time determined by transthoracic Doppler tissue imaging can be used as an estimate of the total duration of atrial electrical activation. J Am Soc Echocardiogr 2005;18:940‑4. doi: 10.1016/j.echo.2005.03.022.
19. Centurion OA, Isomoto S, Fukatani M, Shimizu A, Konoe A, Tanigawa M, et al. Relationship between atrial conduction defects and fractionated atrial endocardial electrograms in patients with sick sinus syndrome. Pacing Clin Electrophysiol 1993;16:2022‑33. doi: 10.1111/j.1540‑8159.1993.tb00996.x.
20. Gradman AH, Alfayoumi F. From left ventricular hypertrophy to congestive heart failure: Management of hypertensive heart disease. Prog Cardiovasc Dis 2006;48:326‑41. doi: 10.1016/j. pcad.2006.02.001.
21. Okin PM, Wachtell K, Devereux RB, Harris KE, Jern S, Kjeldsen SE, et al. Regression of electrocardiographic left ventricular hypertrophy and decreased incidence of new‑onset atrial fibrillation in patients with hypertension. JAMA 2006;296:1242‑8. doi: 10.1001/ jama.296.10.1242.
22. Wachtell K, Devereux RB, Lyle PA, Okin PM, Gerdts E. The left atrium, atrial fibrillation, and the risk of stroke in hypertensive patients with left ventricular hypertrophy. Ther Adv Cardiovasc Dis 2008;2:507‑13. doi: 10.1177/1753944708093846.
23. Hennersdorf MG, Schueller PO, Steiner S, Strauer BE. Prevalence of paroxysmal atrial fibrillation depending on the regression of left ventricular hypertrophy in arterial hypertension. Hypertens Res 2007;30:535‑40. doi: 10.1291/hypres.30.535.