Journal of Physics D: Applied Physics
PAPER
A comparison of the magnetism of cobalt-,
manganese-, and nickel-ferrite nanoparticles
To cite this article: Ç E Demirci et al 2018 J. Phys. D: Appl. Phys. 51 025003
View the article online for updates and enhancements.
Related content
Cationic distribution and spin canting in CoFe2O4 nanoparticles
D Peddis, N Yaacoub, M Ferretti et al.
-Magnetic propertiesof nanostructured CuFe2O4
J Z Jiang, G F Goya and H R Rechenberg
-An integrated study of thermal treatment effects on the microstructure and magnetic properties of Zn–ferrite nanoparticles Bratislav Antic, Marija Perovic, Aleksandar Kremenovic et al.
-Recent citations
The relationship between magnetic properties and morphology of nanocomposites
Jianfeng Dai et al
-Ammonia gas sensing performance of nickel ferrite nanoparticles
Rajesh Kashyap et al
-10P
e
books™
Bringing together innovative digital publishing with
leading authors from the global scientific community.
Start exploring the collection-download the
first chapter of every title for free.
1 © 2017 IOP Publishing Ltd Printed in the UK
1. Introduction
Nanoparticles of spinel ferrites are one of the most attractive materials for the development of new technologies due to their behaviour at the nanoscale. A large number of ferrimagnetic compounds with spinel structures have found a wide range of applications, such as in spintronics [1], magnetocaloric refrig-eration [2, 3] magnetic resonance imaging [4] and magnetic hyperthermia [5]. A thorough understanding of their magnetic properties allows us to realize new potential applications with tailored properties that can be achieved with decreasing par-ticle size, changing the cation distributions of the tetrahedral and octahedral sites, or substituting these sites with different ions, such as the rare-earths to further alter the magnetism for applications.
The ideal spinel structure has a face centered cubic unit cell with 32 O2− anions and metal ions situated in the
pos-sible interstitial sites between the oxygen ions [6]. The general structural formula of a spinel can be represented as (M1−xFex)
[ MxFe2−x]O4 (M is the metal ion) [7], where round and square
brackets denote the tetrahedral (A site) and octahedral (B site) coordinations and x is the inversion parameter which is a quanti ty identifying the fraction of divalent ions in octahedral sites. The spinel structure is called ‘normal’ if all the diva-lent ions are located in tetrahedral sites, (M2+ )tet(Fe3+ )octO
4
and x = 0, ‘inverse’ if all the divalent ions are located in octa-hedral sites, (Fe3+ )tet(M2+ Fe3+ )octO
4 and x = 1 [6]. If the
divalent ions are located on both tetrahedral and octa hedral sites (0 < x < 1), the spinel is partially inverted [8]. The inversion degree may depend on the synthesis method [9–11],
Journal of Physics D: Applied Physics
A comparison of the magnetism
of cobalt-, manganese-, and nickel-ferrite
nanoparticles
Ç E Demirci1,2 , P K Manna2, Y Wroczynskyj2, S Aktürk1
and J van Lierop2,3
1 Department of Physics, Muğla Sıtkı Koçman University, 48000, Muğla, Turkey
2 Department of Physics and Astronomy, University of Manitoba, Winnipeg, MB, R3T 2N2, Canada 3 Manitoba Institute for Materials, Winnipeg, MB, R3T 2N2, Canada
E-mail: [email protected] and [email protected]
Received 9 August 2017, revised 20 November 2017 Accepted for publication 27 November 2017 Published 19 December 2017
Abstract
The microstructure, composition and magnetism of CoFe2O4, MnFe2O4 and NiFe2O4
nanoparticles of comparable sizes (∼20 nm) and interparticle spacings (∼20 nm) have been characterized from 10 to 400 K. The cation distributions of the tetrahedral and octahedral sites of the particles, that have cubic spinel structures, have a high degree of inversion, ∼0.98 for CoFe2O4, ∼0.80 for MnFe2O4 and NiFe2O4 nanoparticles. The
blocking temperatures were ∼300 K for the MnFe2O4 and NiFe2O4 nanoparticles, while the
CoFe2O4 nanoparticles, due to their higher intrinsic anisotropy had a significantly higher
blocking temperature above 400 K. Specifically, the magnetocrystalline anisotropy of the CoFe2O4 nanoparticles was K = (2.96 ± 0.03) × 106 ergs cm−3, while for the MnFe2O4
nanoparticles, K = (0.04 ± 0.01) × 106 ergs cm−3, and for the NiFe
2O4 nanoparticles, K = (0.07 ± 0.01) × 106 ergs cm−3. The magnetism of these three ferrite systems are
discussed in detail with regards to their microstructures and cation distributions. Keywords: cobalt ferrite, manganese ferrite, nickel ferrite, cation distribution (Some figures may appear in colour only in the online journal)
Ç E Demirci et al
A comparison of the magnetism of cobalt-, manganese- and nickel-ferrite nanoparticles
Printed in the UK
025003
JPAPBE
© 2017 IOP Publishing Ltd
51
J. Phys. D: Appl. Phys.
JPD
10.1088/1361-6463/aa9d79
Paper
2
Journal of Physics D: Applied Physics IOP
2018
1361-6463
1361-6463/18/025003+10$33.00
https://doi.org/10.1088/1361-6463/aa9d79 J. Phys. D: Appl. Phys. 51 (2018) 025003 (10pp)
IOP Publishing
®
thermal history of the materials (due to annealing) [10, 12], and particle size effects [13].
CoFe2O4, MnFe2O4 and NiFe2O4 are spinels where the
dis-tribution of the cations among the tetrahedral and octa hedral sites can be quite different [8] resulting in quite different mag-netism, especially at the nanoscale. For example, partially inverted spinel structures for CoFe2O4 and MnFe2O4 were
reported in which 80% Co2+ [8] and 20% Mn2+ [14] ions are
in octahedral sites with high and low degree of inversion for CoFe2O4 [15] and MnFe2O4 [8], respectively. MnFe2O4 is a
more complex system compared to CoFe2O4 and NiFe2O4, as
it can have different oxidation states of Mn atoms (Mn2+ and/
or Mn3+ ) [16–18]. By contrast, NiFe
2O4 is a totally inverted
spinel structure in which all the nickel ions are located in octa-hedral sites [17].
In this paper, we present the structural, compositional and magnetic properties of CoFe2O4, MnFe2O4 and NiFe2O4
nano-particles with similar sizes (∼20 nm) and similar interparticle spacings (∼20 nm). By decoupling the effects of interpar-ticle magnetism, we identify and discuss the nanoparinterpar-ticles’ magnetism in the context of their cation distributions. For example, an observed increase in the saturation magnetiza-tion of CoFe2O4 nanoparticles (∼2%) and NiFe2O4
nanopar-ticles (∼10%), and a decrease of the saturation magnetization of the MnFe2O4 nanoparticles (∼20%), all compared to their
bulk counterparts is understood in terms of the nanoparticles’ stoichiometries identified by low temperature Mössbauer spectroscopy in addition to a negligible number of Fe-ions distributed on the surface of all the particles, in keeping with the 20 nm nanoparticles surface-to-volume ratios.
2. Experimental methods
The nanoparticles were prepared using a method modified from the conventional organic phase process [19]. For the synthesis of CoFe2O4 nanoparticles, cobalt (II) acetate
tet-rahydrate (1 mmol) (⩾98.0%, Sigma-Aldrich) and iron (III) acetylacetonate (2 mmol) (97%, Sigma-Aldrich) were mixed with oleic acid (4 mL) (90%, Aldrich), oleylamine (4 mL) (70%, Aldrich) and dibenzyl ether (20 mL) (⩾98.0%, Sigma-Aldrich). The final mixture was sealed in a stainless-steel auto-clave. The resulting solution was then heated to 200 °C and maintained at this temperature for 6 h under vigorous stirring. After removing the heat source, the autoclave was cooled to room temperature, and the black precipitate was washed sev-eral times with methanol to remove excess ligands. The black precipitate was then collected using a magnet and washed with chloroform. MnFe2O4 and NiFe2O4 nanoparticles were
synthesized using a similar process, with manganese (II) acetylacetonate (1 mmol) (Sigma-Aldrich), nickel (II) acetate tetrahydrate (1 mmol) (98.0%, Sigma-Aldrich) and iron (III) acetylacetonate (2 mmol) (97%, Sigma-Aldrich) as reactants under similar reaction conditions, but autoclaved for different times (1 h and 4 h, respectively).
X-ray powder diffraction (XRD) patterns were collected at room temperature on a zero background quartz slide with a rotating stage using a Bruker D8 DaVinci diffractometer
and CuKα radiation. All the XRD patterns have been
ana-lyzed using the Rietveld refinement technique (FullProf pro-gram [20]). Transmission electron microscopy (TEM) images of the samples were collected using a FEI Talos F200X S/ TEM microscope. For TEM grid preparation, the nanopar-ticles were dispersed in hexane and aliquotes were dropped onto a carbon-coated copper grid. A dynamic light-scattering (DLS) apparatus (Photocor) was used with a 25 mW Coherent solid state laser with λ =632 nm to measure the hydrody-namic size of the particles and size distributions of dilutions of CoFe2O4 and NiFe2O4 nanoparticles suspended in
chlo-roform, and MnFe2O4 nanoparticles suspended in hexanes
at room temperature. Transmission Mössbauer spectra were collected at 30 K in a Cryo closed-cycle refrigeration system using a WissEl spectrometer in constant acceleration mode with a 10 GBq 57Co Rh source. The source drive velocity
was calibrated using a 6 μm thick α-Fe foil at room
temper-ature. Magnetometry and susceptometry was performed using a Quantum Design magnetic properties measurement system (MPMS XL-5).
3. Results and discussion
3.1. Structural analysis
The x-ray diffraction patterns of CoFe2O4, MnFe2O4 and
NiFe2O4 nanoparticles are shown in figures 1(a)–(c). All the
reflections correspond to those of CoFe2O4, MnFe2O4 and
NiFe2O4 nanoparticles and there is no evidence of any
impu-rity. Refinements of the x-ray diffraction patterns using the FullProf program [20] revealed that each of the nanoparticle system have a spinel structure described by the cubic F d3 m space group with lattice parameters 8.398 ± 0.001˚A for Figure 1. X-ray patterns of (a) CoFe2O4, (b) MnFe2O4, and (c) NiFe2O4 nanoparticles, with the results of the Rietveld refinements (black lines). The Bragg markers identify the reflections (green) and the residuals to the refinement are presented below (blue lines).
51 (a) CoFe 204 ""o 2 X 2 C :l 0 0
'
" I " 1 I 0 (b) MnFe204 ""o X U)c
::i 0"
'
I ' 1 ' " I II 0 4 (c) NiFep 4 M 0 X 2 U)c
:l 0 0 I 0 20 30 40 50 60 70 80 90 10() 20 (degrees)Ç E Demirci et al
3
CoFe2O4, 8.383 ± 0.001˚A for MnFe2O4, and 8.368 ± 0.001 ˚
A for NiFe2O4. Scherrer broadening of the diffraction peaks
incorporated into the refinements provides an estimate of ∼20 nm for the particle diameter of each of the ferrite nanoparticle systems.
Typical TEM images and the corresponding histogram plots of the sizes using ImageJ analysis [21] identify the particle size distribution of CoFe2O4, MnFe2O4 and NiFe2O4 nanoparticles
are shown in figures 2(a)–(f). While CoFe2O4 and NiFe2O4
nanoparticles are nearly spherical, the MnFe2O4 nanoparticles
present a mixed spherical and cubic morphology. The log-normal fits of the size histograms yielded the average diam-eters ( D ) with standard deviations (σ) as D = 17 ± 0.2 nm and σ =0.22 for CoFe2O4, D = 21 ± 0.1 nm and σ =0.19
for MnFe2O4, D = 19 ± 0.3 nm and σ =0.27 for NiFe2O4
nanoparticles. These sizes are in good agreement with those from the XRD refinements. We did not observe any peak asymmetry or unusual enhancement of the peak intensities in the XRD patterns of the ferrite systems which signifies the absence of any dominant or preferred crystallographic planes.
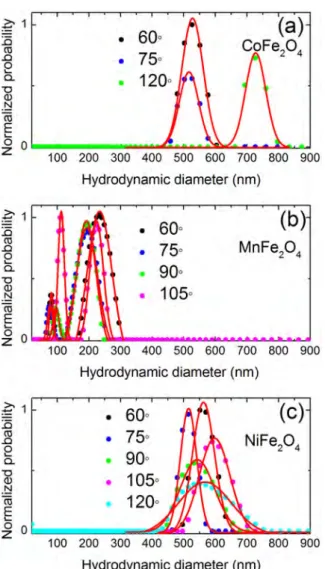
To better identify the clustering (that may impact the mag-netism through interparticle interactions) and its relevant size scale, hinted at in the TEM images (e.g. figure 2(c)), DLS measurements were made on nanoparticles suspended in organics and analyzed with the DynaLS© software (figures
3(a)–(c)). The different size distributions with scattering angle,
θ, indicate particle clusters in a size range ∼450–800 nm for
CoFe2O4, ∼60–300 nm for MnFe2O4 and ∼400–750 nm for
NiFe2O4 nanoparticles. Keep in mind that the DLS
measur-ments identify a hydrodynamic size which reflects the oleic acid (OA) coatings in addition to possible clustering effects in suspension. Gaussian hydrodynamic particle size distributions with an average of ∼600 ± 30 nm for CoFe2O4, ∼150 ± 20
nm for MnFe2O4 and ∼550 ± 50 nm for NiFe2O4
nanoparti-cles are consistent with the values previously reported for dif-ferent magnetic nanoparticles with surface coating [22], and indicates the existence of particle clusters of nanoparticles when in suspension.
To identify the compositions of the nanoparticles, Mössbauer spectra were collected at low temperature (30 K, well below the blocking temperature, TB, to ensure the spin
dynamics were negligible), as shown in figures 4(a)–(c). The spectra were fitted using a nonlinear least squares program with Lorentzian lineshapes, and the relative areas were used to determine the number of the ions in the sites. Excellent fits were obtained with superpositions of three subspectra for all samples. The Mössbauer parameters resulting from the fitting for each sample are listed in table 1. The presense of a B2 site is indicative of Fe ions that have a 2+ charge [23], which Figure 2. Typical TEM images of (a) CoFe2O4, (b) MnFe2O4,
and (c) NiFe2O4 nanoparticles. The corresponding size histograms ((d)–(f)) are shown with log-normal fits (red lines).
Figure 3. The hydrodynamic size distribution of (a) CoFe2O4, (b) MnFe2O4, and (c) NiFe2O4 nanoparticles measured by DLS. The red lines through the data at different scattering angles present the Gaussian fitting.
J. Phys. D: Appl. Phys. 51 (2018) 025003
(/)
c
::::, 50 0 (.) (/)-
C: ::::, 0 (.) nm 40 50 Diameter (nm) ~1 i5 ro .0e
a. -0 -~ro
E•
~o
~----
100 200 300 400 500 600 700 800 900-~
~
~
~~
-
~
~
~
Hydrodynamic diameter (nm) • 60°(b)
• 75° • 90° • 105° 100 200 300 400 500 600 700 800 900 Hydrodynamic diameter (nm) • 60°(c)
• 75° • 90° 100 200 300 400 500 600 700 800 900 Hydrodynamic diameter (nm)is likely due to some B-sites residing on the surface of the crystallites. However, unlike the Mössbauer spectra of many nanoscale ferrites [24, 25], no electric field gradient on the Fe-ions (i.e. a doublet) was observed which is expected for significant broken coordination. Estimate of the surface spin to core spin population ratio of ∼0.1 for all samples was cal-culated using the relative ratio of sublattices from Mössbauer measurements. This value of the ratio of surface to core spin is exactly matching with the value of ∼0.1 was obtained for all
samples by considering the surface layer thickness of order of the lattice parameter [26, 27] according to chemical core-shell model [28]. These results indicated that there is a negligible number of Fe-ions distributed on the surface of all the parti-cles. A study of size dependent magnetic properties of man-ganese ferrite fine particles revealed that the surface effects disappear when the particle size is larger than ∼20 nm and our particles are in the same size range [29].
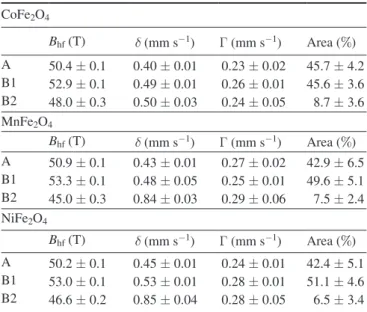
Bhf represents the hyperfine field that is proportional to
the interaction between the Fe nucleus and its surrounding magn etic field, δ represents the isomer shift that is responsible
for interaction occuring between the nucleus and the s-elec-trons (density), and Γ is the FWHM Lorentzian linewidth (0.133 ± 0.003 mm s−1 is the source’s linewidth that is a
measure of the lifetime of the excited state of the nucleus), and the spectral area is directly proportional to the number of Fe atoms in the A and B sites, respectively. The sextet with the smallest isomer shift is assigned to the Fe+3 ions occupying
the tetrahedral sites. Because the number of d-electrons in the Fe+2 ions is larger than Fe+3 ions, the nucleus becomes more
strongly shielded from s-electrons [30], the larger isomer shift is assigned to Fe+2 ions occupying the octahedral sites.
The third sextet with the smallest hyperfine field interpreted as the presence of ∼9% Fe2+ ions for CoFe
2O4, ∼8% Fe2+
ions for MnFe2O4 and ∼7% Fe2+ ions for NiFe2O4
nanopar-ticles occupying on the surface of the nanoparnanopar-ticles [31]. In addition, the Γs of the individual sites reflect the local site disorder, as expected from nanoparticles and in agreement with the local stress and strain, for example, mirrored in the Scherrer-broadened x-ray diffraction pattern reflections.
The distributions of the cations in tetrahedral and octa hedral sites obtained from the Mössbauer fits lead to a chemical form ula of (Co2+0.02Fe3+
1.00) [Co2+0.81Fe3+0.99Fe2+0.19]O−24 for Co-ferrite,
(Mn2+0.26Fe3+0.86) [Mn2+0.80Fe3+1.00Fe2+0.15]O−2
4 for Mn-ferrite and
(Ni2+
0.36Fe3+0.83) [Ni2+0.78Fe3+1.00Fe2+0.13]O−24 for Ni-ferrite
nanoparti-cles. Mössbauer spectroscopy is a direct measure of the Fe ion environments [17] so the numbers of Co, Mn and Ni ions in the systems were estimated from charge balance arguments. Thus, the degree of inversion, x, was determined from the fraction of Co, Mn and Ni ions occupied in octahedral sites corresponded to that ∼98% of Co+2 ions, ∼80% of Mn+2 ions
and ∼80% of Ni+2 ions in octahedral sites. These results
indi-cated that the each of samples has a partially inverted (mixed) structure of a spinel (0 < x < 1) with high degree of inversion. All our values are comparable with previous reports [8, 31,
32].
3.2. Magnetic analysis
In order to study the magnetism of nanoparticles, the same amount of dried nanoparticles and GE varnish (VGE 7031) were mixed to keep the particles stabilized with the similar interparticle spacings. The interparticle spacings, d , were estimated assuming a distribution of spherical particles via
d = D 2 (3χ4πv), where D is the mean nanoparticle diam-eter (estimated from XRD and TEM observations) and χv is the volume fraction of the nanoparticles. The interparticle
Figure 4. Mössbauer spectroscopy of (a) CoFe2O4, (b) MnFe2O4, and (c) NiFe2O4 nanoparticles at 30 K. The black points represent the experimental data and coloured lines through the data are the fits for the respective sites as described in the text.
Table 1. Mössbauer parameters obtained from the fitting: hyperfine field (Bhf), isomer shift (δ), linewidth (Γ), and area ratio of the A and B site components.
CoFe2O4 Bhf (T) δ (mm s−1) Γ (mm s−1) Area (%) A 50.4 ± 0.1 0.40 ± 0.01 0.23 ± 0.02 45.7 ± 4.2 B1 52.9 ± 0.1 0.49 ± 0.01 0.26 ± 0.01 45.6 ± 3.6 B2 48.0 ± 0.3 0.50 ± 0.03 0.24 ± 0.05 8.7 ± 3.6 MnFe2O4 Bhf (T) δ (mm s−1) Γ (mm s−1) Area (%) A 50.9 ± 0.1 0.43 ± 0.01 0.27 ± 0.02 42.9 ± 6.5 B1 53.3 ± 0.1 0.48 ± 0.05 0.25 ± 0.01 49.6 ± 5.1 B2 45.0 ± 0.3 0.84 ± 0.03 0.29 ± 0.06 7.5 ± 2.4 NiFe2O4 Bhf (T) δ (mm s−1) Γ (mm s−1) Area (%) A 50.2 ± 0.1 0.45 ± 0.01 0.24 ± 0.01 42.4 ± 5.1 B1 53.0 ± 0.1 0.53 ± 0.01 0.28 ± 0.01 51.1 ± 4.6 B2 46.6 ± 0.2 0.85 ± 0.04 0.28 ± 0.05 6.5 ± 3.4 51 110 B1 100 90 ,.-., CoFep 4 cf?-~ 110 C 0 "iii 100 r/) E 90 r/) C
g
80 (I) MnFe 20, > ,.;; 110 B1 roa>
ll:'. 100 90 80 NiFep. -10 0 10 Velocity (mm/s)Ç E Demirci et al
5
spacings were d = 20 nm, d = 25 nm, d = 24 nm for CoFe2O4, MnFe2O4 and NiFe2O4 nanoparticles, respectively.
The zero-field cooled (ZFC) and field-cooled (FC) low-field magnetization temperature-dependence (M-T) of the CoFe2O4,
MnFe2O4 and NiFe2O4 nanoparticles were measured with an
applied field of 100 Oe in the temperature range of 10–400 K for each sample, as shown in figures 5(a)–(c). For the ZFC measurements, the samples were first cooled down to 10 K at zero-field and then the magnetization was measured up to 400 K at a field of 100 Oe. In the FC sequence, the data were collected in the cooling cycle using the same magnetic field. In a ZFC-FC M-T scan of nanoparticles undergoing dynamical freezing that experience both inter- and intraparticle effects on the magnetism, three characteristic properties can often be distinguished [33]. The blocking temperature (TB) where the
maximum of the ZFC magnetization, the irreversibility temper-ature (Tirr) where the ZFC magnetization departs from the FC
one due to interparticle interactions and f (V), the particle size distribution from the d(MFC− MZFC)/dT versus T shape.
In a ZFC measurement, MZFC increases at first with warming
and then reaches the maximum value at TB. At T < TB the
par-ticles are called in blocked regime as their magnetic moments
directions are fixed along the applied field. At T > TB, MZFC
begins to decrease with increasing temper ature and the parti-cles are called in superparamagnetic regime in which single-domain moments fluctuate about their easy axis [34]. As can be seen from figures 5(a)–(c), TB>400 K for the CoFe2O4,
MnFe2O4 and NiFe2O4 nanoparticles.
The broadening of the MZFC of NiFe2O4 nanoparticles is
due to the wide particle size distribution and/or interparticle interactions [35]. The presence of clusters in the NiFe2O4
nan-oparticles can couple the magnetizations of the neighbouring particles with increasing correlation lengths and thus increase the TB of these nanoparticles.
A maximum at Tmax in the ZFC magnetization is related
to blocking effects which is not observed in the ZFC mag-netization of CoFe2O4 and MnFe2O4 nanoparticles, indicating
that NiFe2O4 is having a lower average energy barrier than
the CoFe2O4 and MnFe2O4 [8]. As shown in the figure 5(a),
the temperature dependence of the magnetization of CoFe2O4
nanoparticles exhibit a cusp around ∼320 K in the ZFC mag-netization. It can be attributed to the freezing of particles with smaller size which can lead to spin-glass like phase formation [36]. Different from CoFe2O4 nanoparticles, the magnetization
of MnFe2O4 and NiFe2O4 nanoparticles in ZFC with warming
decreases below TB and no saturation is observed even down
to 10 K. It can be attributed to lower anisotropy energy bar-rier of MnFe2O4 and NiFe2O4 compared to CoFe2O4
nanopar-ticles. Below TB, the decreasing characteristic of MZFC with
warming is related to random orientation of magnetization along the easy axes at low temperatures without applied field due to anisotropy [37].
The magnetization in FC with cooling slightly increases as the temperature decreases down to ∼100 K for CoFe2O4
and NiFe2O4 and ∼320 K for MnFe2O4 nanoparticles. At
the temper atures below ∼100 K for CoFe2O4 and NiFe2O4,
∼50 K for MnFe2O4 nanoparticles the magnetization in FC
with cooling exhibits nearly flat characteristic which indicates the existence of interparticle interactions [37]. The observed cusp near ∼310 K in the MFC plot with cooling of MnFe2O4
nanoparticles is indicative of the presence of strong interpar-ticle interactions which is in agreement with Monte Carlo simulations [38]. Similar behaviour has been reported for MnFe2O4 nanoparticles with mean crystallite size of ∼2 nm
and Co particles embedded in Mn matrix with ∼5% volume fraction which have strong dipolar and long-range interpar-ticle interactions, respectively [39]. The collective behaviour of particles through the strong interparticle interactions shows similarities with the spin-glass systems [40], such as the existence of a maximum in MFC plot. Since the interparticle
interaction energy is much larger than the individual particle anisotropy energy in the presence of strong interparticle inter-actions the magnetic properties of a system can be character-ized by a collective blocking of the particle moments [39]. It is clearly seen from the behaviour of MZFC and MFC plot,
the magnetic properties of our particles are more likely due to non-negligible interparticle interactions with formation of some clusters.
To investigate the blocking process in our systems the difference in the (MFC− MZFC) plots are plotted against the Figure 5. Temperature dependence of the ZFC and FC
magnetization of (a) CoFe2O4, (b) MnFe2O4, and (c) NiFe2O4 nanoparticles. The insets show the high temperature regions. J. Phys. D: Appl. Phys. 51 (2018) 025003
11
(a)
...-..,~10
::::,E
Cl)- g
...~12
::::,E
~8
~
40
100 Oe
100
~::, 14~ ,.
~
.•···.
..
...
:
.
.
~ 13 250 300 350 400200
T (K)
(K)300
400
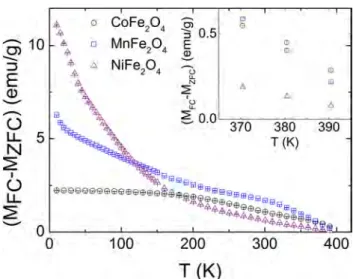
temperature as shown in figure 6. No clear coincidence of
MZFC and MFC was seen below ∼400 K for all samples as
seen from the inset of figure 6. NiFe2O4 nanoparticles have
larger irreversibility (MFC− MZFC) which originates from the
energy barriers of magnetic anisotropy [41], below ∼180 K compared to CoFe2O4 and MnFe2O4 nanoparticles. But at
higher temperatures (above ∼180 K) the higher irreversibility of CoFe2O4 and MnFe2O4 compared to NiFe2O4
nanocles indicated that there are more amount of blocked parti-cles in the samples [42] sign to a higher TB for CoFe2O4 and
MnFe2O4 compared to NiFe2O4 nanoparticles.
The field dependent magnetization of the nanoparticles were measured from 10 to 400 K under ±50 kOe applied fields. Typical hysteresis loops at 10 and 300 K are shown in figures 7(a)–(c). Hysteresis measurements indicated that CoFe2O4 nanoparticles become superparamagnetic with a
blocking >400 K and higher than MnFe2O4 and NiFe2O4 with
a blocking at ∼300 K with zero coercivity and remanance at these temperatures. The presence of small coercivities even at ∼400 K for CoFe2O4 show that the extra energy barrier
arising from the interparticle interaction can inhibit spin flip-ping [43].
Saturation magnetization, Ms(T) and the coercivity (Hc(T))
values of the nanoparticles were determined from the hyster-esis loops by subtracting the diamagnetic contribution due to GE varnish, and known sample masses. Ms(T), shown in
fig-ures 8(a)–(c) reflects the thermal behaviour of the nanoparti-cle’s magnetization that is related to presence of spin waves, described by Bloch-like law [44] that incorporates finite size effects,
M(T) = M(0)[1 − BT2]
(1) where B is a spin-wave constant. Fitting Ms(T) according
to the equation (1) resulted in Ms(0) = 95.18 ± 0.33 emu g−1 and B = (1.46 ± 0.03) × 10−6 K−2 for CoFe
2O4, Ms(0) = 75.91 ± 0.09 emu g−1 and B = (1.33 ± 0.01) × 10−6 K−2 for MnFe 2O4, Ms(0) = 69.93 ± 0.03 emu g−1 and B = (1.27 ± 0.01) × 10−6 K−2 for NiFe 2O4 nanoparticles.
The obtained values of B are comparable with values of fer-rites reported previously [45]. Ms(T) with T2 dependence is an
indication that there is an energy gap in the magnon fluctua-tion spectrum due to the finite-size effects [44]. Ms(T) of the
CoFe2O4 nanoparticles does not track well with equation (1);
Ms(T) ∼88 emu g−1 below ∼200 K. This behaviour may be
explained by the magnetization of some of the bigger particles not rotating along with the magnetic field, causes a decrease in the magnetization at low temperatures. The saturation mag-netization values are found to be Ms(300 K) ∼83 emu g−1 for
CoFe2O4, ∼67 emu g−1 for MnFe2O4 and ∼62 emu g−1 for
NiFe2O4. Considering a typical density of ∼5.3 g cm−3 [46]
in the bulk forms of these ferrites, the Ms(300 K) values of
the CoFe2O4, MnFe2O4 and NiFe2O4 are determined as 439.9,
355.1 and 328.6 emu cm−3, respectively, which are
compa-rable with values reported in [47].
These values represent a ∼20% decrease, and ∼2% and ∼10% increase compared to their bulk values at room temperature, for CoFe2O4, MnFe2O4 and NiFe2O4
respec-tively. Ms is governed by the distribution of cations in their
respective sublattices [8, 48], and in nanoparticle systems, this is especially relevant as the nanoparticle core degree of inver-sion, x, and potential contribution of disordered spin structures from the surface (determined by the surface/volume ratio of the nanoparticles [48–50]) are competing effects.
Figure 6. Temperature dependence of (MFC− MZFC) of CoFe2O4 ( ), MnFe2O4 ( ), and NiFe2O4 ( ) nanoparticles. The inset shows the high temperature region.
Figure 7. Hysteresis loops of (a) CoFe2O4, (b) MnFe2O4, and (c) NiFe2O4 at 10 ( ) and 300 K ( ). 51
"'
0 CoFe2O4 :§ • G ~ :::i 0.5-
10 £ 0 MnFe2O4 E l!l 0) R, !£, [J-
.$. NiFep 4 :J ~"
E
4"-.'
\
N (l)f
-
u-
"-() ~ 0.0 370 380 LL 5"
T (K) N2
I () !ii"'"'Iii
LL S!ii!ii!ii@Eii@9eeweemeit~i"'ewwe"'82
- mi:eeee,iil4>,;,.$..,:lillil!ii91il :i:~t~lmm-
0 iii.$ iii 0 100 200 300T (K)
C l!l "' h 390 400 ----c- 10 K - :- 300 K 50en
25 MnFe2O4-
E
0r-
- - - - ~
~
9 - - - ~
<l> -25 ..._...2
-50 -..r-10 K ->-300 K -75 f-'---'----'---'---+--'----1---L---1-I 75(c)
50en
25 NiFe2O4-
E
0
r - - - - -
~
- - - 1
<l> -25 ..._... -n- 10 K2
-50 - r - 300 K -75 L...J...._..____._ _ _._____i__....,__--1 _ __.___,_J -10 -5 0 5 10H (kOe)
CÇ E Demirci et al
7
To clarify these different effects on Ms, the contribution
from the cation distributions to the magnetism via net magnet-ization per formula unit (nnet) were calculated using the Néel’s
sub-two-lattice model [51] with the relation, nnet=MB− MA, where MB is the net magnetization of octahedral sites, and MA
is the net magnetization of tetrahedral sites in µB [52]. From
the Mössbauer fit results the net magnetization per formula unit is found to be 3.04µB for CoFe2O4, 4.00µB for MnFe2O4
and 2.21µB for NiFe2O4 nanoparticles. Generalizing that the
net magnetization per unit formula of any ferrite with inverse spinel structure is simply the moment on the divalent ion which corresponds to values of magnetization of 3µB, 5µB
and 2µB for CoFe2O4, MnFe2O4 and NiFe2O4 [6], one can
clearly see that the calculated values of magnetization using Mössbauer spectra results are in good agreement with the observed ∼20% decrease, and ∼2% and ∼10% increase of net magnetization compared to bulk for CoFe2O4, MnFe2O4
and NiFe2O4 nanoparticles. We conclude that migration
of ∼2% of Co2+ ions, ∼25% of Mn2+ ions and ∼32% of Ni2+
ions from octahedral sites to tetrahedral sites with the distribu-tion of ∼9%, ∼8% and ∼7% of Fe2+ ions on the surface are
responsible for altered magnetization in CoFe2O4, MnFe2O4
and NiFe2O4 nanoparticles, respectively.
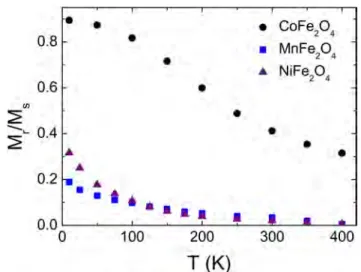
To characterize the magnetic anisotropy that is a measure of distribution of energy barriers in the system the
measurement of squareness (Mr/Ms) determined from the hysteresis measurements, is shown in figure 9. For randomly oriented particles with uniaxial anisotropy Mr/Ms=0.5 is the expected (theoretical) value of the squareness at 0 K when nanoparticles are blocked [42]. The maximum squarenesses were found to be Mr/Ms (10 K) ∼0.9, ∼0.3, and ∼0.2 for the CoFe2O4, MnFe2O4 and NiFe2O4 nanoparticles,
respec-tively. The reduced (compared to 0.5) squarenesses of the MnFe2O4 and NiFe2O4 nanoparticles are in good agreement
with previous studies [53] that indicated in general that the
Mr/Ms of nanoparticulate systems will fall below the
theor-etical value—attributed to the frustration of the surface spins [53], noncoherent rotational magnetization processes, distri-bution of anisotropy fields and interparticle interactions [42].
Mr/Ms>0.5 for the CoFe2O4 nanoparticles compared to
theor etical maximum value (0.83–0.87) [54] of squareness indicates that the system is completely blocked with the ten-dency toward cubic magnetic anisotropy of particles [8, 49]. The cubic anisotropy of CoFe2O4 nanoparticles leads to a
reduced energy barrier (∆E(µ0H) ≈ KV/4) to reversal
com-pared to the uniaxial anisotropy systems (∆E(µ0H) ≈ KV)
[55]. This will alter Hc(T), as discussed below.
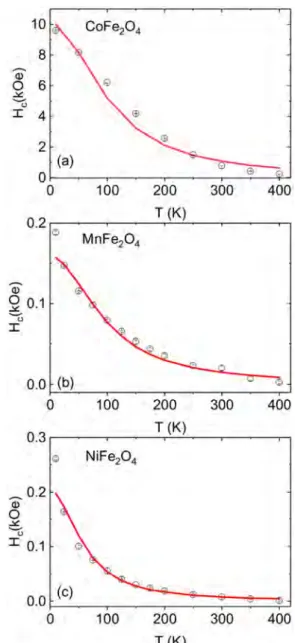
The coercive fields of the CoFe2O4, MnFe2O4 and NiFe2O4
nanoparticles at different temperatures determined from the hysteresis loops, are shown in figures 10(a)–(c). We observed that the coercivity increases with decreasing temperature for all samples. The coercivity versus temperature plots of the nanoparticles can be fitted using the following equation [56] by incorporating the temperature dependence of Ms(T) from
equation (1).
Hc(T) = 2K
Ms(T)[1 − (T/TB)
1/2].
(2) The fitted values of M(0) and B obtained from equation (1) were used to determine the values of K and TB of the
indi-vidual ferrite systems. From the fits, the K and TB values were
found to be ∼(2.96 ± 0.03) × 106 ergs cm−3 and 300 ± 1
K for the CoFe2O4 nanoparticles, ∼(0.07 ± 0.01) × 106
ergs cm−3 and 90 ± 3 K for the NiFe
2O4 nanoparticles, Figure 8. Temperature dependence of saturation magnetization
(Ms) of (a) CoFe2O4, (b) MnFe2O4, and (c) NiFe2O4 nanoparticles. The red lines show the fits using equation (1).
Figure 9. Squareness ratio, Mr/Ms as a function of temperature for the CoFe2O4 ( ), MnFe2O4 ( ), and NiFe2O4 nanoparticles ( ).
J. Phys. D: Appl. Phys. 51 (2018) 025003
90
cri
85 -.. ::, E 80 ~ ti) ~ 75 70 75 -~ ::, 70 E (I) ";;, 65 ~ 60rn
65 -.. ::, E (I) " ; 60 ~ 0 Ms(T) 2 - M5(T)=M5(0){1-BT ) 0 Ms(T) 2 - M5(T)=M5(0)(1-BT ) 0 Ms(T) 2 - Ms(T)=Ms(0)(1-BT ) 100 200 T (K)•
0.8 0.6·"'
~i
'-
0.4•
(b)
I 0.2MnFe
20
4 0.0 0 300 400•
•
CoFe204•
• MnFe204•
•
NiFep4•
•
•
•
•
•
•
•
•
t
••
•••
•
100 200 300 400T
(K)
•
•and ∼(0.04 ± 0.01) × 106 ergs cm−3 and 210 ± 6 K for the
MnFe2O4 nanoparticles. According to the TB values from the
fits of the temperature dependence of coercivity, it is expected that when the temperature is ∼300 K for CoFe2O4, ∼210 K
for MnFe2O4 and ∼90 K for NiFe2O4 nanoparticles, the
energy barrier would be overcome by the thermal energy, and the coercivity will be zero if neglecting the interparticle inter-actions. These estimated values of TB are lower than estimated
from ZFC-FC measurements for all samples. The anisotropy constants determined from the fit of temperature dependence coercivity are found to be comparable with the bulk values [57, 58] for CoFe2O4 and NiFe2O4 nanoparticles, but higher
(almost twice) for MnFe2O4 nanoparticles [59].
The 300 K Hc values for the CoFe2O4, MnFe2O4 and
NiFe2O4 nanoparticles were found to be ∼0.78 kOe, ∼0.02
kOe and ∼0.01 kOe, respectively. The Hc of CoFe2O4
nanoparticles is found to be in the range of bulk coercivity
(∼0.75–0.98 kOe) [60]. The Hc of MnFe2O4 nanoparticles
has been found to be higher, while the NiFe2O4 nanoparticles
has a lower one compared to bulk values [61, 62]. In general, nanoparticles are expected to have a smaller Hc than the bulk
(∼100 nm or smaller are single domain particles) [60]. But the observation of a wide range of coercivity of any material can be related to magnetic anisotropy, defects, strain, nature of the surface, interface, interparticle interactions [60], differ-ence in the composition and grain size of the sample [63]. The obtained values of coercivities are consistent with the value of effective magnetic anisotropies determined from the temperature dependence of coercivity for MnFe2O4 and
NiFe2O4 nanoparticles. One can clearly see from the
descrip-tion of the anisotropy field with cubic symmetry crystals [64] that a decrease and an increase of saturation magnetization compared to bulk counterparts due to cation distributions (as shown before) for MnFe2O4 and NiFe2O4 nanoparticles
lead to an increase and a decrease of coercivities of parti-cles, respectively. We concluded from this that the Hc values
of the MnFe2O4 and NiFe2O4 nanoparticles are solely due to
their effective magnetic anisotropies that reflect their intrinsic magn etic hardness [65].
4. Summary and conclusion
Nanoparticles of CoFe2O4, MnFe2O4 and NiFe2O4 with
com-parable sizes (∼20 nm) and interparticle spacings (∼20 nm) were synthesized using a method modified from the conven-tional organic phase process. The cation distributions of tet-rahedral and octaheral sites of the particles were determined by Mössbauer spectroscopy. We found a high degree of inver-sion of ∼0.98 for CoFe2O4, ∼0.80 for MnFe2O4 and NiFe2O4
nanoparticles. The excellent fits of the Mössbauer spectra with more than two sextets are attributed to the presence of surface spins. We estimated a negligible surface to core spin popu-lation ratio of ∼0.1 for all samples using Mössbauer results. A broadening of the MZFC plot with warming of NiFe2O4
nanoparticles is attributed to wide particle size distribu-tion and/or interparticle interacdistribu-tions in the system. A small cusp around ∼320 K in ZFC magnetization with warming of CoFe2O4 nanoparticles indicated spin-glass like phase
for-mation. The non-negligible interparticle interactions for all samples are clearly reflected in ZFC-FC measurements of the particles. No clear coincidence of MZFC and MFC was seen
below ∼400 K for all samples. Hysteresis measurements indi-cated that CoFe2O4 nanoparticles become
superparamagn-etic with a blocking >400 K and higher than MnFe2O4 and
NiFe2O4 with a blocking at ∼300 K. The magnetization at
room temperature increases by ∼2% for CoFe2O4, ∼10% for
NiFe2O4, but decreases by ∼20% for MnFe2O4 nanoparticles
compared to their bulk counterparts. An increasing behaviour of coercive field with decreasing temperature interpreted as thermal activation of the particle moments are due to aniso-tropy barrier according to equation (2). The effective magn-etic anisotropies of the particles estimated from temper ature dependence of coercivity were found to be comparable to bulk counterparts. The consistency between the effective magnetic
Figure 10. Temperature dependence of the coercivity for (a) CoFe2O4, (b) MnFe2O4, and (c) NiFe2O4 nanoparticles. The red lines show the fit according to equation (2) in the text.
51 10 CoFe204 8 al 0 6 6 " I 4 2 (a) 0 0 100 200 300 400 0.2 T (K) I;, MnFe204 Q)
9
0.1u
I 0.0 (b)...,
0 100 200 300 400 0.3 T (K) Q NiFe204 0.2 (1) 0 .:it:u
I 0.1 0.0 (c) 0 100 200 300 400 T (K)Ç E Demirci et al
9
anisotropy and coercivity of MnFe2O4 and NiFe2O4 indicated
that the coercivity of the particles is due to effective magnetic anisotropy which is the intrinsic hardness of the system. But the inconsistency between the effective magnetic anisotropy and coercivity of CoFe2O4 nanoparticles indicated that the
anisotropy of the system may be governed by extrinsic factors. A comparison between three typical ferrite systems with com-parable sizes and comcom-parable interparticle spacings is useful to understand the effect of distribution of cations in tetrahedral and octahedral sites on the overall magnetism.
Acknowledgments
The authors thank the Scientific and Technological Research Council of Turkey (TUBITAK) and Natural Sciences and Engineering Research Council of Canada (NSERC). This paper has been granted by the Muğla Sıtkı Koçman University Scientific Research Project Coordination through Project Grant Number: (14/066).
ORCID iDs
Ç E Demirci https://orcid.org/0000-0002-3081-0691
References
[1] Tomar M, Singh S, Perales-Perez O, Guzman R, Calderon E and Rinaldi-Ramos C 2005 Microelectron. J. 36 475–9
[2] McMichael R, Shull R, Swartzendruber L, Bennett L and Watson R 1992 J. Magn. Magn. Mater. 111 29–33
[3] Poddar P, Gass J, Rebar D, Srinath S, Srikanth H,
Morrison S and Carpenter E 2006 J. Magn. Magn. Mater. 307 227–31
[4] Yang H, Zhang C, Shi X, Hu H, Du X, Fang Y, Ma Y, Wu H and Yang S 2010 Biomaterials 31 3667–73
[5] Sharifi I, Shokrollahi H and Amiri S 2012 J. Magn. Magn.
Mater.324 903–15
[6] Cullity B D and Graham C D 2011 Introduction to Magnetic
Materials (New York: Wiley)
[7] Sickafus K E, Wills J M and Grimes N W 1999 J. Am. Ceram.
Soc.82 3279–92
[8] Carta D, Casula M F, Falqui A, Loche D, Mountjoy G, Sangregorio C and Corrias A 2009 J. Phys. Chem. C 113 8606–15
[9] Gyergyek S, Makovec D, Kodre A, Arčon I, Jagodič M and Drofenik M 2010 J. Nanoparticle Res. 12 1263–73
[10] Nlebedim I, Melikhov Y and Jiles D C 2014 J. Appl. Phys. 115 043903
[11] Ranvah N, Nlebedim I, Melikhov Y, Snyder J, Williams P, Moses A and Jiles D 2009 IEEE Trans. Magn. 45 4261–4
[12] Jovic N G, Masadeh A S, Kremenovic A S, Antic B V, Blanusa J L, Cvjeticanin N D, Goya G F, Antisari M V and Bozin E S 2009 J. Phys. Chem. C 113 20559–67
[13] Rath C, Anand S, Das R, Sahu K, Kulkarni S, Date S and Mishra N 2002 J. Appl. Phys. 91 2211–5
[14] Wang J, Wu Y and Zhu Y 2007 Int. J. Mod. Phys. B 21 723–9
[15] Vaingankar A, Khasbardar B and Patil R 1980 J. Phys. F: Met.
Phys.10 1615
[16] Chen J, Sorensen C, Klabunde K, Hadjipanayis G, Devlin E and Kostikas A 1996 Phys. Rev. B 54 9288
[17] Sawatzky G, Van Der Woude F and Morrish A 1969 Phys. Rev. 187 747
[18] Willard M A, Nakamura Y, Laughlin D E and McHenry M E 1999 J. Am. Ceram. Soc. 82 3342–6
[19] Sun S, Zeng H, Robinson D B, Raoux S, Rice P M, Wang S X and Li G 2004 J. Am. Chem. Soc. 126 273–9
[20] Rodríguez-Carvajal J 1993 Physica B 192 55–69
[21] Schneider C A, Rasband W S and Eliceiri K W 2012 Nat.
Methods9 671–5
[22] Lim J, Yeap S P, Che H X and Low S C 2013 Nanoscale Res.
Lett.8 381
[23] Persoons R, De Grave E, De Bakker P and Vandenberghe R 1993 Phys. Rev. B 47 5894
[24] Grigorova M, Blythe H, Blaskov V, Rusanov V, Petkov V, Masheva V, Nihtianova D, Martinez L M, Munoz J and Mikhov M 1998 J. Magn. Magn. Mater. 183 163–72
[25] Šepelák V, Baabe D, Mienert D, Schultze D, Krumeich F, Litterst F and Becker K 2003 J. Magn. Magn. Mater. 257 377–86
[26] Gomes J, Azevedo G, Depeyrot J, Mestnik-Filho J, Paula F, Tourinho F and Perzynski R 2012 J. Phys. Chem. C 116 24281–91
[27] Ferreira L, Cruz M, Oliveira M, Mendo S, Alves A, Godinho M and Carvalho M 2016 RSC Adv. 6 73506–16
[28] Gomes J D A, Sousa M H, Tourinho F A, Aquino R, da Silva G J, Depeyrot J, Dubois E and Perzynski R 2008 J.
Phys. Chem. C 112 6220–7
[29] Tang Z, Sorensen C, Klabunde K and Hadjipanayis G 1991
J. Appl. Phys.69 5279–81
[30] Walker L, Wertheim G K and Jaccarino V 1961 Phys. Rev.
Lett.6 98
[31] Chinnasamy C, Narayanasamy A, Ponpandian N, Chattopadhyay K, Shinoda K, Jeyadevan B, Tohji K, Nakatsuka K, Furubayashi T and Nakatani I 2001 Phys.
Rev. B 63 184108
[32] Atif M, Nadeem M and Siddique M 2015 Appl. Phys. A 120 571–8
[33] Knobel M, Nunes W, Socolovsky L, De Biasi E, Vargas J and Denardin J C 2008 J. Nanosci. Nanotechnol. 8 2836–57
[34] Van Lierop J and Ryan D 2000 Phys. Rev. Lett. 85 3021
[35] Mitra S, Mandal K and Kumar P A 2006 J. Magn. Magn.
Mater.306 254–9
[36] Singh M K, Prellier W, Singh M, Katiyar R S and Scott J 2008
Phys. Rev. B 77 144403
[37] Sharma S, Kumar R, Kumar S, Knobel M, Meneses C, Kumar V S, Reddy V, Singh M and Lee C 2008 J. Phys.:
Condens. Matter20 235214
[38] Chantrell R, Coverdale G, El Hilo M and O’Grady K 1996
J. Magn. Magn. Mater.157 250–5
[39] Fiorani D and Peddis D 2014 J. Phys.: Conf. Ser. 521 012006
[40] Peddis D, Cannas C, Musinu A and Piccaluga G 2008 J. Phys.
Chem. C 112 5141–7
[41] Hyeon T, Chung Y, Park J, Lee S S, Kim Y W and Park B H 2002 J. Phys. Chem. B 106 6831–3
[42] Batlle X, Garcia del Muro M, Tejada J, Pfeiffer H, Görnert P and Sinn E 1993 J. Appl. Phys. 74 3333–40
[43] Zhang Y, Liu Y, Fei C, Yang Z, Lu Z, Xiong R, Yin D and Shi J 2010 J. Appl. Phys. 108 084312
[44] Hendriksen P V, Linderoth S and Lindgård P A 1993 Phys.
Rev. B 48 7259
[45] Chandekar K V and Kant K M 2017 Adv. Mater. Lett. 8 435–43
[46] Thang P D, Rijnders G and Blank D H 2005 J. Magn. Magn.
Mater.295 251–6
[47] Blaskov V, Petkov V, Rusanov V, Martinez L M, Martinez B, Munoz J and Mikhov M 1996 J. Magn. Magn. Mater. 162 331–7
[48] Virumbrales-del Olmo M, Delgado-Cabello A, Andrada-Chacón A, Sánchez-Benítez J, Urones-Garrote E, Blanco-Gutiérrez V, Torralvo M and Sáez-Puche R 2017 Phys.
Chem. Chem. Phys.19 8363–72
[49] Peddis D, Orrù F, Ardu A, Cannas C, Musinu A and Piccaluga G 2012 Chem. Mater. 24 1062–71
[50] Peddis D, Mansilla M V, Mørup S, Cannas C, Musinu A, Piccaluga G, D’Orazio F, Lucari F and Fiorani D 2008 J.
Phys. Chem. B 112 8507–13
[51] Neel L 1948 Ann. Phys 3 137–98
[52] Lohar K, Pachpinde A, Langade M, Kadam R and Shirsath S E 2014 J. Alloys Compd. 604 204–10
[53] Vestal C R, Song Q and Zhang Z J 2004 J. Phys. Chem. B 108 18222–7
[54] Soares J, Galdino V and Machado F 2014 J. Magn. Magn.
Mater.350 69–72
[55] Virden A, Wells S and O’Grady K 2007 J. Magn. Magn.
Mater.316 e768–71
[56] Shendruk T, Desautels R, Southern B and Van Lierop J 2007
Nanotechnology18 455704
[57] Carvalho M, Lima R, Meneses C, Folly W, Sarmento V, Coelho A and Duque J 2016 J. Appl. Phys. 119 093909
[58] Du Y, Xu M, Wu J, Shi Y, Lu H and Xue R 1991 J. Appl. Phys. 70 5903–5
[59] Yoon S and Krishnan K M 2011 J. Appl. Phys. 109 07B534
[60] Limaye M V, Singh S B, Date S K, Kothari D, Reddy V R, Gupta A, Sathe V, Choudhary R J and Kulkarni S K 2009 J.
Phys. Chem. B 113 9070–6
[61] Aslibeiki B, Kameli P and Ehsani M 2016 Ceram. Int. 42 12789–95
[62] Shan A, Wu X, Lu J, Chen C and Wang R 2015
CrystEngComm17 1603–8
[63] Chinnasamy C, Jeyadevan B, Shinoda K, Tohji K, Djayaprawira D, Takahashi M, Joseyphus R J and Narayanasamy A 2003 Appl. Phys. Lett. 83 2862–4
[64] Gubin S P, Koksharov Y A, Khomutov G and Yurkov G Y 2005 Russ. Chem. Rev. 74 489–520
[65] Blanco-Gutiérrez V, Gallastegui J, Bonville P, Torralvo-Fernández M J and Sáez-Puche R 2012 J. Phys. Chem. C 116 24331–9