ÇANKAYA UNIVERSITY
GRADUATE SCHOOL OF SOCIAL SCIENCES
DEPARTMENT OF INTERNATIONAL TRADE AND FINANCE
MASTER THESIS
ENERGY ECONOMICS, RENEWABLE ENERGY & ITS SIGNIFICANCE FOR THE TURKISH REPUBLIC AND ITS ECONOMIC DEVELOPMENT
GURURCAN TALINLI
iv ABSTRACT
ENERGY ECONOMICS, RENEWABLE ENERGY & ITS SIGNIFICANCE FOR THE TURKISH REPUBLIC AND ITS ECONOMIC DEVELOPMENT
TALINLI, Gururcan Master Thesis
Graduate School of Social Science
M.A., International Trade and Finance
Supervisor: Asst. Prof. Dr. Aytaç GÖKMEN
April 2018,
Energy is the most important need that is used in every sector. For instance, people need energy for heating, industry and technological developments. Turkey is a country, whose industry, economy and population is rapidly growing day by day. Thus, energy demand of Turkey is perpetually increasing. Turkey is an abundant country in terms of renewable energy and subterranean resources. In our day, Turkey satisfies most of its energy needs from oil, coal, natural gas and electricity. However, these energy resources cannot renew themselves and spontaneously get depleted after a certain amount of time. Furthermore, using these types of energy has negative effects on environment and the ozone layer. For this reason, United Nations imposed some sanctions on the countries in order to reduce greenhouse gas emissions. United Nations Framework Convention on Climate Change and Kyoto Protocol cover these sanctions on greenhouse gas emissions issue.
v
In addition to these, Turkey produces energy from renewable energy resources as well. These energy resources are green energy and therefore they have no negative effects on the environment. Moreover, renewable energy resources are types of energy, which are clean, highly productive, without fuel expenses and with short amortization. Renewable energy resources in Turkey are hydropower, solar, geothermal, wind, biomass and wave. However, the amount of energy produced from this energy resources do not satisfy Turkey's needs. Although, Turkey is a very abundant country in terms of renewable energy resources, it is a country, which imports a large part of its energy needs. Import of energy, creates another burden on current deficit, which is an important problem of Turkey. Therefore, the Ministry of Energy and Natural Resources of Republic of Turkey should make important investments on renewable energy resources to scale down energy dependency on foreign resources. The purpose of writing this thesis is to indicate the energy potential of world, especially Turkey, and emphasizing the importance of renewable energy resources for energy and economic balances.
Keywords: Energy, Renewable Energy Resources, Turkey, Energy Import, Current
vi ÖZET
ENERJİ EKONOMİSİ, YENİLENEBİLİR ENERJİ VE TÜRKİYE CUMHURİYETİ İÇİN ÖNEMİ VE EKONOMİK GELİŞİMİ
TALINLI, Gururcan Yüksek Lisans Tezi
Sosyal Bilimler Enstitüsü M.A. Uluslararası Ticaret ve Finansman
Danışman: Yrd. Doç. Dr. Aytaç GÖKMEN
Nisan 2018,
Enerji her sektörde kullanılan en önemli ihtiyaçtır. Örneğin, insanlar ısınma, sanayi ve teknolojik gelişmeler için enerjiye ihtiyaç duyar. Türkiye sanayisi, ekonomisi ve nüfusu günbegün hızlı bir şekilde büyüyen bir ülkedir. Böylece, Türkiye’nin enerji talebi sürekli olarak artmaktadır. Türkiye yenilenebilir enerji ve yeraltı kaynakları bakımından zengin bir ülkedir. Günümüzde, Türkiye enerji ihtiyacının büyük kısmını petrol, kömür, doğalgaz ve elektrikten karşılar. Ancak, bu enerji kaynakları kendini yenileyemez ve belli bir süre sonra tükenirler. Ayrıca, bu enerji türlerinin kullanımının çevre ve ozon tabakası üzerinde olumsuz etkileri vardır. Bu nedenle, Birleşmiş Milletler sera gazı emisyonlarını azaltmak için ülkelere bazı yaptırımlar uyguladı. Birleşmiş Milletler İklim Değişikliği Çerçeve Sözleşmesi ve Kyoto Protokolü sera gazı emisyonu meselesiyle ilgili bu yaptırımları içermektedir.
Bunlarla birlikte, Türkiye yenilenebilir enerji kaynaklarından da enerji üretmektedir. Bu enerji kaynakları yeşil enerjidir ve bu sebeple, çevre üzerinde negatif etkileri yoktur. Bundan başka, yenilenebilir enerji kaynakları temiz, yüksek derecede
vii
verimli, yakıt gideri içermeyen ve kendini kısa sürede amorti eden enerji türleridir. Türkiye’deki yenilenebilir enerji kaynakları hidrogüç, güneş, jeotermal, rüzgar, biyokütle ve dalgadır. Ancak, bu enerji kaynaklarından üretilen enerji miktarı, Türkiye’nin ihtiyacını karşılamamaktadır. Türkiye yenilenebilir enerji kaynakları bakımından çok zengin bir ülke olmasına karşın, enerji ihtiyacının büyük bir kısmını ithal eden bir ülkedir. Enerji ithalatı Türkiye’nin önemli bir problemi olan cari açığa da büyük yük oluşturmaktadır. Bu yüzden, Türkiye Enerji ve Tabii Kaynaklar Bakanlığı dış kaynaklar üzerindeki enerji bağımlılığını düşürmek için yenilenebilir enerji kaynakları üzerine önemli yatırımlar gerçekleştirmelidir. Bu tezin yazılış amacı, başta Türkiye’nin olmak üzere dünyanın enerji potansiyelini göstermek ve yenilenebilir enerji kaynaklarının enerji ile ekonomik dengeler için önemini vurgulamaktır.
Anahtar Kelimeler: Enerji, Yenilenebilir Enerji Kaynakları, Türkiye, Enerji İthalatı,
viii
ACKNOWLEDGEMENTS
This thesis would have not finished without the assistance of my advisor Yrd. Doç. Dr. Aytaç GÖKMEN. I would like to acknowledge my advisor for valuable contributions, sincerity and insightful guidance. I also would like to thank deeply Prof. Dr. Nildağ Başak CEYLAN, Yrd. Doç. Dr. Ömer YURTSEVEN, Doç. Dr. Ece Ceylan AKDOĞAN, Doç. Dr. Dilek Temiz DİNÇ and all academic units of Çankaya University for their valuable contributions during the all stages of my master program.
Otherwise I am indebted to my country which provides these types of beauty, options and opportunity.
Once more I am thankful to all my friends and fellow student Mehmet Doğa Güvendi who supported me. I also would like to thank Çağlar Akdemir.
Finally, but the most important one, I am grateful to my father, mother and sister for their moral and material support.
ix TABLE OF CONTENTS STATEMENT OF NON-PLAGIARISM...iii ABSTRACT...iv ÖZET…... vi ACKNOWLEDGMENTS……...………....…. viii TABLE OF CONTENTS...ix LISTS OF TABLES...xii LISTS OF FIGURES...xiv ABBREVIATIONS...xvi CHAPTERS INTRODUCTION………..1
1. THE IMPORTANCE OF ENERGY CONSUMPTION, ENERGY POLICY ISSUES & TYPES OF ENERGY RESOURCES………2
1.1. The Concept of Energy………..2
1.2. An Overview of the Renewable Energy Resources & Its Significance …………3
1.3. Types of Energy Resources………4
1.3.1. Primary Energy Resources………..5
1.3.1.1. Nonrenewable Energy Resources………. ………...5
1.3.1.2. Renewable Energy Resources………..5
1.3.2. Secondary Energy Resources………..6
1.4. Types of Nonrenewable Energy Resources………7
1.4.1. Coal……….7
1.4.2. Natural Gas………10
1.4.3. Oil………..15
x
1.4.4.1. Nuclear Energy in Turkey………19
1.5. Renewable Energy Resources Profile on Worldwide………20
1.5.1. The Profile on Hydropower Energy………20
1.5.2. The Profile on Wind Energy………22
1.5.3. The Profile on Geothermal Energy………..24
1.5.4. The Profile on Biomass Energy………...28
1.5.5. The Profile on Solar Energy………29
1.5.6. The Profile on Wave Energy………...31
2. THE KYOTO PROTOCOL, ITS SIGNIFICANCE AND IT CORRELATION TO ENVIRONMENTAL ISSUES……….33
2.1. The United Nations Climate Change Framework Convention on Climate Change………...33
2.2. The Kyoto Protocol……….33
2.2.1. Flexibility Mechanisms………....38
2.2.1.1. Clean Development Mechanism (CDM)………...39
2.2.1.2. Joint Implementation Mechanism (JIM)………...39
2.2.1.3. Emission Trading Mechanism (ETM)………..40
2.2.2. Turkey Being a Party to Kyoto Protocol………..40
2.2.2.1. Advantages of Being a Party to Kyoto Protocol for Turkey……….41
2.2.2.2. Disadvantages of Being a Party to the Kyoto Protocol for Turkey ………..42
2.3. Climate Change and Environmental impacts………..42
3. ENERGY ECONOMICS, ECONOMIC DEVELOPMENT ENERGY ISSUES ON TURKEY………46
3.1. Energy Economics & Economic Development………...46
3.2. Energy Consumption and Economic Growth………..47
3.3. Energy Trade, Current Account Balance Issues & Turkey………...51
3.4. Energy Consumption & Energy Profile in the Republic of Turkey………55
3.4.1. Renewable Energy Resources Profile of Turkey……….57
3.4.1.1. Hydropower Energy Profile of Turkey……….57
3.4.1.2. Wind Energy Profile of Turkey………...59
3.4.1.2.1. In Meteorological Terms, Wind Can Develop in the Following Locations ………61
xi
3.4.1.2.2. The Advantages of Wind Energy………61
3.4.1.2.3. Classification of the Electricity Energy Generated from Wind ………….61
3.4.1.2.4. Çanakkale Wind Resource Information………..62
3.4.1.2.5. İzmir Wind Resource Information………..65
3.4.1.2.6. Balıkesir Wind Resource Information……….68
3.4.1.3. Geothermal Energy Profile of Turkey………71
3.4.1.4. Biomass Energy Profile of Turkey……….74
3.4.1.5. Solar Energy Profile of Turkey………...77
3.4.1.5.1. Solar heat collectors are divided into three categories owing to temperature degrees and areas to be able to be applied………79
3.4.1.5.1.1. Flat Collectors………..79
3.4.1.5.1.2. Focus Collectors………...79
3.4.1.5.1.3. Grand Solar Furnaces………...79
3.4.1.6. Wave Energy Profile of Turkey……….81
CONCLUSION……….84
REFERENCES………..88
xii
LIST OF TABLES
Table 1: Classification of Energy Resources………4
Table 2: Economic Advantages and Disadvantages of Renewable Energy Resources………..6
Table 3: General Coal of International Classification……….7
Table 4: Lignite Reserve Amounts Which Were Identified Between 2005-2015 in Turkey………...8
Table 5: The Natural Gas Consumptions by Sectors in Turkey (Million Sm³)…..11
Table 6: 2007-2016 years Natural Gas Generation Quantities of Turkey (Million Sm³)……….12
Table 7: Natural Gas Import Amount of Turkey (Million Sm³)……….12
Table 8: Available Uranium Reserves………18
Table 9: Decline of Investment Costs in Response to Installed Power Rise in Geothermal Energy in Forthcoming Years Worldwide………...25
Table 10: Potential of Wave Energy According to Region……….31
Table 11: List of Annex-I of UNFCCC………...33
Table 12: List of Annex-II of UNFCCC……….34
Table 13: Annex-B List of Kyoto Protocol……….35
Table 14: Comparison Between UNFCCC and Kyoto Protocol………36
Table 15: Energy Consumption Quantities, Economic Growth Rates and Gross Domestic Product of Countries in 2017………...50
Table 16: Energy Import and Export Values of Turkey between 2000-2015 (thousand $)………..52
Table 17: Energy Import and Current Deficit (Billion $ and %)………...53
Table 18: Population, Economy and Energy………...54
Table 19: Distribution of Net Electricity Consumption by Sectors in Turkey……55
Table 20: Past, Present and Future Total Final Energy Production in Turkey (Mtoe)………56
xiii
Table 21: Past, Present and Future Total Final Energy Consumption in Turkey
(Mtoe)………56
Table 22: The Power Capacity of the Wind Energy Power Plant to be Installed on
Çanakkale………..64
Table 23: The Power Capacity of the Wind Energy Power Plant to be Installed on
İzmir………..67
Table 24: The Power Capacity of the Wind Energy Power Plant to be Installed on
Balıkesir………71
Table 25: Usage Zones of Geothermal Energy in Accordance with the
Temperature………..73
Table 26: Places that are Warmed by Geothermal Energy in Turkey…………..73 Table 27: Biomass Resources………..75 Table 28: Regional Average Wave Density in Turkey………83
xiv
LIST OF FIGURES
Figure 1: Coal Recoverable Reserves by Country in 2016 (Gigaton)………..9
Figure 2: Top 10 Countries Producing Coal in 2016 (Mtoe)………..10
Figure 3: Gas Recoverable Reserves by Region in 2016………13
Figure 4: Top 10 Countries Producing Natural Gas in 2016 (Mtoe)……….14
Figure 5: View of Oil Refinery………..14
Figure 6: Recoverable Oil Reserves by Region in 2016 (Billion tons of oil equivalent).………..15
Figure 7: Top Oil Producing Countries 2016 (Mtoe)………16
Figure 8: Nuclear Power Plant………17
Figure 9: The Share of the Nuclear Electricity Production within the Total Electricity Production………...19
Figure 10: Top Countries Producing Hydropower in 2016 (Mtoe)………21
Figure 11: Top Hydropower Installed Capacity by Country 2016 (GigaWatt)……..22
Figure 12: Top Countries Producing Wind in 2016 (Mtoe)………23
Figure 13: Top 10 Countries Which Installed Wind Capacity in 2016 (Gw)……….24
Figure 14: Top 10 Countries Producing Geothermal Energy (Mtoe)………26
Figure 15: Top Geothermal Installed Capacity by Country (Gw)……….27
Figure 16: Solar Installed Capacity by Region in 2016 (Mtoe)……….29
Figure 17: Top Solar Installed Capacity by country in 2016 (Gw)………30
Figure 18: Greenhouse Gas Emissions (CO2 Equivalent) 1990-2013………...43
xv
Figure 20: View of Hydropower Plant………58
Figure 21: Hydropower Plants of Turkey………..59
Figure 22: Wind Energy Power………..60
Figure 23: Wind Speed Distribution - 50 Meters in Çanakkale……….62
Figure 24: Wind Capacity Factor Distribution - 50 Meters in Çanakkale…………..63
Figure 25: The Wind Power Installation Fields in Çanakkale………64
Figure 26: Wind Speed Distribution - 50 Meters in İzmir……….65
Figure 27: Wind Capacity Factor Distribution - 50 Meters in İzmir……….66
Figure 28: The Wind Power Installation Fields in İzmir………67
Figure 29: Wind Speed Distribution - 50 Meters in Balıkesir………...68
Figure 30: Wind Capacity Factor Distribution - 50 Meters in Balıkesir………69
Figure 31: The Wind Power Installation Fields in Balıkesir………..70
Figure 32: Geothermal Resources………..71
Figure 33: The Fields of Geothermal in Turkey……….72
Figure 34: Biomass Conversion Technologies………..76
Figure 35: Different Types of Solar Energy Heat and Electric Systems………78
Figure 36: Total Solar Radiation According to City………..79
Figure 37: Sunshine Duration of Turkey (Hour)………80
Figure 38: Global Radiation Value of Turkey (KWh/ m²-day)………..81
Figure 39: Wave Energy System………82
xvi
LIST OF ABBREVIATIONS
°C Centigrade
BTOE Billion Tons of Oil Equivalent
CDM Clean Development Mechanism
CER Certified Emission Reductions
CH4 Methane
CO2 Carbon Dioxide
CSP Concentrated Solar Power
EP European Parliament
EPDK T.C. Enerji Piyasası Düzenleme Kurumu (Republic of Turkey, Energy Market Regulatory Agency)
ETKB Türkiye Cumhuriyeti Enerji ve Tabi Kaynaklar Bakanlığı (the Ministry of Energy and Natural Resources of Republic of Turkey)
ETM Emission Trading Mechanism
EU European Union
FMOLS Fully Modified Ordinary Least Squares
GDP Gross Domestic Product
GHG Greenhouse Gas
GNP Gross National Product
GT GigaTon
GW GigaWatt
GWh GigaWatt hour
H2O Water Vapor
HPP Hydropower Power Plants
JIM Joint Implementation Mechanism
Km Kilometer
Km² Square Kilometer
KP Kyoto Protocol
xvii
kWh/m KiloWatt hour/ meter
kWh/m² KiloWatt hour/ Square meter
M/h Meter/ hour
M³ Cubic Meter
MM Millimeter
MTA Maden Tetkik ve Arama Genel Müdürlüğü (General Directorate of Mineral Research and Exploration)
MTE Million Tons of Equivalent Petrol MTOE Million Tons of Oil Equivalent
MW MegaWatt
N2O Dinitrogen monoxide
O3 Ozone
OECD The Organisation for Economic Co-operation and Development
PV Photovoltaics
RES Renewable Energ Source
Sm³ Natural Gas Measurement Unit
TWh Tera Watt hours
TWh/yr Tera Watt hours/year
TY Toda - Yamamoto
UNFCCC United Nations Framework Convention on Climate Change
US United States
USA United States of America USD United States Dollars
VECM Vector Error Correction Model W/m² Watt/ Square meter
1 INTRODUCTION
Fossil fuels have retained a significant part of the energy production so far. However, it has been changing nowadays. Renewable energy resources are deemed to replace the fossil fuels. The definition and the significance of the renewable energy resources is to be pointed out in a detailed way in this study. Renewable energy resources can easily be produced and renewed. The renewable energy resources can never be depleted. People need more energy resources day by day and expendable energy resources (fossil fuels) have negative effect on environment. However, the renewable energy resources don’t have negative effects on the environment. It safeguards the environment against the damage of expendable (fossil fuels) energy. The renewable energy will continue forever worldwide.
Turkey is an abundant country due to its renewable energy resources although Turkey imports 72% of the energy needs from abroad. Therefore, the Ministry of Energy and Natural Resources of Turkey should invest on renewable energy resources. Types of renewable energy resources are wind, solar, hydropower(water), geothermal, biomass and wave in Turkey. Nowadays, renewable energy is crucial for the growth benefits of Turkey. For this reason, if Turkey produces more renewable energy, it totally influences the welfare and economic development of itself in a positive way. Additionally, if Turkey boosts the investment activities on renewable energy resources, the dependence of energy to abroad will decline.1
1 Yılmaz, M., (2012). ‘'The Energy Potential of Turkey and Its Importance of Renewable Energy Sources in terms of Electricity Production’’. Ankara University, Journal of Environmental Sciences 4(2), :33-51.
2
CHAPTER ONE
1. THE IMPORTANCE OF ENERGY CONSUMPTION, ENERGY POLICY ISSUES & TYPES OF ENERGY RESOURCES
1.1.The Concept of Energy
Energy is a word which originates from Greek origin, meaning that it is an internal-work. Energy having a social feature as well is used in skill of creating business, power and dynamism.2 Energy is always one of the most leading and indispensable needs of people. Nowadays, the energy consumption is used per capita as a criterion of the development. In the 21th century, the energy demand of people has increased along with the technology, which evolved in the past due to the influence of the population. Also, the population keeps rising rapidly in the world. Due to these factors, the needs and wants will also increase. One of the biggest problems of the world is the inadequacy of the energy and not being able to provide the continuity.3 Energy, which is defined by the capability of doing a job, is one of the fundamental inputs of the economy. It is possible with possessing cheap, sufficient, quality and reliable energy resources for the healthy development.4
Energy, which is the indispensable component of humanity, has become one of the most influential elements of economic progress in the second half of the 20th century. Energy has been the strategic living resource for each country. Especially, it has one of the fundamental items of the development of the foreign countries. That’s why, countries are continuously in search of new energy resources. In the forthcoming
2Aksöz, H., (2014). ‘’Analysis of the Relationship Between Energy Import and Current Account Deficit in Turkey’’. Unpublished Master’s Thesis. İstanbul University, Institute of Social Sciences, Department of Economics Department of Economic Policy, İstanbul: 4.
3Arı, V., (2007). ‘’Energy Sources, Energy Planning and Energy Strategies’’. Unpublished Master’s Thesis. Çukurova University, Institute of Science Department of Mining Engineering, Adana: 24. 4Coşkun, A., (1982). Energy Saving Panel. Istanbul Chamber of Commerce Publication, January 14, Seminar Series. No: 11,:95.
3
centuries, the energy will be prevailing in the economic and social advancements of the foreign countries.5
1.2. An Overview of the Renewable Energy Resources & Its Significance
There are many features that distinguish renewable energy resources from non-renewable energy resources. It can easily be produced and renewed. Besides, it diffuses fewer pollutants to the nature. For this reason, renewable energy resources are fundamentally different from fossil fuels. The renewable energy resources are utilized in many countries, including Turkey.6
The need for energy resources in the world continues to increase each passing day. The reason of this issue is that the rise of the population, industrial progresses and technological developments keep getting prevalent day by day. Owing to these reasons, the needs and wants of humans will raise. Fossil fuels have retained a significant part of the energy production. However, fossil energy resources cause serious environmental problems in the world and fossil reserves will be consumed in the near future. Moreover, fossil fuel prices are constantly increasing.7 However, it has been changing nowadays. Countries embark on the new energy resources. Particularly, the industrialization movement that started towards the end of the 18th century became a turning point for renewable energy resources. Especially, developed countries using renewable energy sources for electricity production and other things. Currently, the renewable energy is the rival of the fossil fuel.8 However, fossil energy resources are more dominant than renewable energy resources. It is predicted that the fossil energy resources have a future of less than half a century.9
There are two important reasons why countries invest in renewable energy resources. First reason is to increase energy diversity by using natural resources. The second is to provide sustainable energy production. However, there is a need for
5Prugh et al., (2005). ‘’Changing the Oil Economy, 2005 Situation of the World, Tema Publications, İstanbul: 125.
6Temiz, D. & Gökmen, A., (2010). ‘’The Importance of Renewable Energy Sources in Turkey’’. International Journal of Economics and Finance Studies, Vol 2, No:2. p.24.
7Yılmaz, 2012: 34.
8Erdoğan, M., (2014). ‘’ Turkey's Renewable Energy Potential is Examined with Thermodynamic Analysis Method, the Use of Renewable Energy Evaluate of Future Projections’’. Unpublished Master’s Thesis. İstanbul Aydın University, Institute of Science, Department of Mechanical Engineering, Makine Mühendisliği Bilim Dalı, İstanbul: 12.
9Gökmen, A. & Temiz, D., (2015) The Importance and Impact of Fossil and Renewable Energy Sources in Turkey on Business and the Economy, Energy Sources, Part B: Economics, Planning and Policy, 10:1, 15.
4
advanced technology to take advantage of renewable energy resources. In particular, technology that will deliver and distribute the generated energy are very important for countries.10
Turkey isn’t an abundant country in terms of fossil fuels and it imports 71.8% of energy needs from the abroad. If Turkey doesn’t develop additional investment possibilities on renewable energy resources, the energy dependency to abroad will increase. This dependency can lead to considerable problems in terms of Turkey's supply security and economy.11
1.3. Types of Energy Resources
There are various types of energy resources in the world. These energy resources are used for technological developments, industry and heating. Energy resources are divided into two categories as primary and secondary. Types of energy resources have been indicated in the table12
Table 1: Classification of Energy Resources
TYPES OF ENERGY RESOURCES
1) Primary Energy Resources 2) Secondary Energy Resources 1.1) Nonrenewable Energy Resources 2.1) Electricity Energy
1.1.1) Fossil Fuel 2.2) Hydrogen Energy
1.1.1.1) Coal 1.1.1.2) Natural Gas 1.1.1.3) Petrol 1.1.2) Nuclear
1.2) Renewable Energy Resources 1.2.1) Solar 1.2.2) Wind 1.2.3) Hydropower 1.2.4) Geothermal 1.2.5) Biomass Source: Erdoğan, 2014
10Demir, R., (2015). ‘’Turkey’s Energy Import and Current Account Deficit’’. Unpublished Master’s Thesis. TOBB Ekonomi ve Teknoloji University, Institute of Social Sciences, Department of Management. Ankara: 16.
11Yılmaz, 2012: 51. 12Erdoğan, 2014: 42.
5 1.3.1. Primary Energy Resources
The definition of primary energy resources are the components, which provide energy from natural resources. The primary energy resources are divided into two, as nonrenewable and renewable.13
1.3.1.1 Nonrenewable Energy Resources
Nonrenewable energy resources are coal, natural gas, petrol and nuclear energy. Main source for generating nuclear energy is uranium and thorium. These energy resources are limited in the world. Hence, these are called as nonrenewable energy resources.14 Non-renewable energy resources have some advantages, which are providing energy in a short period of time, being cheap and high efficient, having also some disadvantages. These disadvantages are having limited reserves, creating dependency on import, revealing risks due to price variability, affecting human health and environment negatively.15
1.3.1.2 Renewable Energy Resources
Renewable energy is described as the energy generated by natural resources that are renewed within a few years.16 The renewable energy resources are basically comprised of massive radiation caused by solar energy.17 Furthermore, renewable energy resources can easily be produced and renewed. Also, it spreads fewer pollutants to the nature. Besides, the renewable energy resources can never be depleted worldwide. Therefore, these types of energy resources are called as renewable energy resources.18 Renewable energy sources (RES) meet 14 percent of the world's energy demand. The renewable energy resources are solar, wind, hydropower, geothermal, biomass and wave.19 However, renewable energy resources have some disadvantages. The infrastructure costs of renewable energy resources are high and their efficiency is low according to non-renewable energy resources. In other words, renewable energy
13Erdoğan, 2014: 42-43.
14Arı, 2007: 27. 15Aksöz, 2014: 8.
16Lund, H., (2010). ‘’Renewable Energy Systems: The Choice and Modeling of 100% Renewable Solutions.’’ Amsterdam: Elsevier/AP: 7.
17Boyle, G., (2004). ‘’Renewable Energy: Power for a Sustainable Future’’. United Kingdom: Oxford University Press: 2.
18Arı, 2007: 38.
19Panwar, N.L., Kaushik, S.C., & Kothari, S., (2010). ‘’Role of renewable energy sources in environmental protection: A review’’. Renewable and Sustainable Energy Reviews 15 (2011) 1513– 1524.
6
resources depend on weather conditions. At the same time, it needs to integrate with intensive technology.20
Table 2: Economic Advantages and Disadvantages of Renewable Energy Resources
Advantages Disadvantages
Provides low operating costs High pre-investment required Provides low maintaining costs Requires long-term planning
Green energy source Requires long-term agreements
Provides long life period Excessive competition
Preserves ecosystems Requires new legal code
Provides efficient energy production Reduces greenhouse gas emissions Improves air quality
Helps decelerate climate change and global warming
Improves living conditions Creates new job opportunities Encourages regional development Generates tax and income
Source: Gökmen & Temiz, 2014 1.3.2 Secondary Energy Resources
The secondary energy is a type, which is obtained as a result of the physical conversion of the primary energy resources. Electricity and hydrogen energy are included in the secondary energy resources. Therefore, primary energy resources are the principal source for the generation of the secondary energy resources.21 Electric energy is among the mostly needed and used secondary energy resource. Per capita electricity energy consumption is considered as a part of computations for per capita energy consumption as a criterion of development. Electricity demand is increasing day by day in developed and developing countries around the world. Electricity is a highly preferred type of energy all over the world because of its high quality and less
20Aksöz, 2014: 9.
7
harm to the environment. People use electricity energy in many areas such as industry, housing and lighting.22
1.4 Types of Nonrenewable Energy Resources
The most important nonrenewable energy resources (fossil fuels) are coal, oil and natural gas. These resources constitute a large part of the world's energy production. Besides, nuclear energy has become an important nonrenewable resource of energy in recent times.23
1.4.1. Coal
Coal is a solid fossil fuel, which is flammable sedimentary rock and mine. It can be black, dark gray, brown-black brilliant or matte. It usually contains sulfur and nitrogen in small quantity stemming from oxygen, carbon and hydrogen. Required duration for coaling changes between 15 to 400 million years. Older coal sources are to be far more quality and high-calorie.24 According to BP's publication, definite coal reserves of world are 892 billion tons. This amount of coal reserves is sufficient for 142 years of energy production. Furthermore, coal has the highest production/reserve ratio compared to other fossil fuels. Coal is regarded as a lower-cost alternative compared to natural gas in many regions in electricity generation. Therefore, coal is the resource which is the most commonly used in electricity generation.25
Table 3: General Coal of International Classification
Stone Coals (Stiff Coals) Over 5700 kcal/kg
Brown Coals Below 5700 kcal/kg 1. Coking Coals
(It is in the quality that allows the coking production and proper to high ovens)
2. Non-Coking Coals a) Bitumen coals b) Anthracite
1. Subitem Coals
Between 4,165-5,700 kcal/kg in Calorific value, it doesn’t indicate coking feature. 2. Lignite
Below 4,165 kcal/kg in Calorific value, it doesn’t indicate coking feature.
Source: Erdoğan, 2014 22Aksöz, 2014: 8. 23Demir, 2015: 10. 24Erdoğan, 2014: 45. 25Demir, 2015: 14.
8
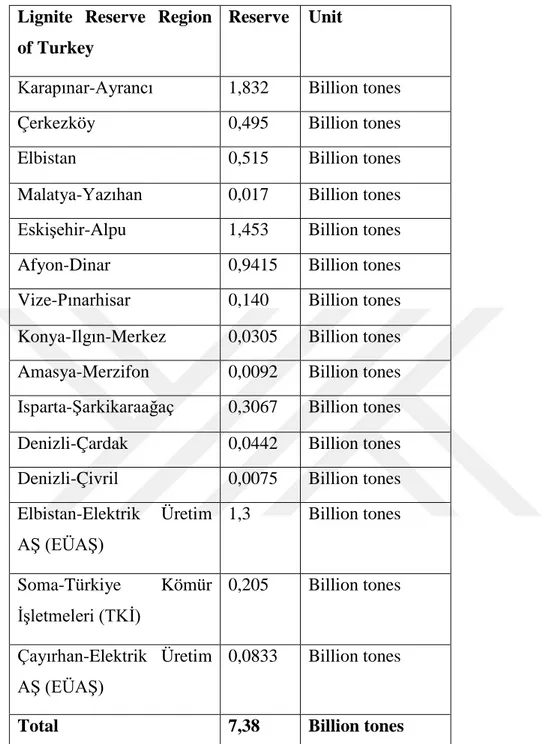
Table 4: Lignite Reserve Amounts Which Were Identified Between 2005-2015 in Turkey
Lignite Reserve Region of Turkey
Reserve Unit
Karapınar-Ayrancı 1,832 Billion tones
Çerkezköy 0,495 Billion tones
Elbistan 0,515 Billion tones
Malatya-Yazıhan 0,017 Billion tones
Eskişehir-Alpu 1,453 Billion tones
Afyon-Dinar 0,9415 Billion tones
Vize-Pınarhisar 0,140 Billion tones
Konya-Ilgın-Merkez 0,0305 Billion tones
Amasya-Merzifon 0,0092 Billion tones
Isparta-Şarkikaraağaç 0,3067 Billion tones
Denizli-Çardak 0,0442 Billion tones
Denizli-Çivril 0,0075 Billion tones
Elbistan-Elektrik Üretim AŞ (EÜAŞ) 1,3 Billion tones Soma-Türkiye Kömür İşletmeleri (TKİ) 0,205 Billion tones Çayırhan-Elektrik Üretim AŞ (EÜAŞ) 0,0833 Billion tones
Total 7,38 Billion tones
Source: Ministry of Energy and Natural Resources of Republic of Turkey, 201726
9
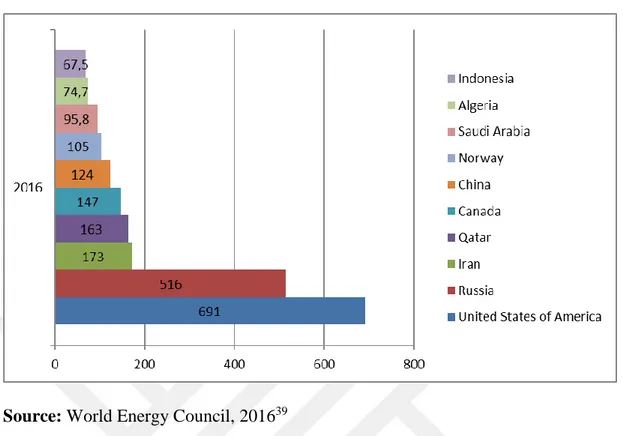
Figure 1: Coal Recoverable Reserves by Country in 2016 (Gigaton)
Source: Ministry of Energy and Natural Resources of Republic of Turkey, 201727
According to Figure 1, the US has largest part of global coal reserves with 237.3 gigatons. Russia is the second abundant country in terms of global coal reserves with 157 gigatons. Russia is followed by China with 114.5 gigatons of coal reserves. These two countries are respectively followed by Australia-76.4 gigatons, India-60.6 gigatons, Germany-40 gigatons, Ukraine-33.9 gigatons, Kazakhstan-33.6 gigatons and South Africa-30.2 gigatons. Hence, these nine countries have more than 90% of the global coal reserves in their territory.
27http://www.enerji.gov.tr/en-US/Pages/Coal ; accessed January 2017. 237.3 157 114.5 76.4 60.6 40 33.9 33.6 30.2 0 50 100 150 200 250 2016
United States of America Russia China Australia India Germany Ukraine Kazakhstan South Africa
10
Figure 2: Top 10 Countries Producing Coal in 2016 (Million tons of oil equivalent)
Source: World Energy Council, 201628
As it was indicated on the Figure 2, China has the highest rate as part of coal production activities in 2016. China has a massive superiority with 2620 million tons of oil equivalent in the coal manufacturing. It is unprecedented number in the world about the coal production. So, it is very tough to reach the million tons of oil equivalent of China for the other countries in forthcoming years. United States of America follows China at the second place with 569 million tons of oil equivalent. India, Australia, Indonesia and others respectively keep pursuing China and USA in coal production of 2016.
1.4.2. Natural Gas
Natural gas is a flammable, light to air, colorless and odorless gas. It is an underground resource and it’s in the places where the oil is found. It gets transported by the large pipelines.29 The most significant characteristic of natural gas is being environment friendly and not causing environmental pollution. A blue flame occurs when it burns. In case of turning into the gas, it burns far easier by providing the combination with air, at the same time, it enables this feature to control easily. Natural
28https://www.worldenergy.org/data/resources/resource/coal/ ; accessed January 2017. 29Erdoğan, 2014: 51. 2,620 569 474 339 274 261 176 129 94.9 0 500 1,000 1,500 2,000 2,500 3,000 2016 Kazakhstan Poland Germany South Africa Russia Indonesia Australia India
United States of America China
11
gas has become one of the cheapest fuels by safeguarding its position within the years in accordance with other fuels. It is estimated that the natural gas will be the fossil fuel with highest consumption rate till 2030 in the world.30
By the end of 2016, remaining producible natural gas reserves of Turkey was 18,8 billion m³.31 The natural gas consumption of Turkey has been identified as 46.395.060.952 Sm³ in 2016. Amount of natural gas subscriber is 12.496.511 and the number of eligible consumers is about 504.300 in Turkey.32
Table 5: The Natural Gas Consumptions by Sectors in Turkey (Million Sm³)
Sector 2016
Conversion and Cycle Sector 16.730,31
Energy Sector 346,3 Transportation Sector 397,37 Industry Sector 14.094,99 Service Sector 3.098,73 Housing 11.620,38 Other 106,97 General Total 46.395,06
Source: Republic of Turkey Energy Market Regulatory, 201633
According to Table 5, conversion and cycle sector has the highest rate with 16.730,31. It has a huge dominance compared to the other sectors. The industry sector is also prevalent with 14.094,99 in the natural gas consumptions. Housing, service sector, transportation sector, energy sector and other sectors are aligned with the numbers.34
30Yılmazer, Ö., (2016). ‘’Changing Role of Renewable Energy in Energy Economypolitics and Importance interm of Turkey’’. Unpublished Master’s Thesis. İzmir Kâtip Çelebi University, Institute of Social Sciences, Department of International Relations, İzmir: 5.
31Ministry of Energy and Natural Resources of Republic of Turkey, http://www.enerji.gov.tr/en-US/Pages/Natural-Gas ; accessed January 2017.
32 Natural Gas Market 2016 Sector Report, Republic of Turkey Energy Market Regulatory,
http://www.epdk.org.tr/TR/Dokumanlar/Dogalgaz/YayinlarRaporlar/Yillik ; accessed January 2017. 33http://www.epdk.org.tr/TR/Dokumanlar/Dogalgaz/YayinlarRaporlar/Yillik ; accessed January 2017.
12
Table 6: 2007-2016 years Natural Gas Generation Quantities of Turkey (Million Sm³)
Years 2007 2008 2009 2010 2011 2012 2013 2014 2015 2016
Quantity 874 969 684 682 759 632 537 479 381 367
Source: Republic of Turkey Energy Market Regulatory, 201635
Table 6 shows that the natural gas generation quantity of Turkey has reached to the top in 2008. Then, it has a small decrease as of 2009 and it continues to decline in the next years. The generation rate of natural gas in 2015 in Turkey is low compared to the other years. So, there is no precise stability, which is identified within this table.
Table 7: Natural Gas Import Amounts of Turkey (Million Sm³)
Russia Iran Azerbaijan Algeria Nigeria Others Total
2016 24.540 7.705 6.480 4.284 1.220 2.124 46.352
(%) 52,94 16,62 13,98 9,24 2,63 4,58 100
Source: Republic of Turkey Energy Market Regulatory, 201636
In accordance with Table 7, Turkey imports most of the natural gas it uses from Russia. Iran is the second, where Azerbaijan, Algeria and Nigeria come respectively after Russia and Iran. Turkey apparently imports a part of the natural gas from Middle Eastern countries as well as African states.
35http://www.epdk.org.tr/TR/Dokumanlar/Dogalgaz/YayinlarRaporlar/Yillik ; accessed January 2017. 36http://www.epdk.org.tr/TR/Dokumanlar/Dogalgaz/YayinlarRaporlar/Yillik ; accessed January 2017.
13
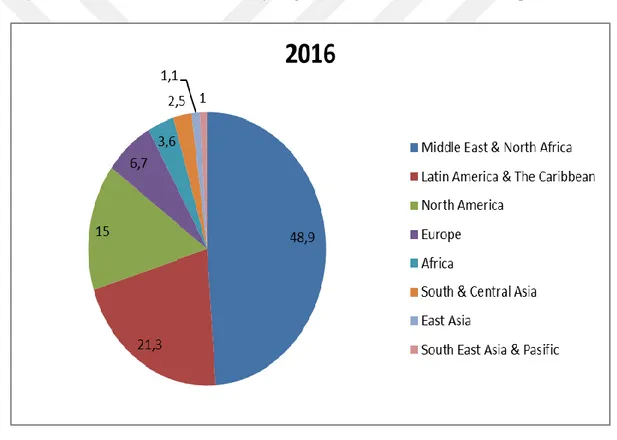
Figure 3: Gas Recoverable Reserves by Region in 2016
Source: World Energy Council, 201637
According to the Figure 3, The Middle East and North Africa have 79,2 thousand million tons of oil equivalent (46%) of natural gas reserves. Europe has 32,6 thousand mtoe (19%), South and Central Asia has 20,7 thousand mtoe (12%), North America has 11,5 thousand mtoe (6,7%), Africa has 9,14 thousand mtoe (5,3%), South East Asia and Pacific have 8,53 thousand mtoe (5%), Latin America and Caribbean have 6,89 thousand mtoe (4%), East Asia has 3,48 thousand mtoe (2%) of natural gas reserves.38
37https://www.worldenergy.org/data/resources/resource/gas/ ; accessed January 2017.
38World Energy Council, https://www.worldenergy.org/data/resources/resource/gas/ ; accessed January 2017.
14
Figure 4: Top 10 Countries Producing Natural Gas in 2016 (Mtoe)
Source: World Energy Council, 201639
As it can be viewed in Figure 4, USA and Russia are the first two states with highest yield of natural gas in 2016. Iran is the third one with 173 mtoe and the other countries are aligned within the natural gas production. The Middle Eastern countries are also dominant in the natural gas production in addition to the USA and Russia.
1.4.3. Oil
Figure 5: View of Oil Refinery
Source: Ministry of Energy and Natural Resources of Republic of Turkey, 201740
Oil is a complicated component, which is mainly comprised of hydrogen and carbon, as well as nitrogen, oxygen and sulfur. It can be found in solid, liquid and gas
39https://www.worldenergy.org/data/resources/resource/gas/ ; accessed January 2017. 40http://www.enerji.gov.tr/en-US/Pages/Petrol ; accessed January 2017.
15
states. Hydrogen and carbon are major components of petrol and natural gas, these are also known as ‘’hydrocarbons’’.41 Petroleum means crude oil that has not been extracted from underground processing, although it is only contained in the public as a specific fuel (gasoline, kerosene, diesel engine, engine oil, fuel oil).42
Furthermore, oil is an important commodity due to its strategic importance. Fluctuations in oil prices have a negative effect on the current account balance. Increases in oil prices can be economically bad for oil-importing countries but it is an economically good news for oil-exporting countries. However, Turkey is a country that imports a large part of its oil needs from abroad. Hence, the rise in energy prices negatively affect Turkey's current account balance.43
Figure 6: Recoverable Oil Reserves by Region in 2016 (Billion tons of oil equivalent)
Source: World Energy Council, 201644
According to Figure 6, Middle East & North Africa have 48,9% of total recoverable oil reserves of the world. Latin America & Caribbean have 21,3% of total
41Erdoğan, 2014: 49.
42Yılmazer, 2016: 8.
43Berument, M.H., Ceylan, N.B., & Doğan, N., (2010). ‘’ The Impact of Oil Price Shocks on the Economic Growth of Selected MENA Countries’’. Energy Journal. Vol 31, Issue 1, p.149-150. 44https://www.worldenergy.org/data/resources/resource/oil ; accessed January 2017.
16
recoverable oil reserves. Latin America and Caribbean are respectively followed by North America, Europe, Africa and South & Central Asia.
Figure 7: Top Oil Producing Countries 2016 (Mtoe)
Source: World Energy Council, 201645
According to Figure 7, Saudi Arabia, USA, Russia are highest oil producing countries, where they are producing nearly the same level of oil. These three countries are respectively followed by Canada, China, Iraq, etc.
1.4.4. Nuclear Energy
Today the nuclear energy is a significant energy resource worldwide. It is the energy that occurs by splitting (fission) big atoms (uranium, plutonium) or by merging (fusion) small atoms (like hydrogen). Uranium has been discovered in 1879. The foundations of today's nuclear technology took place in 1934 when the atom decomposition process continued.46
45https://www.worldenergy.org/data/resources/resource/oil/ ; accessed January 2017.
46Ministry of Energy and Natural Resources of Republic of Turkey, http://www.enerji.gov.tr/en-US/Pages/Nuclear ; accessed January 2017.
17 Figure 8: Nuclear Power Plant
Source: Ministry of Energy and Natural Resources of Republic of Turkey, 201747
Some characteristics of nuclear power plants:48
• Nuclear power plants don’t get affected from the natural conditions and climate.
• Capacity factors are about 90% average
• Nuclear power plants don’t produce greenhouse gas. Therefore, they are the important alternatives in terms of the prevention of the global warming.
• The fuel cost is far lower in accordance with the other resources. Thereby, the fluctuations in the fuel prices don’t affect the electricity production costs.
• Uranium, which is the raw material of the nuclear fuel, has been dispersed in the world. For that reason, the nuclear fuels are accessible at all times and conditions.
•Furthermore, the installation zone per unit electricity production of the nuclear power plants is far smaller according to all other powerhouses. For this reason, nuclear power plants have minimal impact on agriculture, habitation and natural life.
47http://www.enerji.gov.tr/en-US/Pages/Nuclear ; accessed January 2017.
48Ministry of Energy and Natural Resources of Republic of Turkey, http://www.enerji.gov.tr/en-US/Pages/Nuclear ; accessed January 2017.
18 Table 8: Available Uranium Reserves
Country Uranium (Ton) Percentage Australia 1.661.000 31 Kazakhstan 629.000 12 Russia 487.200 9 Canada 468.700 9 Nigeria 421.000 8 South Africa 279.100 5 Brazil 276.700 5 Namibia 261.000 5 US 207.400 4 China 166.100 3 Ukraine 119.600 2 Uzbekistan 96.200 2 Mongolia 55.700 1 Jordan 33.800 1 Other 164.000 3 Total 5.326.500 100 Source: Selvi, 2017
According to Table 8, the total available uranium reserves are 5.326.000 ton in the world. Australia is a dominant country in uranium resource with 31%. It is a satisfactory rate on the behalf of Australia. Then, it is respectively followed by Kazakhstan-9%, Russia-9%, Canada-9% and Nigeria-8%. South Africa, Brazil and Namibia has 5% available uranium reserves each. Other countries have remaining of the total available uranium reserves of the world.
19
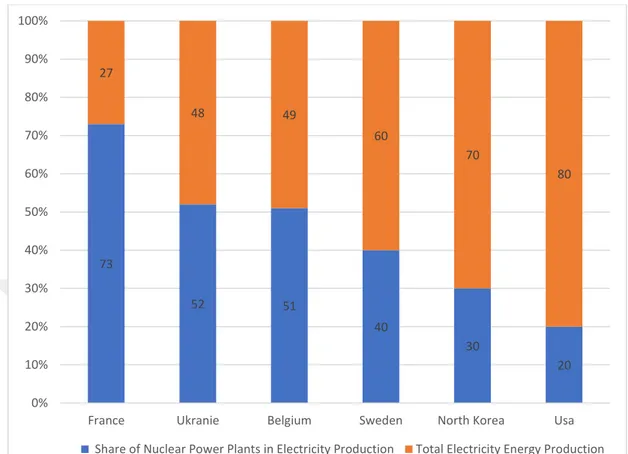
Figure 9: The Share of the Nuclear Electricity Production within the Total Electricity Production
Source: Ministry of Energy and Natural Resources of Republic of Turkey, 201749 1.4.4.1. Nuclear Energy in Turkey
In the recent years, Turkey has begun to invest in nuclear energy. The most significant reason of this is related to the vast demand of energy. Therefore, Turkey has begun to carry out investment projects concerning the nuclear energy in order to generate the huge returns. The initial nuclear project is the Akkuyu Nuclear power plant. It will be launched in 2023 as part of the collaboration project with Russia. The second nuclear project of our country is Sinop Nuclear Power Plant. This business partnership will be conducted by Japan. Energy deficit of Turkey will decline with the launching of these two-nuclear power plants.50
49 http://www.enerji.gov.tr/en-US/Pages/Nuclear ; accessed January 2017. 50http://www.enerji.gov.tr/en-US/Pages/Nuclear ; accessed January 2017.
73 52 51 40 30 20 27 48 49 60 70 80 0% 10% 20% 30% 40% 50% 60% 70% 80% 90% 100%
France Ukranie Belgium Sweden North Korea Usa Share of Nuclear Power Plants in Electricity Production Total Electricity Energy Production
20
1.5. Renewable Energy Resources Profile on Worldwide
There are serious changes and innovations about renewable energy resources in the world by each passing day. These changes and innovations are thought to be necessary for details of the scale of resources in the field of renewable energy.51 Nowadays, the most significant renewable energy resources are hydropower, geothermal, wind, solar and biomass energy resources. Reserves of nonrenewable energy resources limited in the world and it affects environment negatively. Therefore, the processing and use of renewable energy resources are increasing continuously in order to provide sustainability for energy and keeping preservation of natural balance.52
1.5.1. The Profile on Hydropower Energy
Around 17% of the electricity manufactured all over the world comes from hydropower plants.53 Hydropower plants (HPP) projects continue in every part of the world. Nowadays, some of the biggest projects might be example about this issue. For instance, 14,000 Megawatt is produced in Itaipu in Brazil and 22,400 MW is produced in Gorges in China from HPP. These two major projects produce 80 to 100 Tera Watt hours (TWh) per year.54 Moreover, Norway meet nearly a hundred percent of its electricity needs from hydropower plants. This rate is 84% in Brazil, 65% in Austria and 61% in Canada. China and USA are among developed countries that just meet a small percent (16% and 6% respectively) of own electricity needs from HPP.55
51Yılmazer, 2016: 40.
52Aksöz, 2014: 9-10.
53Quaschning, V., (2010). Renewable Energy and Climate Change. Singapore: John Wiley & Sons Ltd Press: 207.
54Yılmazer, 2016: 53.
21
Figure 10: Top Countries Producing Hydropower in 2016 (Mtoe)
Source: World Energy Council, 201656
The countries producing the highest hydropower are presented in Figure 10. China is the country, which has apparently the highest hydropower rate compared to the other countries. Also, Brazil, Canada and USA are the leading countries in terms of the hydropower generation worldwide. As for Turkey, it has a large potential in hydropower production. Turkey has produced total of 5.75 mtoe within 2016. In the recent years, Turkey has made a huge progress in the hydropower sector in order to engage in the rivalry with the other foreign countries.
22
Figure 11: Top Hydropower Installed Capacity by Country 2016 (GigaWatt)
Source: World Energy Council, 201657
As it is indicated in Figure 11, China apparently maintains its lead and superiority against the other countries, owing to its available hydropower capacity. China has 319 gw hydropower installed capacity. USA, Brazil and Canada are aligned after China. The installed capacity of the other countries in the hydropower area are far lower than China. Turkey has also a prodigious amount of hydropower installed capacity along with the other states according to 2016 data, it has 25,9 gw hydropower installed capacity. Thus, there is a high increase in Turkey’s hydropower capacity. It proves that Turkey can have higher hydropower possibilities in the future.
1.5.2. The Profile on Wind Energy
At the end of June 2016, the wind capacity reached to 456.486 MW worldwide. All wind turbines installed worldwide till the middle of 2016 can produce nearly 4,7% of the electricity demand of world. China, USA, Germany, India and Spain are important countries in wind energy due to the wind capacity in these countries. These are the countries with a share of 67% of the world wind capacity within 2016.
23
Although, the wind energy market continues to grow within the years, these countries had a higher share, 73%, of the world wind capacity by the end of June 2013.58 The global wind energy industry works very hard to respond quickly to changes in production.59
Figure 12: Top Countries Producing Wind in 2016 (Mtoe)
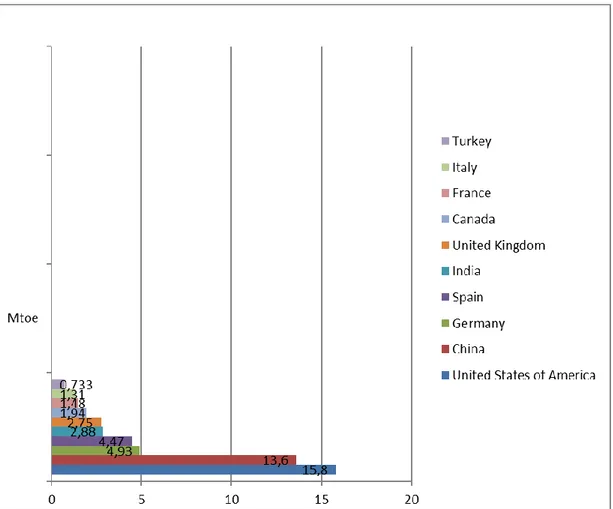
Source: World Energy Council, 201660
According to Figure 12, USA has the highest rate in the wind energy production. It produces 15,8 mtoe per year. China has also high amount of energy generation with a large gap in accordance with the other countries. China is respectively followed by Germany, Spain, India. Turkey is in the first 10 in terms of production. However, it keeps thriving in a rapid way in the wind energy production sector, despite having a lower rate against the foreign countries currently.
58The World Wind Energy Association Half-year Report, 2016 59Yılmazer, 2016: 45.
24
Figure 13: Top 10 Countries Which Installed Wind Capacity in 2016 (Gw)
Source: World Energy Council, 201661
With respect to Figure 13, China is the top among all other countries in 2016 It has a 145 gw installed wind capacity. Moreover, USA has also high amount of wind installed capacity. USA is respectively followed by Germany, India, Spain, etc. Unfortunately, Turkey isn’t in top 10 countries about the wind installed capacity. However, it keeps developing and widening its wind installed capacity according to the recent years.
1.5.3. The Profile on Geothermal Energy
The development of the technology has provided the possibility for the generation of electricity in fields with large underground heat exchange and low heat. The cost of establishing geothermal energy will be reduced even more by new technological developments. Alpine Himalayan Belt, Central American Volcanic Belt, Ant Volcano Belt, Caribbean Belt, Iceland and other Atlantic islands, and East African Rift System are availably major geothermal resources on the World.62 China, USA, Turkey and Iceland are the definite leaders in terms of geothermal energy.63
61https://www.worldenergy.org/data/resources/resource/wind/ ; accessed January 2017. 62Yılmazer, 2016: 20-47.
25
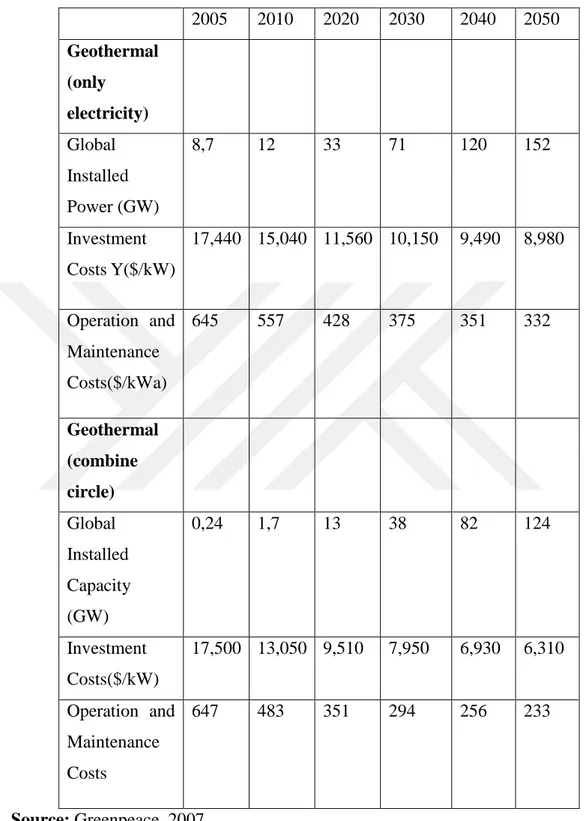
Table 9: Decline of Investment Costs in Response to Installed Power Rise in Geothermal Energy in Forthcoming Years Worldwide
2005 2010 2020 2030 2040 2050 Geothermal (only electricity) Global Installed Power (GW) 8,7 12 33 71 120 152 Investment Costs Y($/kW) 17,440 15,040 11,560 10,150 9,490 8,980 Operation and Maintenance Costs($/kWa) 645 557 428 375 351 332 Geothermal (combine circle) Global Installed Capacity (GW) 0,24 1,7 13 38 82 124 Investment Costs($/kW) 17,500 13,050 9,510 7,950 6,930 6,310 Operation and Maintenance Costs 647 483 351 294 256 233 Source: Greenpeace, 2007
With respect to Table 9 of geothermal (only electricity), global installed power manifests a wide upscale step by step in each passing year. Especially, there is a huge gap, which is observed between 2030 and 2040. Then, it will reach to 152 GW in 2050 in accordance with the estimations. As for investment costs of the geothermal energy,
26
a vast decline is examined year by year. When this cost of the investment is 17440$ in 2005, it is lowered to $8980 in 2050. In other words, operation and maintenance costs are 645$ in 2005. However, this rate will decline to 332$ in 2050. Briefly, there is a downturn stage by stage in the costs of operation and maintenance activities.
According to Table 9 of geothermal (combine circle), global installed capacity keeps growing toward 2050 starting as of 2005. The biggest foreseen rise is indicated between 2030 and 2040. An uptrend will be observed within those periods. This number will reach to 124GW in 2050. Moreover, the investment costs of the geothermal energy (combine circle) will be lowered in each year. In 2005, the total investment cost was 17500$. However, it keeps decreasing in a swift way in each year. The largest interval is between 2005 and 2010 but it continues to decrease in the other years. In 2050, it will reduce to 6310$ in accordance with the outlooks. On the other hand, the operation and maintenance costs begin with 647$ in 2005. A wide downtrend has been identified between 2005 and 2010 about the geothermal in Combine Circle. This rate will decline to 233$ in 2050 with those expectations.
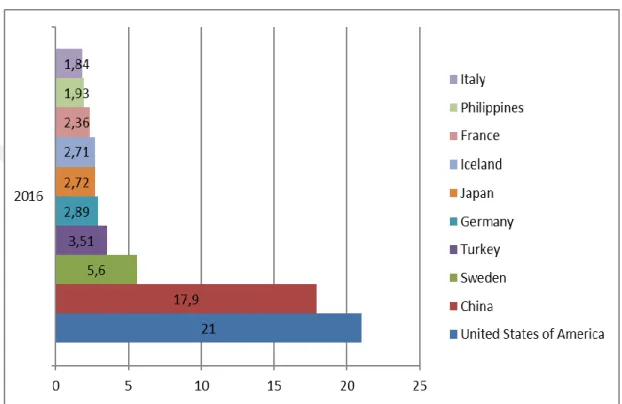
Figure 14: Top 10 Countries Producing Geothermal Energy (Mtoe)
Source: World Energy Council, 201664
27
As it is indicated in Figure 14, China is at the first place. It is producing 4,18 mtoe per year. USA and Turkey are respectively the second and third largest countries in terms of the geothermal energy generation. USA and Turkey are respectively producing 3,26 and 1,28 mtoe per year. Turkey is followed by Sweden, Iceland and Philippines.
Figure 15: Top Geothermal Installed Capacity by Country (Gw)
Source: World Energy Council, 201665
As it is indicated in the Figure 15, USA and China have huge potential due to their geothermal installed capacity. Also, Sweden and Turkey have significant geothermal potential. Turkey has 3,51 gw geothermal installed capacity. Turkey is respectively followed by Germany, Japan and Iceland.
1.5.4. The Profile on Biomass Energy
Biomass rises to 14% in global energy usage. Africa, Asia, and Latin America are highly populated areas, which provide the large of their energy needs from biomass energy. Biomass is mostly used for basic human needs such as cooking and heating in
28
large part of rural population and in lower income groups of these regions.66 For instance some countries, such as Mozambique and Ethiopia, use traditional biomass to meet above 90% of their primary energy needs.67
The US and Brazil have succeeded in producing 64.7% of the biofuels produced in the world in 2013. Among the reasons for this tremendous production are the effects of having sources of raw materials. However, the consumption - production balance brought about by awareness cannot be ignored. Brazil intensively uses biomass energy. It is one of the best examples of global scale. For Instance, in Brazil approximately 5 million vehicles use pure bioethanol fuel, which is obtained from sugar cane or similar products since the late 1980s. In the United States, biomass fuels generate more than 9000 MW of electricity. In this country, 4% of total energy is obtained from biomass. The European Union (EU) has set targets for improving itself on biomass energy. The sum of the countries within the EU and those close to the EU in the context of the neighborhood policy constitute 16.8% of the world's biofuels by the end of 2013.The EU members Germany and France are two important states that have increased the production of biofuel energy between 2003 and 2012.Although, Germany and France make up 7% of world biofuel production, biofuel production in these countries decreased in 2013.68
1.5.5. The Profile on Solar Energy
Although, solar energy has a much more potential than other energy resources, adequate technology hasn’t been evolved for the solar energy. Major solar energy technology has been developed on four methods: passive and active building heating and cooling systems, photovoltaic electricity generation (PV), concentrated solar energy (CSP) electricity production and solar fuel production.It is aimed to increase productivity and market share of systems with research & development studies.69
The work done in the topic of solar energy can be shown as a common example of Europe. According to the guidelines published by the European Parliament (EP), EU member states were asked to set targets for the construction of energy-saving and
66Eylem, Ö. & Yarbay, R.Z., (2010). “The Potential and Future of Renewable Energy Sources in Turkey”. İstanbul Ticaret University, Journal of Science 18: 89.
67Quaschning, V. 2010: 237.
68Habitat Derneği, “Temiz Enerji Yayınları: Biyokütle Enerjisi”,
http://habitatdernegi.org/tr/dl/yayin/TemizEnerjiYayinlari/BiyoKutle.pdf , : 14. 69Yılmazer, 2016: 42.
29
self-generating buildings until 2015. It is emphasized that all public buildings will be such buildings after 2018. It is targeted that this change process will be completed till 2020. It is thought that the application of these systems to the construction sector in the living spaces to increase the productivity will be a right move for developing societies, industrial and agricultural productions due to the increased energy demand created by population growth.70
Figure 16: Solar Installed Capacity by Region in 2016 (Mtoe)
Source: World Energy Council, 201671
According to Figure 16, European Continent is more ascendant than the other continents with 43,7% as part of the solar installed capacity in 2016 data. Afterwards, East Asia is at the second position and it has 35,2% of the total solar installed capacity. East Asia respectively followed by North America, South East Asia & Pacific and South & Central Asia.
70Arvizu, D. & Balaya, P., (2011). ‘’IPCC Special Report on Renewable Energy Sources and Climate Change Mitigation -Direct Solar Energy’’, Cambridge: Cambridge University Press:46.
30
Figure 17: Top Solar Installed Capacity by country in 2016 (Gw)
Source: World Energy Council, 201672
In accordance with the Figure 17, China has an ascendancy in the country standings concerning the solar installed capacity among the other countries in 2016. Germany, Japan and USA are respective countries, which follow China in this figure. However, UK, Spain, France, India and Australia have a much lower rate than the other states.
1.5.6. The Profile on Wave Energy
The most potent wave resources occur in the regions, where tough winds moved through long distances. Hence, the most powerful wave resources in Europe occur throughout the western coasts (Atlantic Ocean).73 According to US Department of Energy, the potential of wave energy in coastal regions can generate about 2-3 million megawatts of energy. The western coasts of Scotland, northern Canada, Southern Africa, Australia, northeast and northwestern coasts of USA are abundant places due to its wave energy.74
72https://www.worldenergy.org/data/resources/resource/solar/ ; accessed January 2017.
73 The European Marine Energy Centre, http://www.emec.org.uk/marine-energy/ ; accessed January 2017.
74Çabuk, S.Ö., (2011). ‘’The Evaluation of the Role of Economic Instruments fort he Reduction of the Greenhouse Gas Emissions that Cause Global Warming: Energy Sector Example’’. Unpublished Doctorate Thesis. Ankara University, Institute of Social Sciences, Department of Political Science and Public Administration (Urban and Environmental Science), Ankara: 200.
31
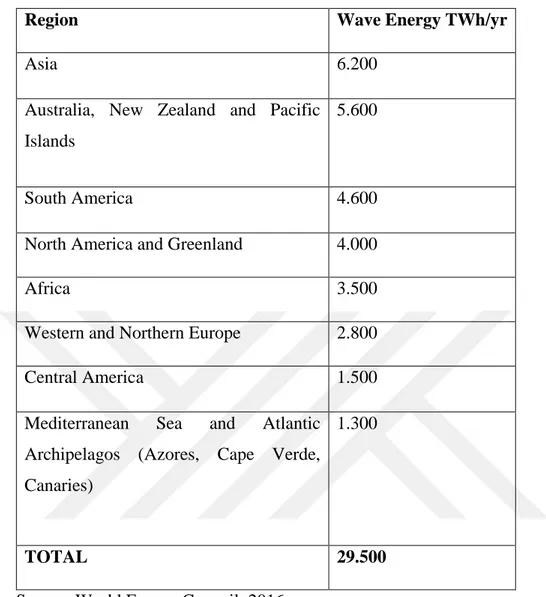
Table 10: Potential of Wave Energy According to Region
Region Wave Energy TWh/yr
Asia 6.200
Australia, New Zealand and Pacific Islands
5.600
South America 4.600
North America and Greenland 4.000
Africa 3.500
Western and Northern Europe 2.800
Central America 1.500
Mediterranean Sea and Atlantic Archipelagos (Azores, Cape Verde, Canaries)
1.300
TOTAL 29.500
32
CHAPTER TWO
2. THE KYOTO PROTOCOL, ITS SIGNIFICANCE AND IT CORRELATION TO ENVIRONMENTAL ISSUES
2.1. The United Nations Climate Change Framework Convention on Climate Change
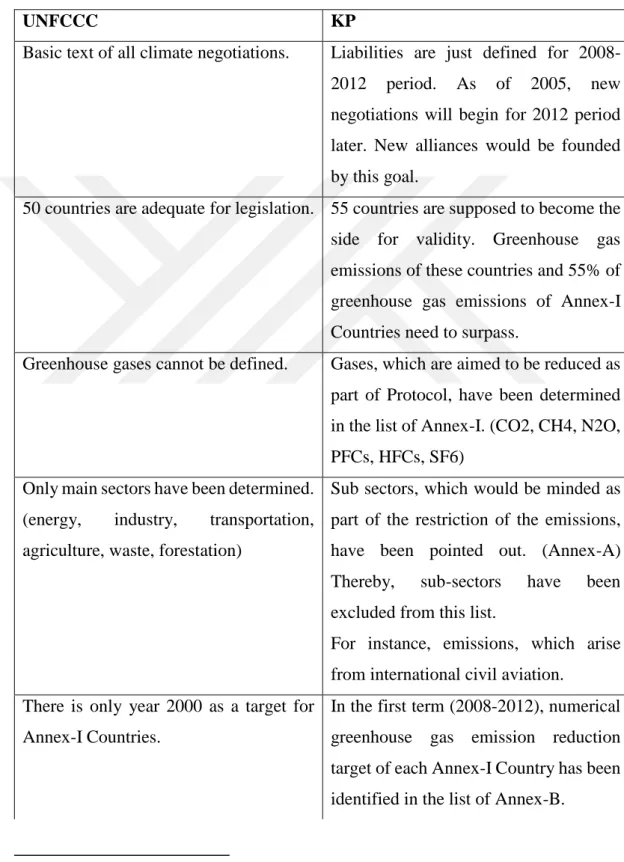
The United Nations Framework Convention on Climate Change entered in force on March 21, 1994.The UNFCCC was named "Rio Conventions" because of its emergence at the 1992 Rio Summit.75 United Nations Framework Convention on Climate Change aimed combating climate change and keeping greenhouse gas emissions at 1990 level till 2000. Nevertheless, it has been understood that the contract is inadequate since there is no global decline in greenhouse gas emissions. Countries have expressed the view that the contract does not have sufficient obligations to reduce greenhouse gas emissions.76
2.2. The Kyoto Protocol
The Kyoto Protocol is an international agreement under the UNFCCC. The Kyoto protocol entered in force as an Annex to the UNFCCC. The international concern about climate change have initiated the Kyoto Protocol negotiations process in December 1997. This negotiation process was ratified in 16 March 1998. It was accepted in the 7th Conference of the Parties in Marrakech, Morocco in 2001. After Russian Federation approved this treaty in November 2004 and so entered in force on February 16, 2005. There are two conditions for the contract to render the validity. First condition, at least 55 states must become the party to the Protocol. Second
75Özüt, G.H., (2010). ‘Post Kyoto Protocol Period at International Climate Change Negotiations and Local Governments’’. Unpublished Master’s Thesis. Ankara University, Institute of Social Sciences, Department of Social Environmental Sciences, Ankara: 54.
76Eren, İ., (2012). ‘’Global Climate Protection of the Work Under the Kyoto Protocol and Role of the Local Government Studies Role’’. Unpublished Master’s Thesis. Adnan Menderes University, Institute of Social Sciences, Department of Finance, Aydın: 16.
33
condition party states are supposed to create 55% of the total world emissions.77 The Kyoto Protocol includes the legal obligations that identify activities to reduce the greenhouse gas after 2000. Since the Kyoto Protocol includes stricter sanctions and mechanisms than the UNFCCC, it has been excluded from the Protocol and has a precise mastery over these aspects.78
The countries, which become a party to the UNFCCC are also a party to the Kyoto Protocol. There is a condition of becoming the party to the UNFCCC to become in the party of Kyoto Protocol. Countries, which joined as observers to UNFCCC are not under the obligation of becoming a party.79 Currently, there are 192 parties to both Kyoto Protocol and the UNFCCC. However, Kyoto Protocol and UNFCCC contain 191 States and 1 regional economic integration organization.80
The position of United States is different. US is a party to the UNFCCC. However, it declared that it would not ratify the Kyoto Protocol in the beginning. Then, the Protocol was approved by US president. When the senate of United States didn’t approve this important protocol, it is still considered as unapproved. Afghanistan, Andorra, Brunei, Chad, Palestine, Iraq, Democratic Republic of Sahara Arab San Marino, Somali, Taiwan, Vatican Countries have not made any declaration or commitment about the issue of becoming a party to the protocol.81
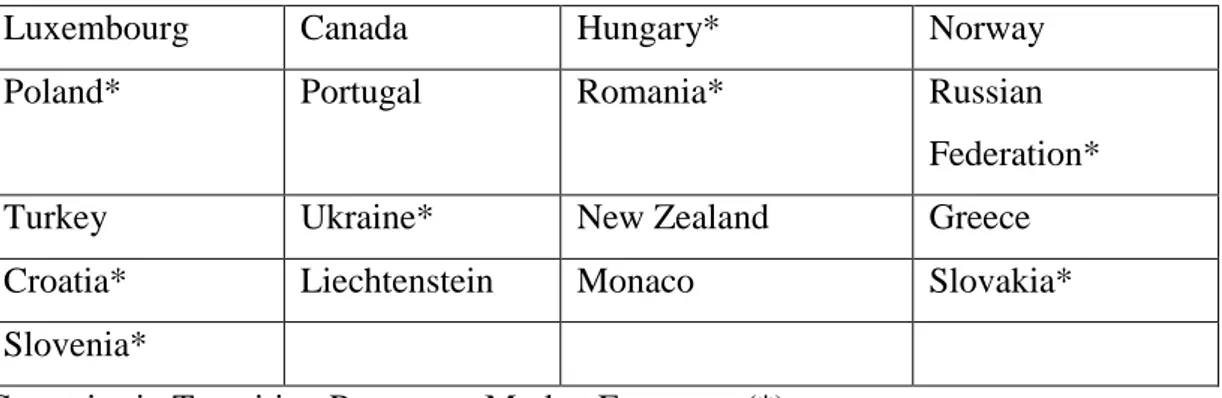
Table 11: List of Annex-I of UNFCCC
Germany US European Community Australia
Austria Belgium Belarus* Bulgaria*
Czech Republic* Denmark Estonia* Finland
France England and
Northern Ireland
Netherlands Ireland
Spain Sweden Switzerland Italy
Iceland Japan Latvia* Lithuania*
77Uzoğlu, Y., (2016). ‘’The Role of the United Nations about Kyoto Period: Economic Analysis of Environmental Impacts of Carbon Trading’’. Unpublished Master’s Thesis. Çankırı Karatekin University, Institute of Social Sciences, Department of Economics, Çankırı: 24.
78Eren, 2012: 17. 79Eren, 2012: 17.
80United Nations Framework Convention on Climate Change,
http://unfccc.int/kyoto_protocol/status_of_ratification/items/2613.php ; accessed January 2017.
34 Table 11 Continued
Luxembourg Canada Hungary* Norway
Poland* Portugal Romania* Russian
Federation*
Turkey Ukraine* New Zealand Greece
Croatia* Liechtenstein Monaco Slovakia*
Slovenia*
Countries in Transition Process to Market Economy (*)
The obligations of Annex-I countries have precisely been stated in 4. provision of article 2 (a) of the UNFCCC. The obligations of ANNEX-I countries are limiting greenhouse gas emissions and formulating national policies to reduce climate change.82
China, India, Pakistan, Mexico and Brazil are presented in Annex-I as non-party countries that do not have obligations. These are mostly the developing countries. These countries have been defined in terms of agreement as small island states, coastal countries with lower altitude, countries under drought risk, countries prone to natural disasters, economies largely fossil fuel-linked countries. Financial resources and technology transfer are needed to take an action against the harmful effects of climate change in these countries.83
Table 12: List of Annex-II of UNFCCC
Germany US European
Community
Australia
Austria Belgium United Kingdom of
Great Britain and Northern Ireland
Denmark
Finland France Netherlands Ireland
Spain Sweden Switzerland Italy
Iceland Japan Luxembourg Canada
Norway Portugal New Zealand Greece
82Uzoğlu, 2016: 20-21.