ESTIMATION OF THE COST FUNCTION OF THE TURKISH
BANKING INDUSTRY AND OYAKBANK
A Master Thesis
By
MURAT YANIK
Department of Management
Bilkent University
Ankara
July 2003
ESTIMATION OF THE COST FUNCTION OF THE TURKISH BANKING INDUSTRY AND OYAKBANK
The Institute of Economics and Social Sciences Of
Bilkent University
By
Murat YANIK
In Partial Fulfillment of the Requirements for the Degree of
MASTER OF BUSINESS ADMINISTRATION in
THE DEPARTMENT OF MANAGEMENT BİLKENT UNIVERSITY
ANKARA July 2003
I certify that I have read this thesis and have found that it is fully adequate, in scope and in quality, as a thesis for the degree of Master of Business Administration.
---
Assist. Prof. Aslıhan SALİH ALTAY
I certify that I have read this thesis and have found that it is fully adequate, in scope and in quality, as a thesis for the degree of Master of Business Administration.
--- Assist. Prof. Ümit ÖZLALE
I certify that I have read this thesis and have found that it is fully adequate, in scope and in quality, as a thesis for the degree of Master of Business Administration.
--- Assist. Prof. Selçuk Caner
Approval of the Institute of Economics and Social Sciences
--- Prof. Kürşat AYDOĞAN Director
ABSTRACT
ESTIMATION OF THE COST FUNCTION OF THE TURKISH
BANKING INDUSTRY AND OYAKBANK
Yanık, Murat
M.B.A., Department of Management Supervisor: Assist. Prof. Selçuk Caner
July 2003
The purpose of this study is to estimate the cost function of the Turkish banking industry with the translog cost functional form, which permits the estimation of U-shaped average cost curves. In addition, this study falls short in explaining the position of OYAKBANK relative to the industry. The data information of 20 banks included in the estimation is annual and covers 1999 through 2001 for the industry. However, the annual data of OYAKBANK included in the estimation covers over the period from 1990 through 2001. I pool all the data and estimate by Iterative Seemingly Unrelated Regression (SUR) analysis.
Keywords: Translog Cost Functional Form, Iterative Seemingly Unrelated
ÖZET
TÜRK BANKACILIK SEKTÖRÜNÜN VE OYAKBANKIN
MALİYET FONKSİYONUNUN HESAPLANMASI
Murat YANIK
YÜKSEK LİSANS TEZİ, İŞLETME FAKÜLTESİ Tez Danışmanı: Yrd.Doç. Dr. Selçuk Caner
Temmuz, 2003
Bu çalışmanın amacı, U şeklindeki ortalama maliyet eğrilerinin hesaplanmasına imkan veren translog maliyet fonksiyonel formuyla Türk bankacılık endüstrisinin maliyet fonksiyonunun hesaplanmasıdır. Bu çalışma ayrıca OYAKBANK’ın endüstriyle karşılaştırmalı pozisyonunu da açıklamaktadır. Endüstri için hesaplamada kullanılan 20 bankanın verileri yıllık veri olup 1999 ve 2001 yıllarını kapsamaktadır. Bununla beraber, OYAKBANK’ın hesaplamada kullanılan yıllık verileri ise 1990 ve 2001 yıllarını kapsamaktadır. Çalışmada tüm gerekli verileri topladım ve SUR regresyon analizi ile hesaplamaları yaptım.
Anahtar Kelimeler: Translog Maliyet Fonksiyonu, SUR Regresyon Analizi, bankacılık, etkinlik, OYAKBANK.
ACKNOWLEDGEMENTS
I am very grateful to Assist. Prof. Selçuk Caner for his supervision, constructive comments, and patience throughout the study. I also wish to express my thanks to other committee members for their comments on the study. Finally, I am grateful to my family, to whom this thesis is dedicated.
TABLE OF CONTENTS
Abstract ………. iv
Özet ………. v
Table of Contents ………. vii
List of Tables ………. ix
List of Figures ………. x
List of Abbreviations ………. xi
CHAPTER 1: Introduction ………. 1
CHAPTER 2: Banking in Turkey: Structure and Regulations 4 2.1 Restructuring of the Turkish Banking Sector... 5
2.1.1 Major Weaknesses of the Turkish Banking System 6 2.1.2 Restructuring of the State-owned Banks 7
2.1.3 Restructuring of the Banks Taken Over by the SDIF 8 2.1.4 Restructuring of the Privately-owned Banks 8
2.2 Main Features of the Turkish Banking system….. 9
2.2.1 The Structure of Assets... 10
2.2.2 The Structure of Liabilities... 11
2.2.3 Concentration in Banking System... 12
2.2.4 Shareholders’ Equity... 13
2.2.5 The Structure of Income... 13
2.2.6 Off-balance Sheet Accounts... 14
2.2.7 Change in the Number of Banks, Employees and Branch Offices... 15
2.3 Legal and Administrative Regulations....……….. 17
CHAPTER 3: Literature Review ……… 20
3.1 Efficiency Studies on the Turkish Banking Industry 22
CHAPTER 4: Methodology...………. 24
4.1 The Efficiency Concept...………. 25
4.2 Translog Cost Function Model……….. 27
4.3 Limitations of the Translog Cost Functional Form 32 CHAPTER 5: Estimation of the Cost Function of the Turkish Banking Industry and OYAKBANK...……… 34
5.1 Data ……… 35 5.2 Variables ………... 36 5.3 Estimation...………. 46 CHAPTER 6: Results ………. 51 CHAPTER 7: Conclusion ……….. 68 BIBLIOGRAPY ……….……… 71
APPENDIX A: Selected Items from Banking Act No: 4389 75
APPENDIX B: Changes in Status of Banking in Turkey between 1999 – September 2002... 83
APPENDIX C: Reports of the Turkish Banking Industry’s Balance Sheets, Income Statement and Off-Balance Sheets Accounts 85
APPENDIX D: The Liability Tables of the Banks in the Study Including OYAKBANK……….. 98
LIST OF TABLES
Table 2.1 Concentration in Banking Sector………... 12
Table 2.2 Number of Banks and Branches in the System……… 16
Table 2.3 Number of Employees………. 17
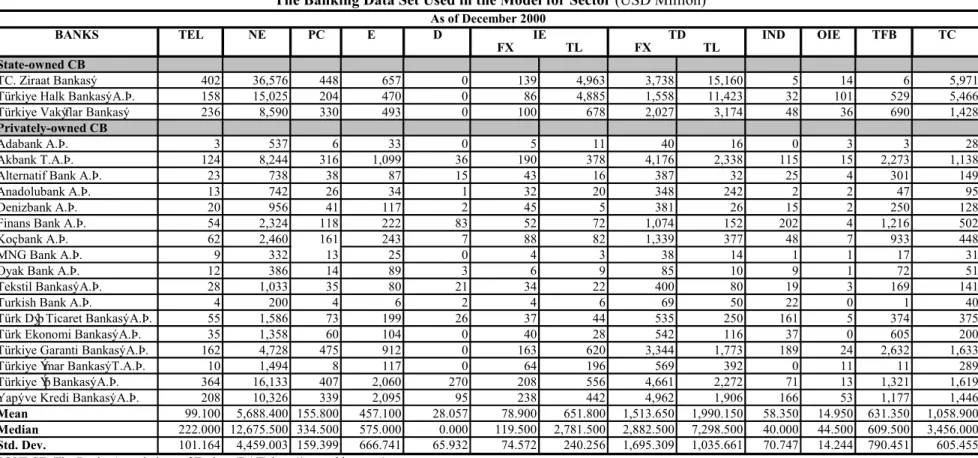
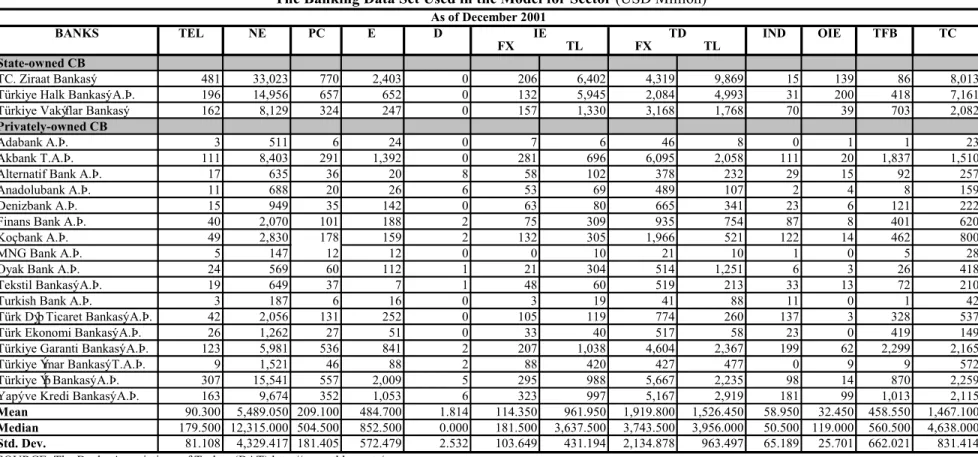
Table 5.1 The Banking Data Set Used in the Model…………... 38
Table 5.2 The Variables and Their Values Used in the Model………... 42
Table 6.1 Parameter Estimates for 1999...……… 53
Table 6.2 Parameter Estimates for 2000...……… 55
Table 6.3 Parameter Estimates for 2001...……… 57
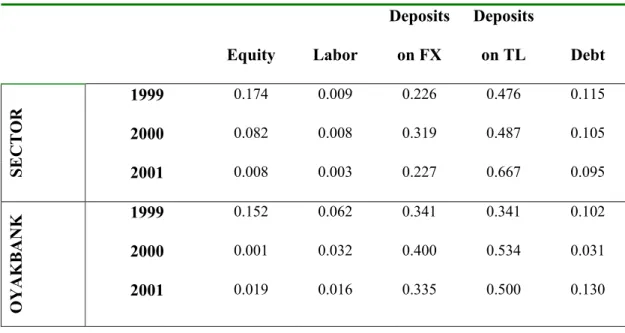
Table 6.4 Cost Shares…..……...……… 60
Table 6.5 Implied Elasticities of Substitution for Sector...…. 62
Table 6.6 Implied Elasticities of Substitution for OYAKBANK...………... 63
LIST OF FIGURES
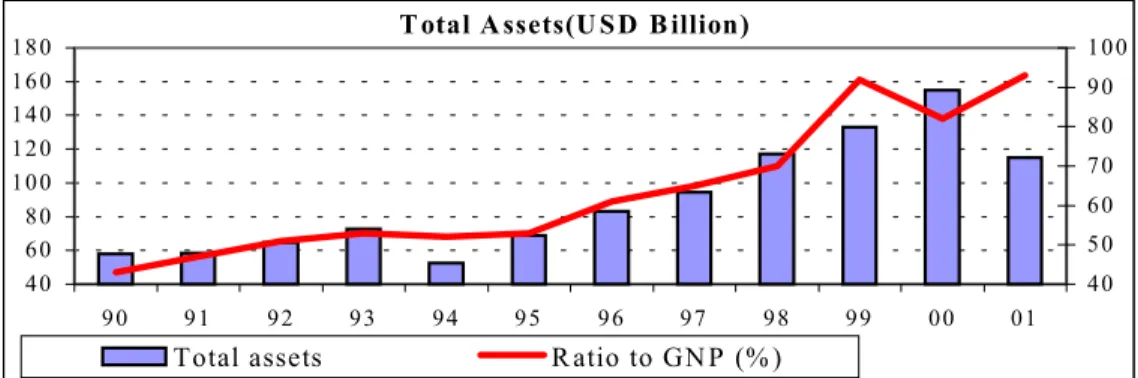
Figure 2.1 Total Assets of the Banking Sector and the Ratio of
Total Assets to GNP...………. 11 Figure 2.2 Shareholders’ Equity Ratios to Total Assets………... 13 Figure 4.1 Long-run Average Cost Curve………. 28 Figure 6.1 Cost Share Graphs for the Sector in1999…..……….. 64 Figure 6.2 Cost Share Graphs for the Sector in 2000…..………. 65 Figure 6.3 Cost Share Graphs for the Sector in 2001…..……….. 66
LIST OF ABBREVIATIONS
BAT : The Banks Associations of Turkey BIS : Bank for International Settlements
BRSA : Banking Regulation and Supervision Agency CES : Constant Elasticities of Substitution
D&IB : Development & Investment Banks DEA : Data Envelopment Analysis E : Equity
EU : European Union FO : Foreign Banks FX : Foreign Exchange GNP : Gross National Product IE : Interest Expenses
IND : Interest on Non-deposit Funds IZEF : Iterative Zellner-Efficient Estimator ML : Maximum Likelihood
NE : Total Number of Employees OIE : Other Interest Expenses PC : Property Costs PDB : Price of Debt
PDFX : Price of Financial Capital in Foreign Exchange PDTL : Price of Financial Capital in Turkish Lira PK : Price of Physical Capital
PL : Price of Labor
SDIF : Savings Deposit Insurance Fund SO : State-owned Banks
SUR : Seemingly Unrelated Regression TA : Total Assets
TC : Total Bank Costs
TD : Total Volume of Deposits TEL : Total Expenses on Labor TFB : Total Funds Borrowed TL : Turkish Lira USD : United States Dollar
CHAPTER 1
INTRODUCTION
Before the ‘1980 Stabilization Program’ the Turkish banking industry was inward looking and having extensive protection against foreign competition. Because there were strict barriers to entry, interest rates on both credits and deposits were determined in a monopolistic manner (Oral and Yolalan, 1990). The main objective of the economic reforms in the ‘1980 Stabilization Program’ was to create a free market economy. The financial policies undertaken aimed at increasing efficiency by stimulating competition in the banking sector. Therefore, interest and foreign exchange rates were significantly liberalized and entry from both domestic and foreign banks was allowed. As a result, the competitive environment aimed at by the program emerged in the Turkish banking industry.
The Turkish banking system includes the Central Bank, commercial banks, and investment & development banks. Meanwhile by ownership, the commercial banks and the investment & development banks can be put into three subcategories: State-owned, privately owned and foreign banks. The commercial banks operate as universal banks. In other words, they engage in financial activities providing traditional depository and lending services, financing foreign trade activities and maintaining capital market transactions as well as investment banking activities. In 1999, they owned the 95% of the total assets of all banks whereas the investment & development banks owned only 5%. These percentages were 96% and 4% respectively in 2000, and 95% and 5% respectively in 2001. Moreover, state-owned and privately owned commercial banks dominate the commercial banks’ total assets
together with 84% share in 1999, 81% share in 2000 and 88% share in 2001. In this study, therefore, I only focus on the state-owned and privately owned commercial banks excluding the investment & development banks and foreign banks in Turkey.
New competitors have entered the financial industry and the distinction between the various types of financial institutions (such as commercial banks, saving banks, finance companies and other non-bank intermediaries such as securities firms and insurance companies) have become increasingly blurred. Technological innovations have stimulated the deterioration of statutory and physical barriers among sectors. Product (or service) and territorial competition has also heightened. However, banks have been the most important segments of the financial system and this sector has always been subject to not only competition and external pressures but also interference by the legal and regulatory agencies. Since banks reallocate money or provide credit, from savers, who have a temporary surplus of it, to deficit units (borrowers), and operate the payments system clearly, their failure can have a more damaging effect on the economy than the collapse of other businesses1. Priority in banking has shifted away from growth and size alone towards a greater emphasis on profitability, performance and ‘value creation’ within the banking firm.
This study seeks to analyze the costs and cost economies involved in the banking sector. And more importantly, those analyses are applied to the Turkish banking industry for estimating the cost function of the Turkish banking industry and OYAKBANK. I approach the problem using cost minimization framework, in which each commercial bank is assumed to minimize the cost of producing a given level of output. Simply total cost is a multivariable function, which is determined by many explanatory factors. Where total cost is determined as the sum of expenditures on all
inputs, however, the value of cost can be specified as a function of the level of output and the prices of all inputs. I refer to this function as the cost function represented by a translog cost function. The cost function approach has been widely used to model the technology of a firm operating in regulated environments, such as the banking industry. Outputs of banking firms are assumed exogenous. Since input prices are also deemed exogenous under the competitive factor market assumptions, we can obtain consistent parameter estimates by using cost function estimates. The important property of the translog form of the cost function is its capability in estimating multi-output production that is important in banking industry.
I pool all the data for 20 banks in the sector over the period from 1999 to 2001, which the data information of each bank included in the estimation is annual. For OYAKBANK, I pool all the data annually over the period from 1990 through 2001. I estimate the model by Iterative Seemingly Unrelated Regression (SUR) analysis with Eviews4.0. In the model, equity, labor, deposits on FX, deposits on TL, and debt are independent variables, where bank’s output is dependent variable.
The thesis proceeds as follows. The following chapter overviews the Turkish banking industry. Literature is reviewed in Chapter 3. Chapter 4 presents the methodology used in the study and the cost economics of banks. The data and specification of the relevant variables and estimation method are presented in Chapter 5. Chapter 6 summarizes the results of the determinants of the Iterative Seemingly Unrelated Regression (SUR) analysis realization for the years 1999, 2000 and 2001. Chapter 7 concludes.
CHAPTER 2
BANKING IN TURKEY: STRUCTURE AND REGULATIONS
Banks accept deposits (liabilities) and make loans (assets) like other financial institutions and credit unions. However, they differ in their composition of assets and liabilities, which are much more diversified. Their liabilities usually include several types of non-deposit sources of funds; their loans are broader in range, including consumer, commercial and real estate loans. Their activity is also regulated separately from the activities of other institutions and credit unions. Within the banking industry the structure and composition of assets and liabilities also vary significantly across banks of different asset sizes (Saunders, 1997).
There are four state-owned commercial banks through 1999 and 2000, three in 2001, all are large and given a special duty by the state for subsidizing some sectors such as agriculture, real estate and small-medium size enterprises. Although smaller in number, the state-owned commercial banks occupy a substantial share in the banking system with 35 percent of total assets in 1999, with 34 percent of total assets in 2000 and with 32 percent of total assets in 2001. The state-owned banks heavily involve in quasi-fiscal activities and are repaid insufficiently by governments with duty losses. As a result of insufficient compensation by the government, there have been duty losses procedure, inadequate capital and tight in liquidity in the state-owned banks. Privately state-owned commercial banks included large commercial banks having nation-wide branches and providing all kinds of services and small sized banks of which activities concentrated on main business cities. Recently small sized banks have tried to increase their market share deposits expanding number of branches like OYAKBANK. These banks are usually located in major business
cities. Foreign banks operate with a branch or are founded in Turkey. They are small in size in the market with an assets share of 5 percent. They face same regulation with domestic banks. Investment & development banks can provide all kinds of banking services but not may take deposits.
With the awareness of the healthy banking system is of vital importance in the financial system, Turkey is continuing to take measures to improve both the quality and the effectiveness of banking surveillance system on the basis of the EU directives and BIS principles.
2.1. RESTRUCTURING OF THE TURKISH BANKING INDUSTRY
The problems in the banking sector have intensified in the last two years 1999, 2000 and forced the authorities to introduce a comprehensive restructuring program in 2001. The basic motivation behind the restructuring operations was threefold:
1) The removal of the state-owned banks destructive effects on stabilization;
2) The resolution of the banks taken over by the Savings Deposit Insurance Fund (SDIF)2 as soon as possible, and
3) The strengthening of the financial structure of the privately owned banks, which have weakened significantly during the recent financial crises April 1994, November 2000 and February 2001.
2 Look at the Appendix A: Selected Items from Banking Act No: 4389, for more information about
Restructuring the Turkish banking system mainly aim to restore solvency and sustainable profitability as well as increase the banking system’s allocative efficiency.
2.1.1. Major Weaknesses of the Turkish Banking System3
Weaknesses in the banking sector were the soft-belly of the economic program in Turkey, which started in the beginning of 2000. Before the implementation of the program the weaknesses that were already inherent in the system were:
Small and fragmented banking sector, Capital inadequacy,
Distortionary effects of state-owned banks and their large level of duty losses of banks now under the SDIF coverage,
Short-term maturity mismatches, FX open positions, and
Weak asset quality.
Moreover, during the program implementation process in 2000: Narrowing interest margins,
Increasing short-term maturity mismatches, Boom in consumer loans,
Increase in foreign borrowing by banks,
Opening FX position further due to the crawling-peg regime and covering the open positions with derivative contracts whose quality was questionable, and The continuation aforementioned problems,
further increased the fragility of the system to both domestic and external shocks. While these weaknesses continued to affect the functioning of the banks properly during the program implementation process, Turkish financial markets experienced two crises in November 2000 and February 2001, which deepened the problems in the Turkish banking sector and necessitated an urgent reshaping of the banking sector.
2.1.2. Restructuring of the State-owned Banks
The restructuring operation for the state-owned banks was carried out in line with the objective of improving their financial and operational structures in the first step, and privatizing afterwards. In line with the stated objective, the duty losses and short-term liabilities of these banks to other banks and non-banking sectors were removed. Providing a regular cash stream to the state-owned banks, strengthening their capitals, reducing their deposit costs to the market average, and achieving efficient management of their loan portfolios, thereby improving their balance sheet composition and profitability, were the main goals.
To prevent further duty losses in the state-owned banks, a number of legal decisions of the Council of Ministers, which were the legal basis for the earlier duty losses, were removed by the new decisions of the Council of Ministers issued on April 30, 2001 and July 3, 2001. Allocating additional provisions to the national budget was made a precondition for support through the state-owned banks. This new regulation was applied for the first time in 2001. During the restructuring period, the capital and net-worth of the state-owned banks were strengthened. In line with the restructuring objective of increasing the profitability of the state-owned banks, the interest rates on deposits offered by state-owned banks were kept collaboratively
below the rates on government securities. In this way, a substantial improvement was achieved in the profitability of the state-owned banks.
In line with the operational restructuring, the management of the state-owned banks was merged, the banking license of Emlakbank was revoked on July 6, 2001 and all the liabilities and some of their assets were transferred to Ziraat Bankası and Halk Bankası4.
2.1.3. Restructuring of the Banks Taken Over by the SDIF
Between November 1997 and November 2001, 19 banks were taken over by the SDIF and additional 4 by July 2002 totaling 23. During the restructuring process, SDIF banks were given government funding in the form of cash and government securities to strengthen their financial structure and terminate their short-term liabilities. The problem loans of these banks were transferred to the “the collection department”, which is a newly established unit within the BRSA5. One aim of the restructuring program was that the urgent problems of these banks would be eliminated and afterwards they would be sold. Banks that could not be sold within the planned period would be liquidated. The recent legal status of the SDIF banks is presented in the Appendix B (Changes in Status of Banks in Turkey Between 1999 - September 2002).
2.1.4. Restructuring of the Privately Owned Banks
In the restructuring process of the privately owned banks, new regulations were introduced. The regulations were related to: strengthening their capital structures, limiting their open positions in foreign currencies, encouraging mergers
4 See Appendix B: Changes in Status of Banks in Turkey Between 1999 - September 2002. 5
and takeovers, liquidating problem loans, and establishing internal risk management systems.
In order to encourage the privately-owned banks to strengthen their net-worth, the portion of receipts added to the capital by selling the banks’ real estate and their affiliates’ shares was exempted from corporate taxes. A Central Bank communiqué regarding the remuneration of the required reserves was issued on August 8, 2001. With this communiqué, the Central Bank declared that the required reserves is held against TL denominated deposits would be remunerated to reduce the banks’ funding costs. Furthermore, a new law aiming to strengthen the privately owned banks’ capital, namely “The Law on Restructuring Debts to the Financial Sector and Changes in Several Laws” was passed by the Parliament on January 31, 2002. The main objective of this Law was to enable the Undersecretariat of the Treasury to provide privately owned banks with long-term capital support. To encourage mergers and takeovers of banks and their affiliates, a new tax exemption was introduced. The results indicate that the tax exemption policy has been considerably effective in inducing bank mergers, which 11 banks are merged6.
2.2. MAIN FEATURES OF THE TURKISH BANKING SYSTEM
Before the financial crises of November 2000, and February 2001, the operations of state-owned banks resulted in a significant deterioration of their balance sheets. Among these operations, the most important loss generating one was the preferential loan extension by the state-owned banks to the agricultural sector, and small and medium size firms. The losses resulting from these operations were not compensated for in time. Furthermore, political interventions, over employment
and over branching fostered the deterioration of the balance sheets of the state-owned banks.
Using resources inefficiently together with the deterioration in the balance sheets of the state-owned banks, the liquidity needs of these banks are increased to unprecedented levels. As the state-owned banks had to finance their increased need for liquidity at increased market interest rates, their balance sheets deteriorated further.
Also, privately owned banks started the year 2000 with significantly weakened balance sheets. Although the economic growth induced by the disinflation program contributed to the profitability of banks and improved their balance sheets, currency and maturity mismatch significantly increased for the banks taking positions in line with the disinflation program targets. The increased risks taken by these banks came true due to sharp increases in interest and foreign exchange rates during the financial crises of November 2000, and February 2001 when banks bet on continued pegged exchange rate but the Central Bank of Turkey did not have reserves.
2.2.1. The Structure of Assets
When we look at the balance sheets of Turkish banks in Appendix C, total assets of the banking sector increased by 14 percent in USD terms and reached USD 133.5 billion at the end of 1999. Total assets of the sector by the end of 2000 grew by 16 percent compared to the previous year-end and reached USD 155.2 billion. As shown in Figure 2.1, the ratio of total assets to GNP increased from 69 percent to 92 percent in 1999, whereas the ratio of total assets to GNP decreased from 92 percent to 82 percent in 2000. Total assets decreased by 26 percent in dollar terms to USD 115 billion and the ratio of total assets to GNP was 93 percent at the end of 2001.
Figure 2.1 Total Assets of the Banking Sector and the Ratio of Total Assets to GNP. SOURCE: The Banks Associations of Turkey (BAT) http://www.tbb.org.tr/.
2.2.2. The Structure of Liabilities
As seen in the balance sheets of Turkish banks in Appendix C, total deposits grew by 16 percent having a 67 percent share in total liabilities in 1999. The growth rate was 18 percent in TL deposits, 14 percent in FX deposits. Share of non-deposit funds in the balance sheet total increased due to a rise of funds from abroad.
In 2000, the share of total deposits in total liabilities was 66 percent. The share of non-deposit funds in balance sheets increased due to the increased foreign borrowing facilities. The share of FX liabilities in total liabilities decreased by 2 percentage points to 46 percent and the share of FX assets decreased by 3 percentage points to 35 percent. The difference between the FX assets and FX liabilities increased from USD 13 billion to USD 17 billion.
In 2001, total deposits grew by 71 percent, and their share in total liabilities increased by 4 percentage points to 70 percent. FX deposits grew substantially, reaching 42 percent share in total liabilities. Meanwhile, funds borrowed from abroad fell from USD 16.3 billion to USD 8.4 billion.
T otal A ssets(U SD B illion)
40 60 80 100 120 140 160 180 90 91 92 93 94 95 96 97 98 99 00 01 40 50 60 70 80 90 100
2.2.3. Concentration in Banking System
At the end of 1999, the shares of the largest five banks and largest ten banks increased in terms of both assets and loans. However, in terms of deposits, the share of the largest five banks increased, while that of the largest ten banks declined. As of total assets, the share of the largest five banks was 46 percent, and that of the largest ten banks was 68 percent in 1999. At the end of 2000, the shares of largest five and the largest ten banks in total assets increased. The share of the largest five was 48 percent and the share of largest ten was 69 percent out of total assets. There was only one bank with an asset size larger than USD 20 billion and 4 banks with asset sizes larger than USD 10 billion. At the end of 2001, the share of the first five largest banks was 56 percent in total assets, 55 percent in total deposits and 49 percent in total loans. The shares for the ten largest banks were 80 percent each for assets and deposits and 82 percent for loans.
As a result of the decrease in the number of banks operating in the banking system, the shares of both the first “five and ten” largest banks increased considerably. Those alterations are presented in Table 2.1:
Table 2.1
Concentration in Banking Sector (percentage)
1990 1995 1997 1998 1999 2000 2001 Largest Five T. assets 54 48 44 44 46 48 56 T. deposits 59 53 47 49 50 51 55 T. loans 57 50 46 40 42 42 49 Largest Ten T. assets 75 71 67 68 68 69 80 T. deposits 85 73 70 73 69 72 80 T. loans 78 75 72 73 73 71 82
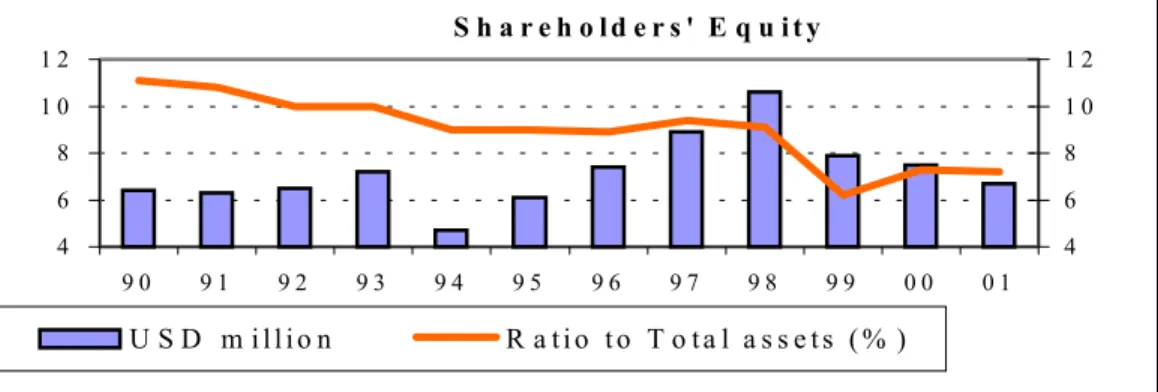
2.2.4. Shareholders' equity
At the end of 1999, shareholders’ equity including the current year net income was USD 7.9 billion, as shown in the balance sheets of Turkish banks in Appendix C. At the end of 2000, the shareholders’ equity including the current year income decreased by 5 percent to USD 7.5 billion in dollar basis. At the end of 2001, the shareholders' equity (excluding previous year income and current year income) decreased by 10.5 percent in dollar terms to USD 6.7 billion.
The ratio of shareholders’ equity to total assets declined from 8.9 percent to 5.9 percent as shown in Figure 2.2 in 1999. The ratio of shareholders’ equity to total assets is 7.3 percent for the sector in 2000. The ratio of shareholders' equity excluding total income to total assets decreased by 1 percentage point to 6 percent, while the ratio of shareholders' equity including total income to total assets decreased by 0.3 percentage points to 7.2 percent in 2001.
Figure 2.2 Shareholders’ Equity Ratios to Total Assets
SOURCE: The Banks Associations of Turkey (BAT) http://www.tbb.org.tr/.
2.2.5. The Structure of Income
As seen in the income statements of Turkish banks in Appendix C, in 1999, the banking sector had a loss of USD 566 million resulted from the losses of the banks taken into the Fund. The losses of the banking sector were USD 4.7 billion.
S h a r e h o l d e r s ' E q u i t y 4 6 8 1 0 1 2 9 0 9 1 9 2 9 3 9 4 9 5 9 6 9 7 9 8 9 9 0 0 0 1 4 6 8 1 0 1 2 U S D m i l l i o n R a t i o t o T o t a l a s s e t s ( % )
The net income of the profitable banks has increased by 14 percent to USD 4.2 billion.
The loss of the banking system in 2000 amounted to USD 4 billion arising mainly from the losses of the banks in the Fund. The loss of the system was USD 7 billion. If only the banks that declared profits are considered, net profit decreased by 30 percent to USD 2.9 billion.
By the end of December 2001, the total income of only profit-making banks increased by 10 percent in TL terms and decreased by 50 percent in dollar terms. Net income (after deducting the losses) increased by 64 percent in TL terms (decreased by 24 percent in dollar terms) and amounted to USD -3,570 million.
2.2.6. Off-balance Sheet Accounts
By looking at the aggregated off-balance sheet account of Turkish banks in Appendix C, in 1999, off-balance sheet transactions continued to grow rapidly through foreign exchange and interest rate transactions. Growing by 32 percent off-balance sheet transactions reached USD 138 billion exceeding total assets for the first time. Foreign exchange and interest rate transactions constituted 57 percent of the off-balance sheet transactions.
In 2000, off-balance sheet growth continued resulting basically from the growth in FX and interest rate transactions. Off-balance transactions grew by 13 percent in dollar basis and reached USD 156.5 billion resulting in the November 2000 crisis.
In 2001, the value of off-balance sheet declined by 16 percent in TL terms and by 61 percent in dollar terms. The TL off-balance sheet accounts fell by 29 percent and the FX off-balance sheet accounts by 8 percent in TL terms. The amount of guarantees and warranties has increased by 50 percent, while commitments and
FX and interest rate transactions decreased by 10 percent and by 45 percent respectively. Repo transactions decreased from TL 14,053 trillion to TL 10,854 trillion. The repo transactions with non-financial institutions has increased by 1 percent to TL 5,942 trillion, while the repo transactions with the Central Bank fell by 95 percent to TL 238 trillion.
2.2.7. Change in the Number of Banks, Employees and Branch Offices
At the end of 1999, there were 81 banks operating in the Turkish banking sector. Of these, 62 were commercial banks, and 19 were development & investment banks. Of the commercial banks, 4 were state-owned, 31 were privately owned 19 were foreign banks, and 8 were banks in the Fund. Of the development & investment banks, 3 are state-owned banks, 13 are privately owned banks, and 3 are foreign banks. As of 1999, the number of branches increased by 321 to 7,691 and the number of employees rose by 7,496 to 173,988.
There were 79 banks in operation in the Turkish banking system by the end of 2000. 61 of them were commercial and 18 of them were development & investment banks. 4 of the state-owned banks were commercial, 28 of them were privately owned and 18 were foreign. 11 banks were administered by the Fund. 5 of the foreign banks were founded in Turkey and the rest had branches in Turkey for their operations. 3 of the development & investment banks were state-owned, 12 of them were privately owned and 3 were foreign.
During the year 2001 period, administrations of 8 privately-owned banks were taken over by the Savings Deposit Insurance Fund7. The number of banks operating in the system decreased from 79 to 61, while total number of branches
declined to 6,908 decreasing by 930 and the number of employees decreased by 19 percent to 137,495.
By the end of 2001, the number of commercial banks fell by 15 and the number of development & investment banks decreased by 3 compared by the end of 2000, and the total number of banks declined to 61. The number of branches in the system decreased by 929 mainly because of the restructuring in the state-owned banks and private banks and because some of the banks under the management of Fund were liquidated. 918 of these branches belonged to commercial banks. During 2001 there was a noticeable increase in the number of branches of the foreign commercial banks. The number of employees continued to decline in 2001 by 32,906 following a fall of 3,587 in 2000. By December 2001, 96 percent of total employees were employed by commercial banks. 44 percent of the total worked in the state-owned banks, 47 percent in privately state-owned banks. All these alterations are presented in Table 2.2 and Table 2.3 respectively.
Table 2.2
Number of Banks and Branches in the System*
December 1999 December 2000 December 2001 Bank Branch Bank Branch Bank Branch
Commercial banks 62 7,660 61 7,807 46 6,889
State-owned 4 2,865 4 2,834 3 2,725 Privately-owned 31 3,960 28 3,783 22 3,523 Banks in Fund 8 714 11 1,073 6 408 Foreign banks 19 121 18 117 15 233
Dev. & inv. Banks 19 31 18 30 15 19
State-owned 3 12 3 11 3 4
Privately-owned 13 16 12 16 9 12
Foreign banks 3 3 3 3 3 3
Total 81 7,691 79 7,837 61 6,908
* Branches in Turkish Republic of Northern Cyprus and other countries are included. SOURCE: The Banks Associations of Turkey (BAT) http://www.tbb.org.tr/.
Table 2.3 Number of Employees December 1999 December 2000 December 2001 Commercial banks 168,558 164,845 132,274 State-owned 72,007 70,191 56,108 Private 76,386 70,954 64,380 Banks in Fund 15,980 19,895 6,391 Foreign banks 4,185 3,805 5,395
Dev. and inv. Banks 5,430 5,556 5,221
State-owned 4,336 4,456 4,322
Private 1,027 1,021 822
Foreign banks 67 79 77
Total 173,988 170,401 137,495
SOURCE: The Banks Associations of Turkey (BAT) http://www.tbb.org.tr/.
2.3. LEGAL AND ADMINISTRATIVE REGULATIONS
Until September 2000, the Undersecretariaty of Treasury, the Central Bank and the Capital Market Board have been the three main regulatory bodies in the financial sector. Treasury was responsible for regulation and on site supervision. However, the new Banking Law8 authorizes the Banking Regulation and Supervision Agency (BRSA) as regulatory body of the Turkish Banking Sector. The new Banking Law was approved by the Parliament in June 1999. The new Law aiming at strengthens the banking sector and to improve the supervision standards in line with international norms, established the BRSA, which has administrative and financial autonomy. The Board issues regulations and communiques as a regulatory procedure, with the resolution of the Board, shall have the same promulgated in the Official Gazette and put into force, and direct their implementation.
2.3.1. Significant Changes in the Banking Law
The minimum capital stipulated for establishing a bank or opening a branch of a foreign bank in Turkey was increased to TL 20 trillion. Moreover, to gain access to the system, a sum amounting to 10 percent of the minimum capital will be deposited with SDIF while establishing a bank. The limitation to 10 branches was abolished. BRSA was entrusted with the establishment of procedures on opening branches.
The total amount of direct or indirect loans to be extended to real or legal persons by a bank was limited to 25 percent of its own funds. Moreover, the definition of credit was expanded to include future transactions, option contracts and other similar derivative products. In order to impose restrictions on the participation of banks in partnerships other than with finance institutions, such participation was limited to a maximum of 15 percent of the bank’s own funds, while total participation cannot exceed 60 percent. With regard to the said regulation, banks are granted a transition period until 2009.
The new banks act has, for the first time, introduced an expanded definition of credit according to EU standards. Credit extended by a bank to real or legal persons at the amount of more than 10 percent of the bank’s own funds and accepted bill guarantees and bails were recognized as large loans and limited to eight times the bank’s own funds. If an individual, directly or indirectly, claims ownership of 10 or more percent of a bank's shares, or if the shares of a bank owned by a partner exceed 10 percent, 20 percent, 33 percent or 50 percent of the banks' own funds, or share transfers result in the drop of a partner’s shares below the above percentages, such transactions shall be subject to the consent of BRSA.
The judicial and personal responsibilities of bank owners who have misused bank resources and of bank executives who have acted against the Banks Act were explicitly defined. Penalties were introduced to deter such misconduct. This law established a new penalty system. Accordingly, banks that fail to observe the provisions of the law shall be subject to administrative fines to be decided on by BRSA. At the same time, prior to the exacting of a fine in administrative matters, banks were granted with the right of defense, thus allowing such matters to be settled through BRSA decisions.
CHAPTER 3
LITERATURE REVIEW
The economic theory of the firm assumes that production takes place in an environment where managers attempt to maximize profits by operating in the most efficient manner possible (Fare, Grosskopf and Lovell, 1985). The competitive model also implies that ones that are more efficient do so will drive firms, which fail to from the market. However, when natural entry barriers or regulation reduces the degree of competition, inefficient firms could continue to prosper (Evanoff and Israilevich, 1991). Knowledge of cost functions is important for optimal decision-making by banks and regulatory bodies. It is also said that an understanding of short-run costs is important for pricing and output decisions, while long-short-run costs provide useful information for planning growth and investment policies of banks.
Cost economics of banking considers three main characteristics: Scale, scope, and density economy. Scale economy refers to the relationship between changes in cost and changes in outputs when all other factors are constant. Scope economy refers to the relationship between the cost and production of different numbers of outputs when all other factors are constant. Overall economies of scope are measured as the percentage cost savings from producing all outputs jointly as opposed to producing each output separately. Density economy refers to the relationship between changes in cost and changes in number of branches when all other factors are constant (Altunbaş and Molyneux, 1996).
The cost function approach has been widely used to model the technology of a firm operating in regulated environments, such as the banking industry. Outputs of
banking firms are assumed exogenous. Since input prices are also deemed exogenous under the competitive factor market assumptions, we can obtain consistent parameter estimations by using flexible cost function form. However, a problem associated with estimating cost functions is that it is assumed that banks are operating in an efficient manner. In other words, the only error in this type of methodology is noise and possible model misspecification (Beckers and Hammond, 1987).
The bank efficiency can be decomposed into scale efficiency, scope efficiency, pure technical efficiency, and allocative efficiency. The bank has scale efficiency when it operates in the range of constant returns to scale. Scope efficiency occurs when the bank operates in different diversified locations. When the bank maximizes the output from the given level of input, pure technical efficiency occur. Allocative efficiency happens when the bank chooses the revenue maximizing mix of outputs. Theoretically, a bank is fully efficient if it produces the output level and mix that maximize profits and minimize possible costs. However, in reality, most banks are not fully efficient. There are a number of sources of inefficiency in the banking industry. A professional note from Berger asserts that the most important origin of cost problems in the banking industry is X-efficiency9 or differences in managerial ability to control costs for any given scale or scope of production10. They also mentioned that on average, banks’ costs were about 20% above the efficient frontier. This means that a bank, on average, has costs around more than 20 % more than a “best-practice” bank producing the same products. Most of the sources of the inefficiencies are caused by inappropriate operation, like excessive use of labor in branch offices, and financial inefficiency, such as excessive interest paid for funds.
9 X-efficiency is defined as the ratio of the minimum costs that could have been expended to produce
a given output bundle to the actual costs expended.
3.1 EFFICIENCY STUDIES ON THE TURKISH BANKING INDUSTRY
Studies on the efficiency of Turkish banking industry began in the late 1980’s. Those studies were focusing mainly on investigating the effect of liberalization policies. Recent studies by Özkan-Günay (1996, 1998), Mahmud and Zaim (1998), Yıldırım (1999), and Mercan and Yolalan (2000) concluded that liberalization increased efficiency in the industry. However, studies sometimes reached very different conclusions. For instance, Yolalan (1996), Özkan-Günay (1997), Emir (1999), Mercan and Yolalan (2000), and Çıngı and Tarım (2000) found that state-owned banks were more inefficient than privately owned, whereas Zaim (1995) and Denizer, Dinç and Tarımcılar (2000) claimed that state-owned banks were no less efficient than their private counterparts were. Those divergent results may be attributed to differences in methodology, as well as differences in data sets used in the different studies.
In a very recent study, Işık and Hassan (2002) investigated input and output efficiency in Turkish banking industry, focusing on the impact of size, international variables, ownership structures and other variables. Their results suggest that heterogeneity in bank characteristics have significant effects on their measured efficiencies. They performed their analysis by estimating three separate annual efficiency frontiers for the years 1988, 1992 and 1996. They summarized their results for both separate and pooled frontiers for national and foreign banks, after failing to reject the null hypothesis of homogeneity across the domestic/foreign distinction. In Mahmoud and İnanoğlu’s paper (2002), they modeled unobservable heterogeneity in banking technologies as a mixture model and investigated the efficiencies of 53 Turkish banks using likelihood-based stochastic frontier analysis for the period 1990-2000. They concluded that they did not find evidence of heterogeneity between
state-owned and privately state-owned banks. They also found no evidence that special finance houses used a different technology compared to conventional banks.
Jackson and Fethi (2000) evaluate the technical efficiency of individual Turkish banks using the DEA and investigate the determinants of efficiency using the Tobit model for the year 1998. The procedure was similar to Jackson, Fethi and İnal (1998). The results of these studies show that larger and more profitable banks are more likely to operate at higher levels of technical efficiency.
In the background of these different studies on Turkish banking industry, this study seeks to analyze the costs and cost economies involved in the banking sector. In addition, more importantly, those analyses are applied to the Turkish banking industry for estimating the cost function of the Turkish banking industry and OYAKBANK.
CHAPTER 4 METHODOLOGY
Cost functions have been the subject of a significant amount of investigation in the financial industry and the reasons specified by Benston (1972) are as follows: 1. Regulation: Entry, merger, branching and some prices in the finance industry are
regulated, requiring regulators to estimate the cost consequences of their decisions.
2. Importance to the finance industry: If firms understand their costs better, they may be more efficiently managed and make decisions more rationally.
3. Economic understanding: Knowledge of the relationship between cost and output is basic to microeconomics and industrial economies. Study of the finance industry should provide empirical estimates that are relevant to theory.
The cost function is derived from the production function, which describes the available efficient methods of production in one period. Diewert (1992) indicates that the use of the cost function has an advantage over the production functions in that statistical estimation of the unknown parameters is simpler. In addition, the cost function parameters, which characterize production technology, can be estimated much more accurately using various cost function techniques. Furthermore, cost data is more readily available.
Simply total cost is a multivariable function, which is determined by many explanatory factors. Where total cost is determined as the sum of expenditures on all inputs, however, the value of cost can be specified as a function of the level of output and the prices of all inputs. In the case of a commercial bank, we can show that the bank’s total cost which is the sum of quantities of inputs employed, X = (x1, x2,...,
xn), multiplied by their factor prices, P = (p1, p2,..., pn). Specifically, the total cost, say TC, of producing output is simply as follows:
TC = p1L + p2E + p3DFX + p4DTL + p5DB
where p1, p2, p3, p4 and p5, are the input prices for labor, equity, deposits on foreign exchange, deposits on Turkish Lira and debt respectively. L, E, DFX, DTL and DB are the quantities of inputs where L is labor, E is equity, DFX is deposits on foreign exchange, DTL is deposits on Turkish Lira and DB is debt.
The total cost of service for a commercial bank can be shown as TC (Q, P), where Q is an m-dimensional vector of output quantities and P is an n-dimensional vector of input prices. Provided that TC satisfies regulatory conditions (that is, non-negative, real valued, non-decreasing, strictly positive for non-zero Q) it is said to be dual to the production function, which can be written as f: f (X), where X is an n-dimensional vector of input quantities.
4.1 THE EFFICIENCY CONCEPT
Efficiency is very important for banks in a competitive environment including commercial banks in Turkey. Efficient and effective utilization of resources is key objectives of every banker. Increasing competition for financial services, technological innovation and banking consolidation are all focusing more attention on controlling costs in banking and providing services and products efficiently. Efficiency is estimated using a number of efficiency concepts including production and cost. Productive efficiency is derived as the distance a commercial bank has from the ‘optimal’ or ‘best practice’ bank existing on a production function. This hypothesized ‘best practice’ bank is defined with reference to all the
commercial banks in the sample set11. Productive efficiency is therefore limited in its extent to considering the amount of input quantity of output. This form of efficiency is commonly termed productive or technical efficiency.
Cost efficiency estimates how far the production costs of a commercial bank differs from the production costs of a best practice bank or bank operating under the similar conditions and producing the same outputs. This measure is defined with reference to a cost function constructed from the observations of all commercial banks considered within the sample set, which this study is applied on that way. The cost function assumes that total production costs of individual commercial banks are dependent on the price of variable inputs, such as equity, labor, deposit and debt, the quantity or value of output produced, random error and any other additional variables accounting for the environment or particular circumstances of individual commercial banks. The cost function of Turkish banking industry in this study allows for the measurement of the least cost proportions of inputs in terms of input prices. These frameworks enable the consideration of the optimal proportion of inputs in terms of input prices for all commercial banks including OYAKBANK. Cost reduction and income improvement are now major managerial challenges and targets for all banks.
OYAKBANK can use estimation results of this study for those reasons. Firstly, it is easily deemed preferable to view efficiency in its broadest sense, incorporating both productive and allocative efficiency. Secondly, all banks in Turkey and in the world emphasize the management of costs that can be seen a substantial information. Molyneux, Altunbaş and Gardener (1996) indicates that a study by Salomon Brothers suggested ‘...cost management was now a dominant strategic theme throughout the banking world...’. This study also drew attention to
the noticeably differentiated cost/income ratios of banks in different markets, which is partly a result of diverse approaches to cost management by banks in different countries and often within countries.
4.2. TRANSLOG COST FUNCTION MODEL
We estimate efficiency of banks using cost minimization framework, in which each commercial bank is assumed to minimize the cost of producing a given level of output. A translog cost function is selected for our purpose. The translog function is one of the families of flexible function, which may be interpreted either as an exact function or as an approximation to arbitrary function by Taylor’s series expansion up to second degrees. The translog cost function is flexible in that it places no a priori restriction on its own structure and the structure of production process (Diewert, 1982 and Lau, 1986).
The translog cost function form permits the estimation of U-shaped average cost curves. A bank’s average cost reflects the value of resources it uses in producing one unit of output. The average cost of each bank can be divided into two components: the minimum average cost at which banks of the same size and bank’s excess cost per unit of output over this minimum average cost. The technical efficiency of a bank equals the first component of its average cost, and a bank’s operational efficiency equals the second component.
Banks that produce at combinations of average cost and output on the long-run average cost-curve, such as banks A and B in Figure 4.1, have maximum operational efficiency. In the range of output in which the long-run average cost curve has a negative slope, larger banks are technically more efficient than smaller banks. Conversely, in the range of output in which the long-run average cost curve has a positive slope, smaller banks are technically more efficient than larger banks (Kalish and Gilbert, 1973). Thus in Figure 4.1, bank B is technically more efficient than bank A. Bank C is operationally inefficient because it produces the same level of output as bank B put but at higher cost. However, bank C is technically more efficient than bank A since bank C is capable of producing at lower average cost of if operated efficiently. Only the banks in the sample with the lowest average cost at each level of output should influence the position of the estimated cost curve. A line connecting the average cost of the low cost banks, called frontier banks, forms the frontier cost curve. Frontier banks and frontier cost curves have the following characteristics: •A LAC Average Cost •C
•
B Bank OutputFrontier banks have the lowest average cost at their output levels of the banks in the sample,
The frontier cost curve, formed by connecting the average cost of adjacent frontier banks with straight lines, must be convex,
No banks in the sample have average cost that lies below the frontier cost curve, which is impossibility.
The main approach is the estimation of translog flexible form of the cost function together with proper restrictions and share equations. The translog cost function allows use of multioutput production that is extremely important in banking industry. Implicitly, cost function is the form TC = C (Q, PL, PE, PDFX, PDTL, PDB) and in more general form it is TC = C (Q, P), where Q is the vector of outputs, P is the vector of factor prices. The second order translog approximation is expressed as
l
nTC =
α
0+ Σ
iα
il
nP
i+ ½ Σ
ijγ
ijl
nP
il
nP
j+ α
Ql
nQ + ½ γ
QQ(
l
nQ)
2+ Σ
iγ
iQl
nP
il
nQ
(4-1)where i = L, E, DFX, DTL, DB and L is the price of labor, E is the price of equity, DFX is the price of deposits on FX, DTL is the price of deposits on TL and DB is the price of debt for the inputs of model. For a cost function to be well behaved among other things it must be homogeneous of degree 1 in prices, given Q. This implies the following parametric restrictions on the equation (4-1).
Σ
iα
i= 1Σ
iγ
ij= 0 (∀
j)Σ
iγ
iQ= 0 (∀
i)For the translog cost function to be homothetic this is necessary and sufficient. Homogeneity of a constant degree in output occurs if, in addition to these
homotheticity restrictions. The following symmetry condition is also imposed on the cross partial derivatives:
γ
ij=γ
jiA number of additional parameter restrictions can be imposed on the translog cost function, corresponding with further restrictions on the underlying technology.
γ
QQ = 0; in this case the degree of homogeneity equals 1/α
Q. Constant returns toscale of the dual production function occurs when, in addition to the above homotheticity and homogeneity restrictions,
α
Q= 1.Equation (4-1) can be estimated directly, but the optimal, cost-minimizing input demand equations are transformed into the cost share equations for providing efficiency. According to Shephard’s Lemma (Shephard, 1953), the derived demand for an input Xi is obtained by partially differentiating the cost function with respect to the factor price of input i. Using Shephard’s Lemma and partially differentiating the translog expression of the cost function with respect to factor prices, the following set of factor shares are obtained:
d
l
nTC / d
l
nP
i=
S
i=
α
i+Σ
jγ
ijl
nP
j+γ
iQl
nQ
(4-2)
where Si = Pi Xi / TC is the share of costs accounted for by the input i. Since the coefficients in the share equations are subset of those in the cost equation, the share equation is used in conjunction with the translog expression of the cost function to obtain more efficient estimates of the translog parameters. However, since
Σ
iS
i = 1, the factor share equations are not linearly independent. Therefore, one of the shareequations must be dropped in the estimation, for instance,
S
j = 1 -Σ S
i where i,j = 1,...,n, but i≠j.The translog cost function shown in equation (4-1) must have the following properties if production and cost function theories are to be fully integrated. Jorgenson (1986) notes that the function must have:
1. Homogeneity : The cost function TC defined by equation (4-1) is homogeneous of degree one in the input prices.
2. Cost exhaustion : The sum of cost shares is equal to unity. Cost exhaustion requires that the value of the i input is equal to total cost.
3. Symmetry : A necessary and sufficient condition for symmetry is that the second-order outputs and inputs parameters must be symmetric, that is, for instance, in the cost function defined in equation (4-1),
δ
ij =δ
ji for 1< i, j < m, andγ
ij =γ
ji for 1< i, j < n, respectively.4. Non-negativity : The cost shares and the cost elasticity must be non-negative. Since the translog cost function is quadratic in the logarithms of input prices and the output levels, we cannot impose restrictions on the parameters that indicate non-negativity of the cost shares and the cost elasticity.
5. Monotonicity : The cost function is increasing in the input prices and in the level of output.
4.3. LIMITATIONS OF THE TRANSLOG COST FUNCTIONAL FORM
The translog cost functional form usually gives poor approximations to the true underlying cost function as one move away from the point of approximation (Barnett and Lee, 1985). The statistical methodology, which depends on extrapolating a local approximation to fit globally, may behave poorly when the global behavior of the function differs from its local behavior. Thus, in its application, the translog cost functional form is potentially subject to misspecification (McAllister and McManus, 1993; Lau, 1986).
A major problem involving the ordinary translog cost functional form arises when one computes measures of product-specific economies of scale and global economies of scope. One of the desired characteristics of a multi-product cost function is that it allows one or more outputs to be zero (Caves, Christensen and Tretheway, 1980). In the ordinary translog cost functional form, however, all of the outputs enter in logarithmic form; thus, the function has no finite representation if any output has a zero value. Baumol, Panzar and Willig (1988) note that the cost functional form should yield a reasonable cost figure for output vectors that involve zero outputs of some products. To remedy this drawback the ordinary translog cost functional form can be modified in order to redefine zero outputs. Simply, the logarithm of the output is replaced by using Box-Cox’s (1964) transformation in the translog cost function. The resulting functional form, the hybrid translog cost function, was suggested by Caves, Christensen and Tretheway (1980) as a generalization of the translog function. The translog cost functional form also has a large number of parameters (Diewert, 1992) which may result in multicollinearity between explanatory variables in estimations. Moreover, Guilkey and Lovell (1980)
criticize the translog form by showing, with a Monte-Carlo simulation, that the translog cost function slightly overstates economies of scale and that the simultaneous estimation (SUR) of the translog cost function, together with input share equations, does not achieve better results relative to single equation estimation.
Although there are possible limitations, the translog cost functional form remains attractive to other functional forms. There are a number of criteria have evolved and developed over the years why the translog cost function remains attractive to others. We can group them into five categories:12
1. Theoretical consistency: This means that the functional form chosen must be capable possessing the theoretical properties required of the cost function of a cost-minimizing bank.
2. Domain of applicability: This refers to the set of values of the independent variables over which algebraic functional satisfies all the conditions for theoretical consistency.
3. Flexibility: This refers to the ability of the functional form to approximate arbitrary but theoretically consistent behavior through an appropriate choice of parameters.
4. Computational facility: The cost function should not imply estimation of the values of an excessive number of parameters.
5. Factual conformity: This implies consistency of the functional form with known empirical facts.
Baumol, Panzar and Willig (1988) also show that the translog cost function has been employed in empirical studies of bank costs.
12 See Lau, L. J., 1986, “Functional Forms in Econometric Model Building”, Chapter 26 in Griliches,
Z. and Intriligator M. D. (eds), Handbook of Econometrics, vol. 3, (Amsterdam: North-Holland), 1515-1552.
CHAPTER 5
ESTIMATION OF THE COST FUNCTION THE TURKISH BANKING INDUSTRY AND OYAKBANK
The main purpose of this study is to estimate the cost function of the Turkish banking industry with the translog cost functional form. In addition, this study falls short in explaining the position of OYAKBANK relative to the industry. While the underlying economic theory of cost and production emphasizes the joint nature of input demand decisions, econometric implementations of this interdependence typically involve simultaneous estimation of parameters in systems of factor demand equations having cross-equation constraints. The econometric technique employed in this study; deal with estimation of parameters in system of equations. A system is a group of equations containing unknown parameters. Systems of equations can be estimated using a number of multivariate techniques that take into account the interdependencies among the equations in the system. The general form of
where yt is a vector of endogenous variables, xt is a vector of exogenous variables and εt is a vector of possibly serially correlated disturbances. I pool all data for all necessary banks for all time available and estimate by Iterative Seemingly Unrelated
. . . . . . . . . . . . ... ... ... 3 2 32 1 31 3 2 2 22 1 21 2 1 2 12 1 11 1 t t t x a x a y x a x a y x a x a y ε ε ε + + = + + = + + =
Regression13 with Eviews4.0. This iterative Zellner-efficient estimator is typically termed IZEF, and in banking cases it yields parameter estimates that are numerically equivalent to those of the maximum likelihood (ML) estimator14.
5.1. DATA
The banking data set used in the model is compiled from annually information banks supply in their Reports of Balance Sheet, in the Report of Income and the Report of Condition publications of the Banks Association of Turkey (BAT)15, which are presented in the Table 5.1. This cost model looks at the cost expenditures of banks as function of selected variables thought to influence the cost structure of banks.
The cost function was estimated for 20 banks16 in the Turkish banking industry over the period from December 1999 through December 2001 and the data information of each bank included in the estimation is annual. Every bank was included in the estimation as long as it had been in existence since January 1999, remained in existence until December 2001, and reported all the information needed for the cost efficiency model annually to the Banks Association of Turkey. The cost function was estimated for OYAKBANK over the period from December 1990 through December 2001. All data information of OYAKBANK in the estimation is annual, too. This period analysis of banking costs helps to ensure that the model is identifying long-run cost differences between banks rather than short-run anomalies. It also helps to capture the period before the disinflation program began and liquidity
13 This estimation method is Zellner’s seemingly unrelated estimator, often shortened to ZEF and also
called the seemingly unrelated regression estimator (SUR) or the minimum chi-square estimator.
14 For a proof of this result, see Oberhofer and Kmenta (1974).
15 See an example of balance sheet and income statement of a bank used to compile data set for the
study in Appendix C.
crisis period. All data needed for estimation is available and the whole analyses could be applied in the model.
5.2. VARIABLES
A fundamental difficulty with analyzing banking technology and its characteristics is the specification of an appropriate measure of output. No consensus exists as to the precise definition of what a bank produces or how one can measure this product. Financial firms like banks, however, provide services rather than readily identifiable physical products, and it is not clear how to measure service outputs. The definition and measurement of bank output and costs in the empirical analyses vary between studies.
Even today, there is no all-encompassing theory of the banking firm and no agreement on the explicit definition and measurement of banks’ inputs and outputs. One of the main problems faced by researchers investigating banks’ costs relates to difficulties in the definition and measurement of the concept of bank output, mainly as a result of the nature and functions of financial intermediaries. The most debated issue regards the role of deposits; on the hand, it is argued that they are an input to the production process (intermediation and asset approach); on the other hand, it is suggested that deposits are an output (production approach), involving the creation of value added, and for which customers bear an opportunity cost (value added approach, user cost approach).
As suggested by Berger and Humphrey (1997), I model bank production following the intermediation approach17 for two reasons. They pointed out that,
17 In the intermediation approach to modelling bank production, banks borrow funds, which are
transformed into loan funds, which form the principal output from the system. The bank is assumed to use deposits as a raw material or intermediate product, which are then transformed into the final product.
although there is no ‘perfect approach’, the intermediation approach might be more appropriate for evaluating entire financial institutions because this approach is inclusive of interest expenses, which often account for one-half to two-thirds of total costs. Moreover, the intermediation approach may be superior for evaluating the importance of frontier efficiency to the profitability of financial institutions, since the minimization of total costs, not just production cost, is needed to maximize profits.
Table 5.2 shows mean values for all the variables considered in the model. For estimation of the cost function in the flexible translog form, we need first to determine the inputs, which are the price of equity, the price of labor, price of debt and finally the price of deposits. Probably the last factor is the most important for Turkish banking industry due to the very high interest paid on deposits in 1999 and 2001. I obtain the price of labor (PL) simply dividing the total expenses on labor (personnel costs) by the total number of employees. The price of equity (PE) is derived dividing dividends by the equity of banks. The price of deposits on Foreign Exchange (PDFX) is obtained by dividing interest expenses on Foreign Exchange to the total volume of deposits on Foreign Exchange. The price of deposits on Turkish Lira (PDTL) is obtained by dividing interest expenses on Turkish Lira to the total volume of deposits on Turkish Lira. I obtain the price of debt (PDB) simply dividing the interest on non-deposit funds and other interest expenses to the total funds borrowed from other financial institutions. In an attempt to determine the extent sensitivity of the output elasticity of cost to the definition of output, total cost of banks are constructed as output in the model.