birpublications.org/dmfr
ReseaRch aRticle
evaluation of temporomandibular joint, masticatory muscle, and
brain cortex activity in patients treated by removable functional
appliances: a prospective fMRi study
1Orhan Ozdiler, 2,3Kaan Orhan, 4Emre Cesur, 1Ayşegül Köklü and 5Oktay Algın
1Department of Orthodontics, Faculty of Dentistry, Ankara University, Ankara, Turkey; 2OMFS IMPATH Research Group,
Department of Imaging & Pathology, Faculty of Medicine, University of Leuven and Oral &Maxillofacial Surgery, University Hospitals Leuven, Leuven, Belgium; 3Department of Dentomaxillofacial Radiology, Faculty of Dentistry, Ankara University,
Ankara, Turkey; 4Department of Orthodontics, Medipol Mega University Hospital, İstanbul, Turkey; 5Department of Radiology,
Faculty of Medicine, Yıldırım Beyazıt University, Ankara, Turkey
Objectives: The aim of this study is to evaluate the effects of functional orthodontic appli-ances on the masticatory muscles, temporomandibular joint (TMJ), and brain to determine whether using functional appliances full-time or only at night yields different results.
Methods: 16 patients with Class II malocclusion were included in this study. Eight patients were instructed to wear their appliances (monoblock/twinblock) full-time and the other eight patients were instructed to wear them at night while sleeping. An additional 10 patients with Class II malocclusion were later included as a pre-treatment control group. Signal intensity ratios (SIR) of TMJ structures and morphological evaluations of the masticatory muscles were done for all patients. Functional MRI (fMRI) data were also obtained from the patients while performing chewing and biting movements.
Results: ANB angle was reduced significantly in both the full-time and night wear groups, by values of 1.17° and 1.35°, respectively (p < 0.05). MRI showed that SIRs were significantly increased in both groups in the masticatory muscles, retrodiscal pad, condylar process, and articular disc (p < 0.05). Both resting and task-based fMRI evaluation revealed significant increases in blood oxygen level dependent signals in several regions of the brain in both groups (p < 0.05).
conclusions: The cephalometric and MRI findings of this study indicate that the treatment effects were similar for both wear schedules. Functional appliances should be regarded not as simple devices that treat Class II malocclusion through skeletal and dental correction alone, but as exercise devices that lead to neuromuscular changes by facilitating muscle adaptation and activating various brain regions.
Dentomaxillofacial Radiology (2019) 48, 20190216. doi: 10.1259/dmfr.20190216
cite this article as: Ozdiler O, Orhan K, Cesur E, Köklü A, Algın O. Evaluation of temporo-mandibular joint, masticatory muscle, and brain cortex activity in patients treated by removable functional appliances: a prospective fMRI study. Dentomaxillofac Radiol 2019; 48: 20190216. Keywords: functional orthodontic appliances; fMRI, masticatory muscle; cortex activity; TMJ introduction
Removable functional appliances have been used for many years to treat Class II malocclusions of mandib-ular origin by modifying the condyle–fossa relationship
and the activity of neuromuscular structures. Although condylar cartilage proliferation and increased mandib-ular length have been demonstrated with the use of appliances in animal studies, there is still no consensus
on their mechanism of action.1,2
Correspondence to: Kaan Orhan, E-mail: kaan. orhan@ uzleuven. be
Functional jaw orthopedics provides not only dental and skeletal corrections, but is also said to bring about morphological changes by training the patient in a new mode of function by actively engaging the central nervous system via stimulation of nerve receptors in the teeth, periodontium, muscles, and joints while the
appli-ance is in the mouth.3 In terms of changes in facial form,
not only physiological muscle function or dysfunction, but also the basal tone of opposing muscle groups is important. In order to assess the effects of muscle func-tion on dentofacial development in a biologically accu-rate way, they must be considered in conjunction with the central nervous system, which regulates and controls
muscle function.4
Petrovic and Stutzmann,5 stated that effective
appli-ance wear time varied based on their design and argued that appliances like hyperpropulsors, twin-blocks, and the Frankel Functional Regulator must be worn
full-time (FT). According to a study by Oudet and Petrovic,6
investigating the effects of postural hyperpropulsors on rats for 4 weeks, removing the appliances from the mouth resulted in signal interruption, reduced lateral pterygoid muscle activity, and a subsequent decrease in condylar cartilage growth rate. Therefore, FT wear is recommended to ensure that the achieved effect is not interrupted. According to a more recent study by
Frankel and Frankel,4 the muscle training and
repro-gramming necessary for neuromuscular adaptation is not possible when functional appliances are worn only at night.
MRI is a diagnostic method that uses a magnetic field and radio wave energy to visualize internal organs and body structures. MRI has become a widely used modality for imaging soft tissues in particular because the patient is not exposed to ionizing radiation and it enables high-sensitivity visualization of different tissue
densities.7 Functional MRI (fMRI) is used to measure
changes in brain activity based on blood flow.8 According
to this technique, cerebral blood flow is associated with neural activity. It is also predicted that blood flow will
increase in an area of the brain that is activated.9 The
measure of this phenomenon is called the BOLD (blood oxygen level dependent) signal.
Despite the many advantages of MRI (e.g. high contrast sensitivity, lack of ionizing radiation, demon-stration of changes in activity within tissues, ability to measure and create three-dimensional reconstructions of soft tissues, and utility in neurological examina-tion), research on its use in the field of orthodontics has generally been limited to the evaluation of condyle/disc position in the temporomandibular joint (TMJ) after
functional orthopedic treatment.10–12
The results of our previous study examining the effects of functional maxillary orthopedics on joints and muscles demonstrated that even in the early period, wearing these appliances on both FT and part-time (PT, night only) basis could lead to changes in masticatory
muscle size.13 This made us wonder what long-term
changes might occur in the cerebral cortex and in what regions with different wear schedules.
Therefore, our objective in the present study was to examine the cephalometric results of functional ortho-pedic appliance use as well as its effects on the masti-catory muscles, TMJ, and cerebral cortex in growing individuals with Class II malocclusion using MRI in order to determine whether FT and PT wear yield different outcomes.
Methods and materials
The study was approved by the Ankara University Faculty of Dentistry ethics committee (IRB approval number: 36290600/27). The patients’ first-degree rela-tives were informed about the study and provided written informed consent.
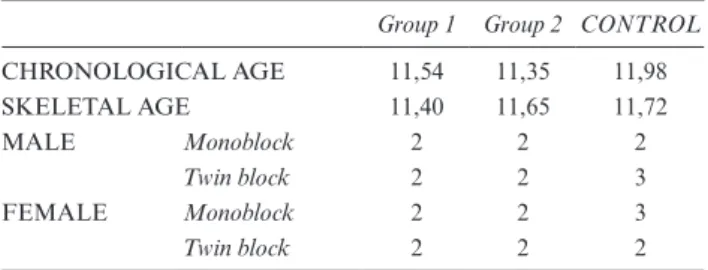
This study was conducted on a total of 64 radio-graphic images (32 cephalometric radiographs and 32 hand-wrist X-rays) as well as anatomical and functional MR images from 16 patients (8 males, 8 females) with Class II division one malocclusion obtained before using appliances (T0) and at the end of treatment (T1). The patients were randomly divided into two groups: patients in Group 1 were instructed to wear their appli-ances FT (full-day except during meals), while patients in Group 2 were instructed to wear their appliances PT (only at night while sleeping). Initially, the study included a total of 16 patients, 8 with FT wear and 8 with PT wear, and post-treatment data were collected at a mean of 14.8 months.
Due to inconsistencies in fMRI sequence acquisition at the beginning of the study, pre-treatment fMRI data obtained from the treatment groups could not be used. For this reason, a control group of 10 individuals with Class II malocclusion were included in the study and pre-treatment fMRI scans from these individuals were used for comparison. Mean age and sex distribution of the treatment groups and this control group are given in Table 1.
Inclusion criteria were as follows:
(1) Having skeletal and dental Class II malocclusion due to mandibular retrusion;
(2) Having an unaesthetic and inharmonious soft tissue table 1 Chronological and skeletal ages of subjects at start of treat-ment and distribution of appliances by sex in Group 1, Group 2, and the control group
Group 1 Group 2 CONTROL
CHRONOLOGICAL AGE 11,54 11,35 11,98 SKELETAL AGE 11,40 11,65 11,72 MALE Monoblock 2 2 2 Twin block 2 2 3 FEMALE Monoblock 2 2 3 Twin block 2 2 2
profile;
(3) Being in or near the period of maximum pubertal
growth according to hand-wrist radiographs;14,15
(4) Not requiring gradual mandibular activation for profile correction (<6–7 mm); and
(5) Having late mixed or permanent dentition.
All patients received a monoblock or twin-block appli-ance, with the twin-block preferred for patients requiring expansion of the maxillary dental arch and monoblock preferred for the other patients. The activators were constructed to achieve a Class I relationship between the molars and the canines. The vertical activation of the devices was adjusted to 3–4 mm above resting posi-tion. In the twin-block appliance, the upper and lower
acrylic plates interlocked at a 70° angle.16
Cephalometric evaluation
Profile distance X-rays were obtained using a Sirona Orthophos XG 5 DS/Ceph X-ray device under stan-dard conditions with the patients’ heads positioned so that the Frankfurt horizontal plane was parallel to the ground. Dolphin Imaging Software 9.0 (Los Angeles, CA) was used to obtain and evaluate the data. Eight measurements, four linear and four angular, were made
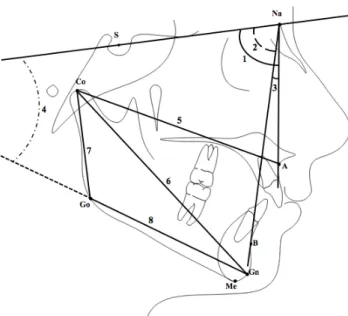
from the cephalometric films (Figure 1).
MRI evaluation
All MRI examinations were conducted at the National Magnetic Resonance Research Center (UMRAM) and the same protocol was used for all patients included in the study. Patients were not wearing their appliances at the time of MRI acquisition. Follow-up MRI (T1) was performed at a mean of 14.88 months. Patients are positioned in the supine position during the MRI proce-dures. Heads of the patients were fixed with cushions to minimize movement artifacts and disposable ear plugs were used to reduce the volume between sequences.
MRI was performed using a 3.0 T Magnetom Trio device (Siemens Medical, Germany) with a 32-channel
head coil. Anatomic structures were visualized in T1
weighted high-resolution images using the following acquisition parameters: TR (repetition time)=2000 ms, TE (echo delay time)=35 ms, slice thickness = 0.84 mm, flip angle = 12°, field of view (FOV) = 215 cm.
In this study, evaluations were based on two param-eters, signal intensity ratio (SIR) and muscle volume. Signal intensity refers to the intensity of BOLD signal associated with change in the activity or vascularity of a certain tissue, and is used to evaluate activity level in the tissue being examined. To measure volume, anatomic borders of the target muscle were marked in each region where it was visible and the areas within these borders were marked. The designated muscle regions were processed and reconstructed in a separate three-dimen-sional image using Synapse 3D software (Fuji, Japan). fMRI evaluation
Acquisition parameters for fMRI scans were as follows:
TR = 3000 ms, TE = 30 ms, voxel size = 9 mm3,
number of slices = 35, flip angle = 75°, FOV = 192 × 192 mm, matrix size = 64 × 64, and slice thickness = 3 mm. During the task-based fMRI procedure, chewing and biting sessions were performed using codes that were previously written in the MATLAB software. In the chewing session, an instruction reading “Make a chewing motion while moving your head as little as possible” was displayed for 20 s, followed by the instruc-tion “Remain moinstruc-tionless” for 12 s. In the biting session, the instruction on the screen read “Make a biting motion without moving your head” for 20 s and was followed by the command “Remain motionless” displayed for 12 s. These sets of commands were repeated 12 times in each session.
Images in DICOM 3.0 format were transferred to Freesurfer (v. 6.0.0, MGH, Boston, MA) software for morphometric analysis. After recon-all or pre-processing procedures (normalization, smoothing motion correc-tion, cortical parcellation) were completed, volume, thickness, and surface area values were obtained for the right and left hemispheres of the brain. Group compari-sons were made with the qdec function of the Freesurfer program. Based on the results of these comparisons, the groups’ dominant regions, names, and coordinate values
were determined. (Figure 2).
Figure 1 Cephalometric measurements. Skeletal angular
measure-ments (°): 1. SNA (the posteroinferior angle between anterior cranial
base and nasion-point A line), 2. SNB (the posteroinferior angle between anterior cranial base and nasion-point B line), 3. ANB (the angle between nasion-point A and nasion-point B lines), 4. GoGn/SN (the angle between anterior cranial base and the mandibular plane);
Skeletal linear measurements (mm): 5. Co-A (the distance between
condylion and point A; total maxillary length), 6. Co–Gn (the distance between condylion and gnathion; total mandibular length), 7. Co–Go (the distance between condylion and gonion; ramus length), 8. Go–Gn (the distance between condylion and gonion; corpus length).
All fMRI images were evaluated together by two experienced analysts blinded to the patients’ clinical status and a consensus was reached on the results. The signal intensity values in the images were calculated and compared statistically. Volume, thickness, and surface area values of the right and left hemispheres of the brain were obtained. Morphometric analyses were performed in the Freesurfer program (Freesurfer version 6.0.0, MGH, Boston, MA). Task-based fMRI images were analyzed in the FSL program (FMRIB Software Library 5.0, Analysis Group, Oxford, UK).
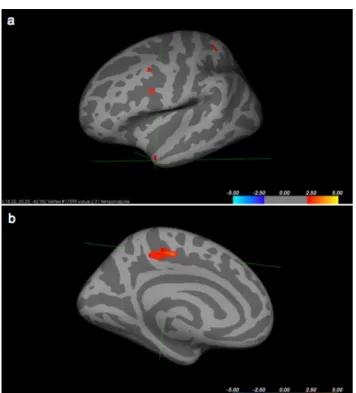
For task-based analysis, first-level analysis was run on each individual, followed by higher-level analysis. The cluster sizes, coordinates, and the relevant brain regions
were determined for observed activations (Figure 3).
Resting fMRI data were analyzed using 2D-BOLD (EPI) sequence data in DICOM format. After
pre-processing the data in the SPM 12 program (SPM12, Wellcome Department of Cognitive Neurology, London, UK), a general linear model (GLM) was first applied. This was followed by MELODIC analysis and dual regression, and based on the results, the cluster size, co-ordinates, and z-values of the spatial brain compo-nents that best matched were determined. The names of the brain regions corresponding to these co-ordinates were obtained using FSLview (v 3.1).
Statistical analysis
In order to determine the tracing and measurement error levels of the cephalometric measurements, they were repeated for each individual in each of the three groups after 4 weeks to assess repeatability of the measurements. Signal intensity and muscle volume measurements were made by the same oral/maxillofacial radiologist twice in order to evaluate reproducibility.
Statistical analyses were performed using the IBM SPSS Statistics 20 software package. A paired samples t-test was used to determine whether or not the differ-ences in the evaluated parameters between T0 and T1 were statistically significant. Student's t-test was used to compare T0–T1 changes in the evaluated parame-ters between the groups. Variance analysis was used for descriptive statistics at T0 and morphometric analyses of T1 between the treatment groups and the control group.
Results
Cephalometric measurements
Cephalometric measurements showed high reliability, with correlation coefficients ranging between 0.9912 and 0.9984. All measurements were also found to be highly reproducible, with no significant difference between the two measurements of the observer (p > 0.05).
When the cephalometric measurements of Groups 1 and 2 at the start of treatment were compared, Co-A and Co-Gn values were significantly higher in Group 1 (p < 0.05). Separate examination of treatment-induced changes in the groups showed that the increase in SNB angle was significant in Group 1 (p < 0.001), while the decrease in ANB angle (p < 0.05) and increases in Co-A, Co-Gn, and Co-Go lengths were significant in both groups. Comparison of post-treatment changes between Group 1 and Group 2 revealed similar effects in both
groups (Table 2).
MRI measurements
Cephalometric measurements showed high reliability, with correlation coefficients ranging between 0.8915 and 0.9878. All measurements were also found to be highly reproducible, with no significant difference between the two measurements of the observer (p < 0.05).
Evaluation of MRI measurements at the start of treatment showed borderline significant differences Figure 2 Determination of brain regions showing activation in the
Freesurfer program.
Figure 3 (a) Brain regions with activity on fMRI during the biting task (Group 2 vs control group), (b) Brain regions with activity on fMRI during the chewing task (Group 1 vs control group).
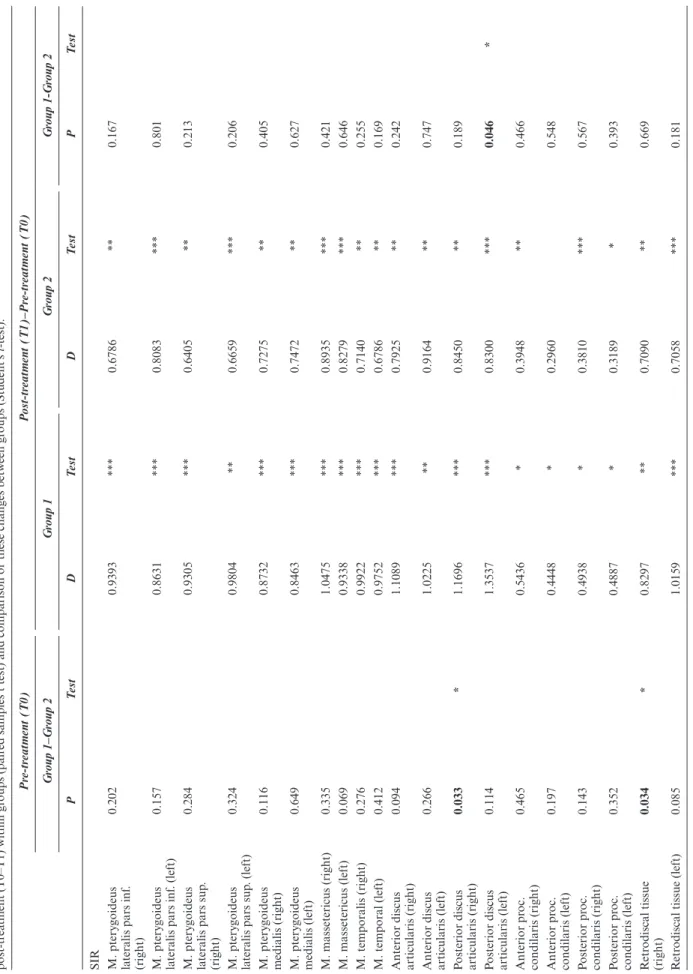
between Group one and Group two in signal intensi-ties of the posterior articular disc (right) and posterior condylar process (left) and in lateral pterygoid muscle volume (left) (p < 0.05). Analysis of post-treatment changes revealed significant increases in the SIR values of all masticatory muscles and both anterior and poste-rior aspects of the articular disc and retrodiscal tissue in both study groups (p < 0.05 for all except left anterior condylar process in Group 2). When these changes were compared between the study groups, the only significant difference was in the signal intensity of the posterior
articular disc (left) (p < 0.05) (Table 3).
fMRI measurements
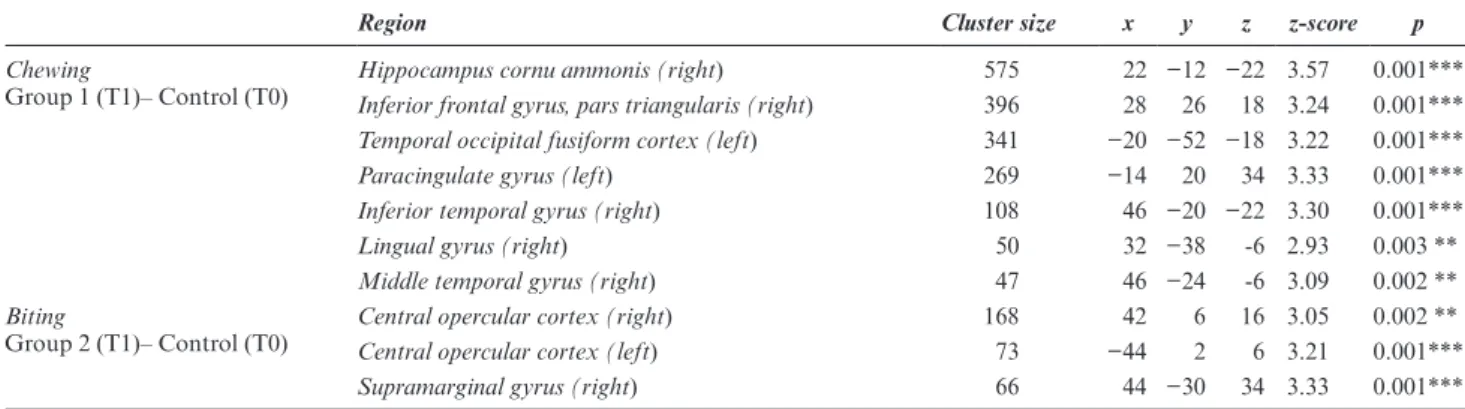
Table 4 shows some significant changes identified in comparisons of BOLD data obtained from post-treat-ment resting fMRI of Groups 1 and 2 and pre-treatpost-treat-ment fMRI in the control group.
In the chewing task, Group 1 showed significant post-treatment differences compared to pre-treatment values in the control group in the hippocampal cornu ammonis (right) (p < 0.001), inferior frontal gyrus (p < 0.001), pars triangularis (right) (p < 0.001), temporal occipital fusiform cortex (left) (p < 0.001), paracingulate gyrus (left) (p < 0.001), inferior temporal gyrus (right) (p = 0.001), lingual gyrus (right) (p < 0.01), middle temporal gyrus (right) (p = 0.01) regions. In the biting task, Group 2 showed significant differences compared to control pre-treatment values in the central opercular cortex (right) (p < 0.01), central opercular cortex (left) (p < 0.001), and supramarginal gyrus (right) (p < 0.001)
regions (Table 5).
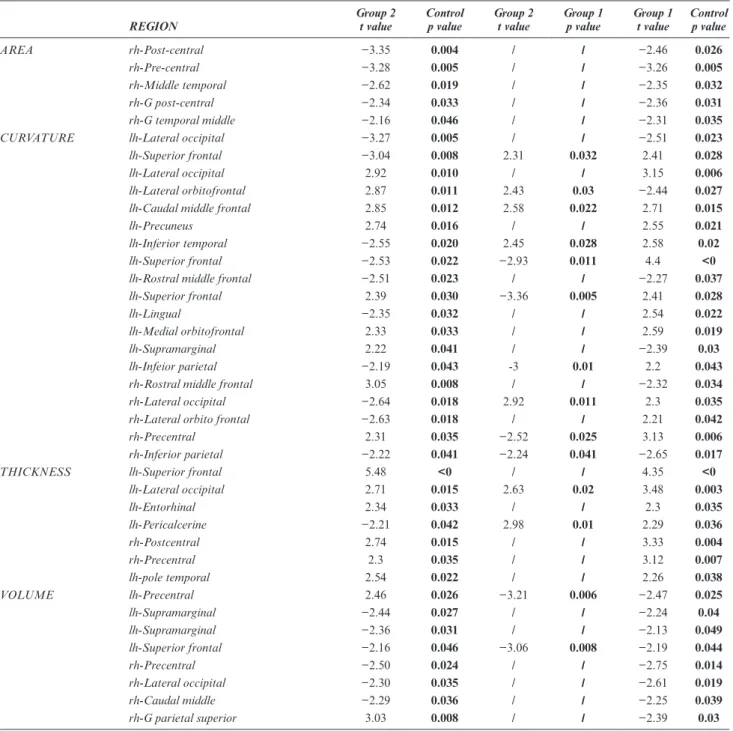
The brain regions showing significant differences in morphological parameters such as curvature, area, volume, and thickness in analyses of post-treatment data in the FT wear (Group 1) and PT wear (Group 2) groups compared to pretreatment data from the control
group are shown in Table 6.
Discussion
Discrepancies in reported outcomes with functional appliances are related to factors such as duration of wear, appliance design, and timing of treatment
initi-ation. Sander17 has argued that FT wear of functional
orthopedic appliances facilitates neuromuscular adap-tation because the appliance is used more consciously and with more functional movements. Due to the higher frequency of functional activities during the day, the masticatory muscles adapt more readily to their new positions, and the appliance acts as a myofunctional
exercise device to create a new engram in the brain.4
Therefore, in this study we aimed to compare the effects of FT and PT wear of functional orthopedic appliances.
Studies on functional orthopedic treatment have demonstrated its effect on the size and position of
the mandible.2,18 Researchers have reported a strong
t able 2 Descripti ve sta tistics and comparison of the mean values of cephalometric par ameters at the start of tr ea tment (T0) betw een Gr oups 1 and 2 (v ariance anal ysis), ev alua tion of ceph -alometric changes fr om pr e- to post-tr ea tment (T0–T1) within gr oups (pair
ed samples t test) and comparison of
these changes betw
een gr oups (Student’ s t-test). Pr e-tr eatment (T0) P ost-tr eatment (T1)– Pr e-tr eatment (T0) Gr oup 1 Gr oup 2 Gr oup 1–Gr oup 2 X Sx X Sx P Test Gr oup 1 Gr oup 2 Gr oup 1-Gr oup 2 Chr onolo gical a ge 11,48 1,49 11,28 1,24 0.595 D P test D P test P test Sk eletal a ge 11,38 0,83 11,56 0,78 0.649 Sk
eletal angular measur
ements (°) SNA 82,05 2,50 79,44 1,5 0.117 0,53 0.168 0,34 0.529 0.768 SNB 75,51 2,96 73,88 1,48 0.492 1,70 0.001 *** 1,67 0.065 0.977 ANB 6,54 2,18 5,56 1,49 0.256 −1,17 0.04 * −1,35 0.042 * 0.809 GoGn/SN 32,16 4,06 32,90 4,36 0.132 0,67 0.469 0,36 0.668 0.800 Sk
eletal linear measur
ements (mm) Co-A 81,84 4,31 78,95 3,79 0.026* 6,37 0.001 *** 5,14 0.004 ** 0.449 Co-Gn 98,79 4,77 98,00 2,01 0.038* 9,44 0.001 *** 7,71 0.001 *** 0.430 Co-Go 46,04 2,24 47,26 3,30 0.682 5,63 0.007 * 5,54 0.000 **. 0.964 Go-Gn 71,09 4,67 68,28 4,28 0.124 3,86 0.056 1,00 0526 0.224
D: mean change betw
een T0 and T1; S
x
: err
or of
the mean;X: mean.
*p
< 0.05, **
p < 0.01, ***
t able 3 Comparison of the mean v alues of MRI par ameters a t the start of tr ea tment (T0) betw een Gr
oups 1 and 2 (Student’
s t-test), e valua tion of cephalometric changes fr om pr e- to post-tr ea tment (T0–T1) within gr oups (pair
ed samples t test) and comparison of
these changes betw
een gr oups (Student’ s t-test). Pr e-tr eatment (T0) P ost-tr eatment (T1)–Pr e-tr eatment (T0) Gr oup 1–Gr oup 2 Gr oup 1 Gr oup 2 Gr oup 1-Gr oup 2 P Test D Test D Test P Test SIR M. ptery goideus la ter
alis pars inf
. (right) 0.202 0.9393 *** 0.6786 ** 0.167 M. ptery goideus la ter
alis pars inf
. (left) 0.157 0.8631 *** 0.8083 *** 0.801 M. ptery goideus la ter
alis pars sup
. (right) 0.284 0.9305 *** 0.6405 ** 0.213 M. ptery goideus la ter
alis pars sup
. (left) 0.324 0.9804 ** 0.6659 *** 0.206 M. ptery goideus medialis (right) 0.116 0.8732 *** 0.7275 ** 0.405 M. ptery goideus medialis (left) 0.649 0.8463 *** 0.7472 ** 0.627 M. massetericus (right) 0.335 1.0475 *** 0.8935 *** 0.421 M. massetericus (left) 0.069 0.9338 *** 0.8279 *** 0.646 M. tempor alis (right) 0.276 0.9922 *** 0.7140 ** 0.255 M. tempor al (left) 0.412 0.9752 *** 0.6786 ** 0.169
Anterior discus articularis (right)
0.094 1.1089 *** 0.7925 ** 0.242
Anterior discus articularis (left)
0.266 1.0225 ** 0.9164 ** 0.747
Posterior discus articularis (right)
0.033 * 1.1696 *** 0.8450 ** 0.189
Posterior discus articularis (left)
0.114 1.3537 *** 0.8300 *** 0.046 * Anterior pr oc. condilaris (right) 0.465 0.5436 * 0.3948 ** 0.466 Anterior pr oc. condilaris (left) 0.197 0.4448 * 0.2960 0.548 Posterior pr oc. condilaris (right) 0.143 0.4938 * 0.3810 *** 0.567 Posterior pr oc. condilaris (left) 0.352 0.4887 * 0.3189 * 0.393 R etr odiscal tissue (right) 0.034 * 0.8297 ** 0.7090 ** 0.669 R etr
odiscal tissue (left)
0.085 1.0159 *** 0.7058 *** 0.181 (Contin ued)
association between change in mandibular length and
increased condylar growth.2,19 Our evaluation of the
effect of functional appliances on mandibular parame-ters in the present study revealed a significant increase in SNB angle with FT wear while ANB angle decreased in both groups after treatment, consistent with the results of previous studies. In addition, total maxillary length (Co-A), total mandibular length (Co-Gn), and ramus length (Co-Go) increased in both treatment groups. The results obtained from both treatment groups demon-strated that an increase in mandibular length caused the reduction in ANB angle.
MRI is the modality that yields the most detailed information when imaging soft tissues such as the TMJ
and joint disc. Aksoy and Orhan20 reported that joint
anatomy could be visualized particularly well with T1
weighted images. We also acquired T1 weighted images
due to their diagnostic capacity in the joint region. When changes in signal intensity were examined separately in each group, there were increases of varying magnitudes in the masticatory muscles, joint disc, condyle, and retrodiscal tissue in both groups.
Hinton and McNamara21 demonstrated in an animal
study that adaptive changes occur not only in the condylar region but also in the glenoid fossa. The authors suggested that periosteal tension transmitted through the posterior fibers of the articular disc may cause the osteogenic response in the glenoid fossa. Studies have indicated that cellular activity in the posterosuperior aspect of the condylar process in particular is increased by positioning the condyle inferior to the glenoid
fossa.2,22 The increase in signal intensity in the
postero-superior aspect of the condyle observed in our study corroborates previous studies and indicates that func-tional orthopedic treatment stimulates condylar growth in the superior and posterior directions and that there may also be adaptive changes in the disc and retrodiscal tissue. We believe that in addition to growth, the volume increase and changes in signal intensity observed in the masticatory muscles may be attributable to vasculariza-tion and increased perfusion of the muscle as a result of increased muscle activity, together with muscular adap-tation and hypertrophy due to long-term treatment.
Frankel intended to treat Class II patients by creating a new closure model in the brain with the Frankel two appliance, which he designed as an exercise appliance. This appliance moves the mandible anteriorly during wear and causes pressure and pain in the alveolar protrusions when the mandible attempts to return to a retrusive position. These sensations activate the proprio-ceptors in the gingiva and periosteum of the gums and stimulate the protrusive muscles to eliminate the discom-fort, resulting in mandibular protrusion. This persistent discomfort is recognized by the central nervous system and creates negative feedback through which the brain can learn that the correct position of the lower jaw, i.e. the most comfortable position that avoids sensations of
pressure, is Class I closure.23 Based on these concepts, we
Pr e-tr eatment (T0) P ost-tr eatment (T1)–Pr e-tr eatment (T0) Gr oup 1–Gr oup 2 Gr oup 1 Gr oup 2 Gr oup 1-Gr oup 2 P Test D Test D Test P Test Musc le v olume measur ements (cm 3) M. ptery goideus la ter alis v olume (right) 0.051 1.017 *** 0.924 * 0.788 M. ptery goideus la ter alis v olume (left) 0.022 * 1.147 *** 0.786 ** 0.232 M. ptery goideus medialis v olume (right) 0.879 1.073 ** 1.227 *** 0.671 M. ptery goideus medialis v olume (left) 0.410 0.644 1.175 * 0.368
M. massetericus volume (right)
0.533
1.499
1.763
*
0.783
M. massetericus volume (left)
0.652 1.705 ** 1.604 ** 0.861
SIR, signal intensity r
atio . *p < 0.05, ** p < 0.01, *** p < 0.001 t able 3 (Contin ued)
analyzed and compared the neurological effects of the appliance with FT and PT wear by examining changes in the brain with fMRI after functional treatment.
According to our resting fMRI data, both FT wear and PT wear resulted in statistically significant differ-ences in several parameters after treatment compared to baseline data from the control group. Regions exhibiting significant changes included the primary and mentary motor areas, primary sensory cortex, supple-mentary sensory cortex, areas responsible for motor movements like the supramarginal gyrus, vision-related areas, motor mirror neuron system, areas responsible for the coordination of skeletal muscles, and sensory
areas that process sensory data from movements such as speech, chewing, and biting. When we looked into the known functions of these regions, we noted that the supramarginal gyrus is involved in interpreting tactile sensory data (e.g. from dental sensory receptors and muscle spindles) and proprioception, in addition to perceiving and processing language. This activity was observed in the supramarginal gyrus with both FT and PT wear and seems to confirm the negative feedback
mechanism proposed by Frankel and Frankel.23 The
mandible, which adopts Class I closure through avoid-ance of the discomfort created by the appliavoid-ance, may be responsible for activation of the supramarginal gyrus. It table 4 Evaluation of parameters measured in resting-state functional magnetic resonance imaging (fMRI) in the full-time wear group after treatment (T1) compared to the control group at the start of treatment (T0) and in the part-time (night) wear group after treatment (T1) compared to the control group at the start of treatment (T0) according to BOLD (blood-oxygen-level-dependent) signals (Student’s t-test).
Group 1 (T1)–Control group (T0) Group 2 (T1)–Control group (T0)
Region Cluster
size x y z p Region Clustersize x y z p
Central opercular cortex 33 50 -2 8 0.001*** Central opercular cortex 5 50 −18 16 0.008 **
Frontal operculum cortex 13 −38 10 8 0.002** Central opercular cortex 14 −54 -2 8 0.001***
Frontal operculum cortex 6 46 26 0 0.001*** Central opercular cortex 89 50 -2 4 0.001***
Superior frontal gyrus 5 -6 18 64 0.001*** Frontal operculum cortex 11 50 14 -4 0.004 **
Superior frontal gyrus 7 −22 18 56 0.004** Superior frontal gyrus 19 −10 34 48 0.001***
Middle frontal gyrus 12 −42 26 44 0.004 ** Superior frontal gyrus 10 22 34 44 0.001***
Middle frontal gyrus 31 26 2 40 0.001*** Superior frontal gyrus 9 -2 54 40 0.002 **
Inferior frontal gyrus 7 42 14 16 0.003 ** Middle frontal gyrus 9 50 18 44 0.002 **
Inferior frontal gyrus 10 −54 14 8 0.001*** Middle frontal gyrus 10 −38 14 52 0.004 **
Supramarginal gyrus 6 −50 −34 32 0.001*** Inferior frontal gyrus 22 42 22 20 0.001***
Supramarginal gyrus 13 −54 −42 24 0.002 ** Inferior frontal gyrus 7 58 22 -4 0.003 **
Supramarginal gyrus 29 34 −38 32 0.001*** Supramarginal gyrus 52 −62 −26 32 0.001***
Angular gyrus 4 −50 −54 40 0.003 ** Supramarginal gyrus 6 −58 −50 32 0.005 **
Angular gyrus 7 54 −50 44 0.001*** Supramarginal gyrus 26 66 −38 44 0.001***
Angular gyrus 7 −38 −54 44 0.002 ** Angular gyrus 10 58 −50 36 0.001***
Cingulate gyrus 10 10 −38 44 0.001*** Cingulate gyrus 8 -2 −38 32 0.003 **
Cingulate gyrus 16 2 −26 28 0.001*** Cingulate gyrus 5 6 22 28 0.003 **
Cingulate gyrus 32 6 −26 40 0.001*** Cingulate gyrus 42 -6 −38 44 0.00***
Paracingulate gyrus 5 6 34 32 0.002 ** Paracingulate gyrus 7 -6 54 12 0.003 **
Precentral gyrus 29 −58 -6 36 0.001*** Paracingulate gyrus 5 −10 38 24 0.005 **
Precentral gyrus 7 −38 −14 36 0.001*** Precentral gyrus 25 −58 -6 40 0.001***
Precentral gyrus 8 46 −10 52 0.008** Precentral gyrus 5 −42 −18 56 0.002 **
Postcentral gyrus 7 −54 −22 52 0.002** Precentral gyrus 6 6 −22 52 0.010 **
Postcentral gyrus 5 −42 −26 32 0.009** Postcentral gyrus 22 62 −18 36 0.001***
Postcentral gyrus 7 46 −14 32 0.001*** Postcentral gyrus 16 −42 −30 52 0.001***
Juxtapositional cortex 7 −10 −14 56 0.004** Precentral gyrus 33 38 −10 44 0.001***
Precuneus cortex 6 −26 −50 8 0.001*** Juxtapositional cortex 10 2 2 64 0.001***
Superior temporal gyrus 20 58 −34 8 0.001*** Precuneous cortex 10 −30 −66 12 0.001***
Superior temporal gyrus 7 −50 −26 0 0.001*** Middle temporal gyrus 8 −58 −34 −16 0.001***
Middle temporal gyrus 22 −42 −46 0 0.001*** Middle temporal gyrus 5 −54 −50 4 0.003 **
Inferior temporal gyrus 17 46 −46 -8 0.001*** Middle temporal gyrus 15 58 −58 8 0.002 **
Lingual gyrus 4 2 −90 -8 0.002 ** Inferior temporal gyrus 10 −50 −54 −16 0.001***
Lingual gyrus 4 -2 −90 −12 0.009 ** Lingual gyrus 114 −26 −50 4 0.001***
Parahippocampal gyrus 6 −26 −34 -8 0.003 ** Lingual gyrus 45 -2 −70 -4 0.001*** *p < 0.05, **p < 0.01, ***p < 0.001
is reported in the literature that the supramarginal gyrus plays a major role in motor control, including rapid
alternation of motor functions.24
The middle frontal gyrus and left inferior frontal
gyrus are known as the language region.25,26 In this
study, we observed significant activation in the middle frontal gyrus in the treatment group compared to the control group. Another region that was significant in our study is the angular gyrus. The angular gyrus is a region involved in language, particularly understanding the meaning of metaphorical statements, in mathemat-ical ability, and in distinguishing between the left and
right directions.27 Chen et al28 reported that the angular
gyrus enhanced adaptation to three-dimensional envi-ronments. The precuneus cortex is a region involved in our self-awareness, recollection of previously experi-enced tasks, and response to details regarding these, as well as our ability to focus when planning, visualizing, or directly performing a task, and to carry out conscious
movements.29,30 Ashizuka et al31 reported selective
acti-vation of the precuneus cortex during polite speech in their fMRI study. The activation of these regions in our study suggests that functional treatment in devel-oping patients can improve command of language and increase the ability to form sentences that conform to spelling and grammar rules. For example, the activators initially used for Pierre Robin sequence can improve patients’ language command and social adaptation.
Furthermore, Ohnmeiss et al32 reported that
mandib-ular advancement after treatment with Andresen acti-vator compensated for lumbar hyperlordosis. Thus, it is conceivable that patients’ motor coordination may be improved through functional orthopedic treatment with activators that cause activation of the supplemen-tary motor area (juxtapositional motor cortex), which is allegedly responsible for maintaining body balance, and postural corrections.
Task-based fMRI images revealed increased acti-vation in certain regions of the brain in the FT group during chewing compared to the control group. The
right aspect of the inferior frontal gyrus controls
move-ments that are maintained until a command arrives.33
This region also controls the avoidance of risky move-ments. The activation we observed in this region may represent a “stop” command to the mandible to prevent retraction and maintain an anterior position to avoid discomfort while the appliance was in the mouth during waking hours. The inferior temporal gyrus, another significant region in this study, is involved in object, face,
and pattern recognition.34 In addition to its function of
recognizing complex objects, the lingual gyrus is also particularly influential in seeing and recognizing letters.
Of the brain regions that showed statistical signif-icance during the biting task in the PT wear group after treatment compared to the control group, we noted increased activation in the opercular cortex and supramarginal gyrus. The insular cortex located in the opercular cortex is responsible for motor movements involving hand–eye co-ordination and activities such as
swallowing, speech, and learning.35
Morphometric analyses involved volume, area, thick-ness, and curvature measurements in the brain after treatment. Consistent with the results of fMRI, both the FT and PT wear groups exhibited statistical signif-icant morphometric changes compared to the control group in regions similar to those in both the resting and task-based results. The regions that yielded morphomet-rically significant results were generally the previously mentioned regions, such as those involved in sight, self-awareness, objects recognition, language, and math-ematical skills. However, since the results of morpho-metric analysis mostly reflect physical changes in the brain, more extensive and detailed studies are needed to assert the superiority of either of the wear regimens based on these regions.
One of the main objectives underlying our decision to compare PT and FT wear in this study was to deter-mine whether conscious appliance use had different effects on the brain than wear during sleep alone in functional orthopedic treatment. We expected the table 5 Evaluation of parameters measured during the chewing task in fMRI in the full-time wear group after treatment (T1) compared to the control group at the start of treatment (T0) and in the part-time (night) wear group after treatment (T1) compared to the control group at the start of treatment (T0) according to BOLD (blood-oxygen-level-dependent) signals (Student’s t-test).
Region Cluster size x y z z-score p
Chewing
Group 1 (T1)– Control (T0) Hippocampus cornu ammonis (right)Inferior frontal gyrus, pars triangularis (right) 575396 22 −12 −22 3.5728 26 18 3.24 0.001***0.001***
Temporal occipital fusiform cortex (left) 341 −20 −52 −18 3.22 0.001***
Paracingulate gyrus (left) 269 −14 20 34 3.33 0.001***
Inferior temporal gyrus (right) 108 46 −20 −22 3.30 0.001***
Lingual gyrus (right) 50 32 −38 -6 2.93 0.003 **
Middle temporal gyrus (right) 47 46 −24 -6 3.09 0.002 **
Biting
Group 2 (T1)– Control (T0) Central opercular cortex (right)Central opercular cortex (left) 16873 −4442 62 16 3.056 3.21 0.002 **0.001***
Supramarginal gyrus (right) 66 44 −30 34 3.33 0.001*** fMRI, functional MRI.
benefit of wearing the appliance at night to be limited to dental and skeletal corrections, without formation of a new model of closure in the brain. However, the fMRI results in both the FT and PT wear groups led to a different conclusion. Night wear of the appliance also resulted in significant changes in the brain according to several parameters.
Limitations
The biggest limitation of our study is that the fMRI images acquired from both the FT and PT wear groups before treatment became unusable due to modifications in fMRI methodology at later stages of the study. For this reason, we selected a control group of 10 individ-uals with similar anomalies and characteristics. Changes table 6 Analysis of post-treatment results in the full-time and part-time (night) wear groups compared to pre-treatment results in the control group in terms of the morphological features of the brain such as curvature, area, volume, and thickness and regions that presented significance (variance analysis).
REGION Group 2t value Controlp value Group 2t value Group 1p value Group 1t value Controlp value
AREA rh-Post-central −3.35 0.004 / / −2.46 0.026
rh-Pre-central −3.28 0.005 / / −3.26 0.005
rh-Middle temporal −2.62 0.019 / / −2.35 0.032
rh-G post-central −2.34 0.033 / / −2.36 0.031
rh-G temporal middle −2.16 0.046 / / −2.31 0.035
CURVATURE lh-Lateral occipital −3.27 0.005 / / −2.51 0.023
lh-Superior frontal −3.04 0.008 2.31 0.032 2.41 0.028
lh-Lateral occipital 2.92 0.010 / / 3.15 0.006
lh-Lateral orbitofrontal 2.87 0.011 2.43 0.03 −2.44 0.027
lh-Caudal middle frontal 2.85 0.012 2.58 0.022 2.71 0.015
lh-Precuneus 2.74 0.016 / / 2.55 0.021
lh-Inferior temporal −2.55 0.020 2.45 0.028 2.58 0.02
lh-Superior frontal −2.53 0.022 −2.93 0.011 4.4 <0
lh-Rostral middle frontal −2.51 0.023 / / −2.27 0.037
lh-Superior frontal 2.39 0.030 −3.36 0.005 2.41 0.028
lh-Lingual −2.35 0.032 / / 2.54 0.022
lh-Medial orbitofrontal 2.33 0.033 / / 2.59 0.019
lh-Supramarginal 2.22 0.041 / / −2.39 0.03
lh-Infeior parietal −2.19 0.043 -3 0.01 2.2 0.043
rh-Rostral middle frontal 3.05 0.008 / / −2.32 0.034
rh-Lateral occipital −2.64 0.018 2.92 0.011 2.3 0.035
rh-Lateral orbito frontal −2.63 0.018 / / 2.21 0.042
rh-Precentral 2.31 0.035 −2.52 0.025 3.13 0.006
rh-Inferior parietal −2.22 0.041 −2.24 0.041 −2.65 0.017
THICKNESS lh-Superior frontal 5.48 <0 / / 4.35 <0
lh-Lateral occipital 2.71 0.015 2.63 0.02 3.48 0.003 lh-Entorhinal 2.34 0.033 / / 2.3 0.035 lh-Pericalcerine −2.21 0.042 2.98 0.01 2.29 0.036 rh-Postcentral 2.74 0.015 / / 3.33 0.004 rh-Precentral 2.3 0.035 / / 3.12 0.007 lh-pole temporal 2.54 0.022 / / 2.26 0.038 VOLUME lh-Precentral 2.46 0.026 −3.21 0.006 −2.47 0.025 lh-Supramarginal −2.44 0.027 / / −2.24 0.04 lh-Supramarginal −2.36 0.031 / / −2.13 0.049 lh-Superior frontal −2.16 0.046 −3.06 0.008 −2.19 0.044 rh-Precentral −2.50 0.024 / / −2.75 0.014 rh-Lateral occipital −2.30 0.035 / / −2.61 0.019 rh-Caudal middle −2.29 0.036 / / −2.25 0.039 rh-G parietal superior 3.03 0.008 / / −2.39 0.03 *p < 0.05, **p < 0.01, ***p < 0.001
in the brains of patients in the FT and PT wear groups after treatment were determined based on compari-sons with data obtained from the control group prior to treatment. Therefore, more accurate results could be obtained by conducting a new study with larger study groups, utilizing pre- and post-treatment fMRI images from the same patients.
Another limitation for this study is the lack of treat-ment-free control group. The main reason for the lack of treatment-free control group is that all of our patients were at or near the period of maximum pubertal growth. Optimal treatment timing for functional appliances is at the period of maximal pubertal growth. So, having a treatment-free control group for this study would mean that skeletal ages of patients could be delayed for ideal treatment results. Therefore, both ethical considerations and the difficulties of obtaining MRIs from children prevented us from including treatment-free control subjects in this study. Nevertheless, this study offers a new perspective on the long-debated topic of the neuro-muscular effects of functional orthopedic treatment. conclusion
The effects of FT and night-only use of functional orthopedic appliances were similar according to ceph-alometric, MRI, and fMRI evaluation. Functional appliances not only correct morphology, but also bring about structural alterations of the masticatory muscles.
Instead of regarding these appliances as simple devices that only provide skeletal and dental correction of Class II malocclusion, it would be more accurate to think of them as exercise tools that lead to neuromuscular changes by facilitating muscle adaptation and activating various brain regions.
acknowledgment
This project was supported by the Ankara University Scientific Research Projects Center (BAP) under project number 15B0234003.
Funding
This project was supported by the Ankara University Scientific Research Projects Center (BAP) under project number 15B0234003.
Patient consent
All procedures followed were in accordance with the ethical standards of the responsible committee on human experimentation (institutional and national) and with the Helsinki Declaration of 1964 and later versions. Informed consent was obtained from all patients for being included in the study.
References
1. Woodside DG, Metaxas A, Altuna G. The influence of functional appliance therapy on glenoid fossa remodeling. Am J Orthod
Dentofacial Orthop 1987; 92: 181–98. doi: https:// doi. org/ 10. 1016/ 0889- 5406( 87) 90411-2
2. McNamara JA, Bryan FAAllen Bryan F. Long-Term mandib-ular adaptations to protrusive function: an experimental study in Macaca mulatta. Am J Orthod Dentofacial Orthop 1987; 92:
98–108. doi: https:// doi. org/ 10. 1016/ 0889- 5406( 87) 90364-7
3. Petrovic A. Control of postnatal growth of secondary cartilages of the mandible by mechanisms regulating occlusion. Cybernetic model. Trans Eur Orthod Soc 1974; 50: 69–75.
4. Fränkel R, Fränkel C. Clinical implication of Roux's concept in orofacial orthopedics. J Orofac Orthop / Fortschritte der
Kieferorthopädie 2001; 62: 1–21. doi: https:// doi. org/ 10. 1007/ PL00001915
5. Petrovic AG, Stutzmann JJ. Research methodology and findings in applied craniofacial growth studies. In: Graber T. M, Rakosi T, Petrovic A. G, eds. Dentofacial Orthopedics With Functional
Appliances. 2nd edn. St. Louis: Mosby Company; 1997. pp. 13–63.
6. Oudet C, Petrovic AG. Variations in the number of sarcom-eres in series in the lateral pterygoid muscle as a function of the longitudinal deviation of the mandibular position produced by the postural hyperpropulsor. In: Carlson D. S, McNamara JA Jr, eds. Muscle adaptation in the craniofacial region. Monograph
No. 8. Craniofacial Growth Series. Ann Arbor: Center for Human
Growth and Development, The University of Michigan; 1978. 7. Orhan K, Nishiyama H, Tadashi S, Murakami S, Furukawa S.
Comparison of altered signal intensity, position, and morphology of the TMJ disc in Mr images corrected for variations in surface
coil sensitivity. Oral Surg Oral Med Oral Pathol Oral Radiol Endod
2006; 101: 515–22. doi: https:// doi. org/% 2010. 1016/ j. tripleo. 2005.
04. 004
8. Huettel SA, Song AW, McCarthy G. Functional Magnetic
Reso-nance Imaging. 2nd edn. Massachusetts: Sinauer Associates; 2009.
9. Logothetis NK. What we can do and what we cannot do with
fMRI. Nature 2008; 453: 869–78. doi: https:// doi. org/ 10. 1038/
nature06976
10. Wadhawan N, Kumar S, Kharbanda OP,
Duggal R, Sharma R. Temporomandibular joint adaptations following two-phase therapy: an MRI study. Orthod Craniofac
Res 2008; 11: 235–50. doi: https:// doi. org/ 10. 1111/ j. 1601- 6343. 2008. 00436.x
11. Ruf S, Pancherz H. Temporomandibular joint growth adaptation in Herbst treatment: a prospective magnetic resonance imaging and cephalometric roentgenographic study. Eur J Orthod 1998;
20: 375–88. doi: https:// doi. org/ 10. 1093/ ejo/ 20. 4. 375
12. Pancherz H, Ruf S, Thomalske-Faubert C. Mandibular articular disk position changes during Herbst treatment: a prospective longitudinal MRI study. Am J Orthod Dentofac Orthop 1999; 116:
207–14. doi: https:// doi. org/ 10. 1016/ S0889- 5406( 99) 70219-2
13. Cesur E, Özdiler O, Köklü A, Orhan K, Seki U.;in press Effects of wear time differences of removable functional appliances in class II patients: prospective MRI study of TMJ and
mastica-tory muscle changes. Oral Radiol 92. doi: https:// doi. org/ 10. 1007/
s11282- 019- 00379-0
14. Helm S, Siersbaek-Nielsen S, Skieler V, Björk A. Reifung des handskellets bezogen auf das maksimale grössen-wachtum des körpers in Der pubertaet. Inf Kieferorthop 1976; 2: 51–72.
15. Greulich WW, Pyle SI. Radiographic atlas of skeletal development
of hand and wrist. 2nd edn. 238. Stanford: Stanford University
Press; 1959. pp. 393. doi: https:// doi. org/ 10. 1097/ 00000441-
195909000- 00030
16. Clark WJ. The twin block tecnique. In: Graber T. M, Rakosi T, Petrovic A. G, eds. Dentofacial orthopedics with functional
appli-ances. St. Louis: Mosby Company; 1997. pp. 268–98.
17. Sander FG. Functional processes when wearing the SII appliance
during the day. J Orofac Orthop 2001; 62: 264–74. doi: https:// doi.
org/ 10. 1007/ PL00001934
18. Hansen K, Pancherz H, Hägg U. Long-Term effects of the Herbst appliance in relation to the treatment growth period: a
cephalo-metric study. Eur J Orthod 1991; 13: 471–81. doi: https:// doi. org/
10. 1093/ ejo/ 13. 6. 471
19. Williams S, Melsen B. Condylar development and mandibular rotation and displacement during activator treatment. An implant
study. Am J Orthod 1982; 81: 322–6. doi: https:// doi. org/ 10. 1016/
0002- 9416( 82) 90220-2
20. Aksoy S, Orhan K. Manyetik rezonans görüntülemenin dento-maksillofasiyal bölgedeki kullanım alanları. Türkiye Klinikleri J
Dental Sci -Special Topics 2010; 1: 44–57.
21. Hinton RJ, McNamara JA. Temporal bone adaptations in response to protrusive function in juvenile and young adult rhesus monkeys (Macaca mulatta). Eur J Orthod 1984; 6: 155–74. doi:
https:// doi. org/ 10. 1093/ ejo/ 6. 3. 155
22. Elgoyhen JC, Moyers RE, McNamara JA, Riolo ML. Craniofa-cial adaptation of protrusive function in young rhesus monkeys.
Am J Orthod 1972; 62: 469–80. doi: https:// doi. org/ 10. 1016/ 0002- 9416( 72) 90023-1
23. Fränkel R, Fränkel C. Orofacial orthopedics with the function
regu-lator. 1st edn. Basel: Karger; 1989.
24. Tunik E, Rice NJ, Hamilton A, Grafton ST. Beyond grasping: representation of action in human anterior intraparietal sulcus.
Neuroimage 2007; 36: T77–T86. doi: https:// doi. org/ 10. 1016/ j. neuroimage. 2007. 03. 026
25. Abrahams S, Goldstein LH, Simmons A, Brammer MJ, Williams SCR, Giampietro VP, et al. Functional magnetic reso-nance imaging of verbal fluency and confrontation naming using compressed image acquisition to permit overt responses. Hum
Brain Mapp 2003; 20: 29–40. doi: https:// doi. org/ 10. 1002/ hbm. 10126
26. Brown TT, Lugar HM, Coalson RS, Miezin FM, Petersen SE, Schlaggar BL. Developmental changes in human cerebral func-tional organization for word generation. Cereb Cortex 2005; 15:
275–90. doi: https:// doi. org/ 10. 1093/ cercor/ bhh129
27. Ramachandran VS, Hubbard EM. The phenomenology of synaesthesia. J Consciousness Stud 2003; 10: 49–57.
28. Chen Q, Weidner R, Vossel S, Weiss PH, Fink GR. Neural mech-anisms of attentional reorienting in three-dimensional space. J
Neurosci 2012; 32: 13352–62. doi: https:// doi. org/ 10. 1523/ JNEU-ROSCI. 1772- 12. 2012
29. Kjaer TW, Nowak M, Lou HC. Reflective self-awareness and conscious states: PET evidence for a common midline
parietof-rontal core. Neuroimage 2002; 17: 1080–6. doi: https:// doi. org/ 10.
1006/ nimg. 2002. 1230
30. Vogt BA, Laureys S. Posterior cingulate, precuneal and retros-plenial cortices: cytology and components of the neural network correlates of consciousness. Prog Brain Res 2005; 150: 205–17.
doi: https:// doi. org/ 10. 1016/ S0079- 6123( 05) 50015-3
31. Ashizuka A, Mima T, Sawamoto N, Aso T, Oishi N, Sugihara G, et al. Functional relevance of the precuneus in verbal politeness.
Neurosci Res 2015; 91: 48–56. doi: https:// doi. org/ 10. 1016/ j. neures. 2014. 10. 009
32. Ohnmeiß M, Kinzinger G, Wesselbaum J, Korbmacher-Steiner HM. Therapeutic effects of functional orthodontic appliances on cervical spine posture: a retrospective cephalometric study. Head
Face Med 2014; 10: 7. doi: https:// doi. org/ 10. 1186/ 1746- 160X- 10-7
33. Aron AR, Robbins TW, Poldrack RA. Inhibition and the right inferior frontal cortex. Trends Cogn Sci 2004; 8: 170–7. doi:
https:// doi. org/ 10. 1016/ j. tics. 2004. 02. 010
34. Creem SH, Proffitt DR. Defining the cortical visual systems: “What”, “Where”, and “How”. Acta Psychologica 2001;
107(1-3): 43–68. doi: https:// doi. org/ 10. 1016/ S0001- 6918( 01) 00021-X
35. Ackermann H, Riecker A. The contribution of the insula to motor aspects of speech production: a review and a hypothesis.
Brain Lang 2004; 89: 320–8. doi: https:// doi. org/ 10. 1016/ S0093- 934X( 03) 00347-X