BUDGETARY EFFICIENCY IN TURKEY:
LOCAL – CENTRAL
GOVERNMENT RELATIONS FROM THE
PERSPECTIVE OF FISCAL FEDERALISM
The Institute of Economics and Social Sciences of Bilkent University
by
ZAFER AKIN
In Partial Fulfillment of the Requirements for the Degree of
Master of Economics
Bilkent University, Department of Economics
Ankara
I certify that I have read this thesis and have found that it is fully adequate, in scope and in quality, as a thesis for the degree of Master of Economics.
---Assistant Professor Dr. Bilin Neyaptı
Supervisor
I certify that I have read this thesis and have found that it is fully adequate, in scope and in quality, as a thesis for the degree of Master of Economics.
---Assistant Professor Dr. Hakan Berument
Examining Committee Member
I certify that I have read this thesis and have found that it is fully adequate, in scope and in quality, as a thesis for the degree of Master of Economics.
---Associate Professor Dr. Osman Zaim
Examining Committee Member
Approval of the Institute of Economics and Social Sciences
---Prof. Dr. Kürşat Aydoğan
Director
ABSTRACT
BUDGETARY EFFICIENCY IN TURKEY:
LOCAL –CENTRAL GOVERNMENT RELATIONS FROM
THE PERSPECTIVE OF FISCAL FEDERALISM
Zafer Akin
M.A. in Economics
Supervisor: Assistant Professor Bilin Neyaptı
June, 2001
The role and the functions of different levels of government are controversial issues. Together with increasing the importance of the local governments, decentralization has also gained importance. In this study, we examine local-central government relationships in Turkey, which has a strongly centralized government structure, by inspecting the status of decentralization. We empirically investigate the critical points mentioned in traditional fiscal federalism theories by using a provincial data set. Our study briefly reveals that there has not been a trend toward expenditure decentralization in Turkey. Although a slight trend toward tax decentralization is observed, local governments in Turkey do not have ability to improve their own revenues. In addition, we do not see any significant compensatory policy of the central government against the shocks realized in the macroeconomic environment. A supporting policy of the national government is observed in the priority regions for development and in agricultural regions. Finally, our study on social indicators showed that there are significant uneven distribution of health facilities and inequalities among different income groups. In education case, we observe that education facilities are more even across provinces as compared to health facilities.
Keywords: Decentralization, fiscal federalism, local governments and budgetary efficiency.
ÖZET
TURKİYE’DEKİ BÜTÇE VERİMLİLİĞİ: MALİ FEDERALİZM
AÇISINDAN YEREL VE MERKEZİ YÖNETİM İLİŞKİLERİ
Zafer Akın
Ekonomi Bölümü Yüksek Lisans
Danışman: Yard. Doç. Bilin Neyaptı
Haziran, 2001
Günümüzde farklı seviyedeki devlet yönetimlerinin rolleri ve fonksiyonları çok tartışılmaktadır. Yerel yönetimlerin önemi hızla arttığından dolayı, yerelleşme de günden güne önem kazanmaktadır. Bu çalışmada, yerelleşme konusunu gözönüne alarak, güçlü bir merkezi yönetim sistemine sahip olan Türkiye’deki yerel ve merkezi yönetim ilişkilerini inceledik. İl bazında bir veri kümesi kullanarak, geleneksel mali federalizm teorilerinde vurgulanan önemli noktaları yakalamaya çalıştık. Çalışmamızın önemli bulguları şunlardır: Türkiye’de harcamaya yönelik önemli bir yerelleşme eğilimi yoktur. Buna karşın, vergi yerelleşmesine yönelik zayıf bulgular elde etmemize rağmen, Türkiye’deki yerel yönetimlerin temelini oluşturan belediyeler özkaynaklarını arttırma kabiliyetine yeterince sahip değildir. Ek olarak, merkezi yönetimin ekonomide gerçekleşen şoklara karşı gerekli mali politikaları üretemediğini gözledik. Merkezi yönetimin kalkınmada öncelikli yörelerde ve tarımsal bölgelerde destekleyici rol oynadığını gözledik. Son olarak, sosyal göstergeler üzerindeki çalışmalarımız sağlık imkanlarının dağılımında önemli eşitsizlikler ve değişik gelir düzeyi grupları arasında sağlık imkanları açısından büyük farklılıklar olduğunu ortaya koymuştur. İller bazında incelendiğinde, eğitim alanında, sağlık imkanlarına nazaran daha adil bir paylaşım ve dağılım olduğunu gözlemledik.
Anahtar Kelimeler: Yerelleşme, mali federalizm, yerel yönetimler ve bütçe verimliliği.
ACKNOWLEDGEMENTS
I am indebtedly grateful to Assistant Professor Bilin Neyaptı for her perfect guidance, support and tolerance throughout the whole course of this study. Her patience and encouraging supervision bring my research up to this point. I also would like to thank Assistant Professor Hakan Berument and Associate Professor Osman Zaim for showing keen interest to the subject matter and accepting to rewiev this thesis.
I especially would like to thank the dormitory team; Yavuz Arslan, O. Faruk Baykal, Zeynal Karaca, Orhan Hasanaliyev and Mehmet Germeyanoglu who made my last two years so precious and enjoyable and for their invaluable helps.
I am also indebted to my other friends, Erkan Köse, Salih Ucar, Mustafa Gök and Mustafa Keşir for their brotherhood and friendships which has always been so invaluable, sharing and understanding in my all university life .
I will never forget our late night talks in the kitchen of 75. dormitory.
Finally, I owe special thanks to my mother, father and elder sisters who keep on saying ‘you can do it’ and who have supported my studies from its beginning.
TABLE OF CONTENTS
ABSTRACT...…...i
ÖZET………..ii ACKNOWLEDGMENTS...…...iii TABLE of CONTENTS………..iv LIST of TABLES………vi LIST of FIGURES………..vii CHAPTER I: INTRODUCTION...1CHAPTER II: THEORY...6
2.1 The Role of Government...7
2.2 Allocation of Functions Among Levels of the Government...8
2.3 Key Elements of Local Governments...10
2.4 Theories of Decentralization and Federalism: The Traditional and New Perspectives...12
2.5 Local Governments in Turkey...15
CHAPTER III: DESCRIPTIVE STATISTICS and DATA...19
3.1 Central and Municipal Expenditures...20
3.2 Central and Municipal Tax Revenues...22
3.3 Measures of Decentralization...23
3.4 Volatility Measures...23
3.5 Government Size...24
3.6 Investment Spending...24
3.7 Social Indicators...25
CHAPTER IV: METHODOLOGY and REGRESSION ANALYSIS...26
4.1 Methodology...26
4.2 Regression Analysis...27
4.2.1 Central and Municipal Expenditures...27
4.2.2 Central and Municipal Tax Revenues...29
4.2.3 Measures of Decentralization...29
4.2.4 Volatility Measures…...30
4.2.5 Investment Spending...31
4.2.6 Social Indicators...31
CHAPTER V: RESULTS and CONCLUSION...33
REFERENCES...37
APPENDICES...40
1. Data Source and Descriptions...41
2. Tables...46
3. Figures...57
LIST of TABLES
1. Table A: Correlation Matrix………...47 2. Table B: Municipality Revenues and Table C: Municipality Expenditures,
as percentage...48 3. Table 1.a: Regression Analysis; expenditures, taxes and decentralization
measures are independent variables...49 4. Table 1.b: Regression Analysis; expenditures, taxes and decentralization
measures are independent variables and income distribution variable added...50 5. Table 2.a: Regression Analysis; investment expenditures, GDP and social
indicators are independent variables...51 6. Table 2.b: Regression Analysis; investment expenditures, GDP and social
indicators are independent variables and income distribution variables added...52 7. Table 3: Regression Analysis; volatilities of GDP and expenditures and
GDP growth are independent variables...53 8. Table 4: All data we used in the regression analysis……….54
LIST of FIGURES
1. Figure 1.1: rExpmpc vs rGDPpc…..……….………58
2. Figure 1.2: rExpcpc vs rGDPpc……..……….………..58
3. Figure 1.3: rExpmpc vs rExpcpc……..……….………59
4. Figure 1.4: rExpmpc vs rVAagrpc……..……….…………..59
5. Figure 1.5: rExpcpc vs rVAagrpc………..……….………...60
6. Figure 1.6: rInvExpcpc vs rVAagrpc……..……….………..60
7. Figure 1.7: rExpcpc vs NuTaxp…………..……….………..61
8. Figure 1.8: rExpmpc vs NuTaxp…………..……….……….61
9. Figure 1.9: rExpmpc vs Bot20………..……….………62
10. Figure 1.10: rExpcpc vs Bot20………..……….………62
11. Figure 1.11: rExpmpc vs Top20………..……….……..62
12. Figure 1.12: rExpcpc vs Top20………..………62
13. Figure 1.13: rExpmpc vs Bot20/rGDPpci………..………63
14. Figure 1.14: rExpmpc vs Top20/rGDPpc….……..………63
15. Figure 1.15: rExpcpc vs Bot20/rGDPpci….…………..……….63
16. Figure 1.16: rExpcpc vs Top20/rGDPpc….………….………..63
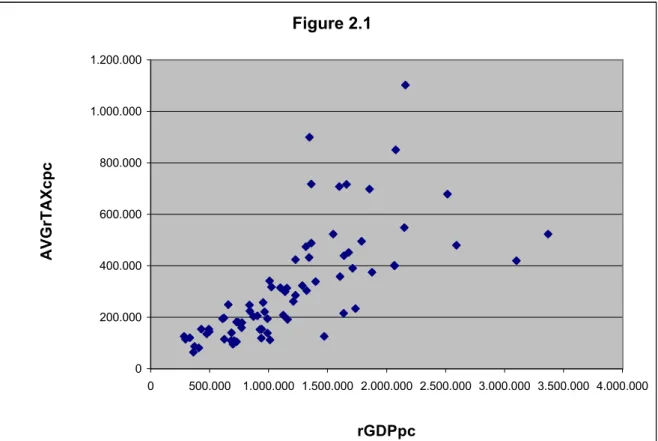
17. Figure 2.1: rTaxcpc vs rGDPpc……….………….………64
18. Figure 2.2: rTaxmpc vs rGDPpc.……….………….………..64
19. Figure 2.3: rTaxmpc vs NuTaxp……….….………...65
20. Figure 2.4: rTaxcpc vs NuTaxp……….……….65
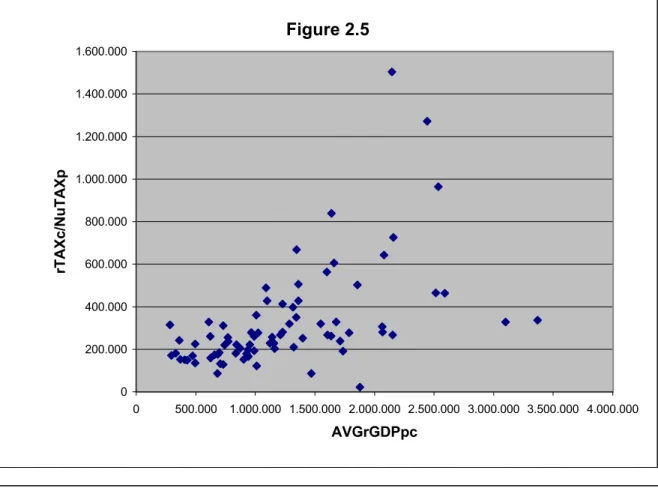
21. Figure 2.5: rTaxc/NuTaxp vs rGDPpc……….………..………66
22. Figure 2.6: rTaxc/NuTaxp vs rGDPpc (1997)………….………...66
23. Figure 2.7: rTaxmpc vs rTaxcpc ……….………..67
24. Figure 2.8: rTaxcpc vs Bot20/rGDPpci……….……….68
25. Figure 2.9: rTaxmpc vs Bot20/rGDPpci……….………68
26. Figure 2.10: rTaxcpc vs Top20/rGDPpc………69
27. Figure 2.11: rTaxmpc vs Top20/rGDPpc………...69
28. Figure 3.1: Expm/Expc vs rGDPpc………70 vii
29. Figure 3.2: Expm/Expc vs NuTaxp………70
30. Figure 3.3: Taxm/Taxc vs rGDPpc………71
31. Figure 3.4: Taxm/Taxc vs NuTaxp……….71
32. Figure 4.1: StdGrrExpcpc vs GrrGDPpc………72
33. Figure 4.2: StdGrrTaxcpc vs GrrGDPpc……….72
34. Figure 4.3: StdrExpc vs StdrGDPpc………72
35. Figure 4.4: StdrTaxc vs StdrGDPpc………....72
36. Figure 5.1: rPersExpcpc vs rTaxc/NuTaxp………...…..73
37. Figure 5.2: rPersExpcpc vs rTaxmpc………...…73
38. Figure 5.3: rPersExpcpc vs rTaxcpc………..……..74
39. Figure 5.4: rPersExpcpc vs rGDPpc………...…….74
40. Figure 6.1: rPrivInvInc vs EmpPriv………..…...75
41. Figure 6.2: rPubInvExp vs EmpPub………..…..75
42. Figure 6.3: rPubInvExppc vs EmpPub……….…76
43. Figure 6.4: rPrivInvIncpc vs EmpPriv………..…76
44. Figure 6.5: rPubInvExp vs rGDPpc………..77
45. Figure 6.6: rPrivInvInc vs rGDPpc…..………77
46. Figure 6.7: rPubInvExppc vs rGDPpc……….78
47. Figure 6.8: rPrivInvIncpc vs rGDPpc………..78
48. Figure 6.9: rPrivInvIncpc vs Top20pc……….79
49. Figure 6.10: rPrivInvIncpc vs Bot20pc………79
50. Figure 6.11: rPubInvExppc vs Top20pc………..79
51. Figure 6.12: rPubInvExppc vs Bot20pc………...79
52. Figure 7.1: PPDoctor vs rGDPpc……….80
53. Figure 7.2: PPDoctor vs rExpmpc………80
54. Figure 7.3: PPDoctor vs rExpcpc……….81
55. Figure 7.4: PPDoctor vs Top20/Bot20……….81
56. Figure 7.5: PPDoctor vs Bot20/rGDPpci………..82
57. Figure 7.6: PPDoctor vs Top20/rGDPpci……….82
58. Figure 7.7: PPDoctor vs Bot20pc………..83 viii
59. Figure 7.8: PPDoctor vs Bot20/rGDPpc……….…….83
60. Figure 7.9: SPTeacher vs rGDPpc……….…...84
61. Figure 7.10: SPTeacher vs rExpmpc………84
62. Figure 7.11: SPTeacher vs rExpcpc……….85
63. Figure 7.12: SPTeacher vs Top20/Bot20……….85
64. Figure 7.13: SPTeacher vs Top20pc/rGDPpci……….86
65. Figure 7.14: SPTeacher vs Bop20pc………86
66. Figure 7.15: SPTeacher vs Bot20pci/rGDPpci………86
Chapter 1
Introduction
The role and the functions of different levels of the government are controversial issues. However, it is commonly viewed that the government structure should be handled and contemplated carefully in the light of federalism and decentralization. In order to provide sustained growth and development – at least macroeconomic stability - in a market economy, one can claim that highly centralized and economically interventionist government structure should be transformed into one that encourages decentralized economic activities, whose functions are specified properly to complement markets.
Decentralization, which can be defined as the transfer of power and authority to local administrations, can improve the allocation of resources and make it more efficient by making the process of fiscal decisions closer to public preferences. In terms of allocation, the limited resources, available public goods, and the population preferences can be matched easier in a decentralized government than a centralized one. Fiscal federalism can be basically defined as the division of tax collection and expenditure assignments among different levels of the government. Decentralization and fiscal federalism both have political and economic aspects. Also, they have almost the same indications like the devolution of discretion from central to local levels and increasing importance of local levels in order to achieve an efficient allocation of resources.
Decentralization and fiscal federalism have recently gained importance. Political and fiscal decentralization is now under way in many countries and regions such as the
Central and Eastern Europe, China, former Soviet Union and Latin America. Economically, decentralization has become more important with the recognition that it is necessary to utilize public resources more efficiently now than in the past. Politically, it represents an attempt towards more privatization and liberalization.
There are two related but distinct theories about fiscal federalism and its economical benefits, traditional and new federalism theories. Allocative benefits of federalism are emphasized in traditional theories. Von Hayek (1945), who is one of the pioneers in this area, focused on the informational benefits of federalism. Because local governments have better access to local information, they can provide local goods and services more efficiently than the national government. Tiebout (1956) proposed a model of local finance that presents a chance to individuals to look for a community that is best suited to their tastes by providing a menu of outputs. This sorting mechanism, according to Tiebout, can be provided by inter-jurisdictional competition. Musgrave (1959) and Oates (1972) posited a theory of fiscal federalism stating that readjusting the tax and expenditure assignments between different levels of the government may result in improved welfare of the society. In order to improve the welfare and the policy responsiveness to the needs and demands, the transfer of more power and authority to elected local administrations is very important (Oates, 1972).
In this growing literature, we have recently faced with new theories. These new theories approach to the issue from a different perspective (such as Qian and Weingast, 1997). They have two new points of view. First is the question: Which circumstances foster the local government to maximize the local welfare? Second is approaching to fiscal issues in terms of the general relationships between government and economic agent by not assuming a benevolent government.
The basic implication of these new theories is that some types of federalism and decentralization can provide governments with better incentives to support market development and economic prosperity than others. Federalism, by devolution of authority from central to local levels, can prevent central government’s interventionist behaviors. The first mechanism to foster local government’s interest with economic prosperity is
that because of inter-jurisdictional competition, heavily interventionist local governments may loss valuable factors of production to less interventionist jurisdictions. Second, if the expenditures and revenues of local governments are strongly related to each other, then, the officials of the local government are required to support the local economy.
These theoretical approaches together with the empirical studies and research on different country cases have made this topic very popular. As people around the world are becoming more aware of the importance of influence and participation process in the decisions of their governments, all countries should respond to this demand sufficiently.
In this study, we try to shed light on local and central government relations in Turkey by inspecting the status of decentralization. Turkey has a strongly centralized government structure, which is inherited from Ottoman Empire and there is no specific or intended policy or program towards a more decentralized government structure as of today. In addition, there is no specific study about where Turkey stands in the framework of federalism and decentralization. However, as it is very important to know the present situation of Turkey in this framework, to formulate policies for the future and not to lag behind the general tendency toward decentralization in the world, this area should be studied carefully.
Based on the previous studies on budgetary systems of municipalities, which are main local government units in Turkey, we can say that local governments are highly dependent on the central government in terms of their fiscal structures. This can be observed easily, if we examine the juridical and fiscal procedures between municipalities and central government. Approval or prepermission of Ministry of Interior is needed for budgets, borrowings, pricing of services of municipalities and also for grants and transfers to municipalities. In addition to these fiscal inspections, Ministry of Interior has discretion on municipalities to demote the mayor and to appoint some bureaucrats directly. As a result of this lack of autonomy, the Ministry of Interior has recently changed approximately 75% of all the decisions of councils of municipalities (see Falay et al.). Moreover, taxes and tariffs cannot be adjusted against inflation and price and income movements such as property and environment cleaning tax rates are determined in every 5 years. Thus, own-revenues of municipalities in ratio of total revenues decreased to 20% after 1970 while it was 40 to 60% between 1925-1970.
Using a provincial data set, we empirically investigate firstly whether there is a tendency toward decentralization and secondly the expenditure and tax collection efficiency in Turkey. We first look at the bivariate relationships between relevant variables in order to constitute a general idea about their basic relationships. These guide us in our regression analysis. We then examine the multivariate relationships among our variables in the light of descriptive statistics. In the regression analysis, we expect to capture some of relationships that are either not very clear or not observed in the bivariate case. By examining the relationships of central and local expenditures and taxes with other budgetary efficiency variables, we get an idea about the present situation of Turkey vis a vis traditional theories. We are not able to apply the new theories to our case because we do not have sufficient data for the market structure and performance.
Our major findings reveal the following. While there is no significant trend towards expenditure decentralization in Turkey, we observe a slight trend towards tax decentralization. However, we also find that the lion’s share of the total taxes collected in a province goes to the central government while municipalities cannot increase their tax revenues as GDP increases as much as the central government can.
As a result of our examination of the relationships between expenditure and agricultural production, we observe a noticeable policy of less tax collection and more expenditure in regions where agricultural production is dense, which can be interpreted as a kind of compensation policy of central government. This compensation policy of less tax collection and more expenditure is also observed in priority regions for development and emergency state regions.
We observe a positive correlation between private investment incentives given by central government and income level. When we look at the responsiveness of the central government to shocks realized in the macroeconomic environment, we do not see any significant compensatory policy of the national government against the volatility in GDP.
The social indicators are helpful variables in terms of the understanding of budgetary efficiency of governments. In this study, we use two social indicator variables, which are health measured by people per doctor and education measured by students per teacher. In case of health, our findings indicate that municipal and central spending are not enough in the provision of health services to individuals that belong to different
income groups. In case of education, again there is a slightly significant uneven distribution, though the local and central governments’ education spending are more fair across provinces than in the case of health.
As we do not have an access to all the necessary data for time-series analysis, specifically constrained by local governments data, we were not able to conduct the detailed analysis that we wished to. Because of limited data, we perform a cross-sectional analysis by using the data from the last decade. Since we do not have time-series analysis, however, we have difficulty in interpreting some of the results and we cannot observe the time behavior in our major variables.
In chapter 2, the theory about fiscal federalism and decentralization and central and local government structures is described in more detail. Descriptive statistics focusing on the bivariate relationships between the variables is in chapter 3. The methodology and regression analysis are described in chapter 4. Chapter 5 is the conclusion.
Chapter 2
Theory and Background
The aim and the fundamental reason of the existence of government is the maximization of social welfare as individuals’ aim is utility maximization, firms’ aim is profit maximization and politicians’ aim is vote maximization. Because, day by day, the market structure has grown and these markets need to have a regulatory power, the need for government has increased and it has became an inevitable phenomenon in the economic life. On the other hand, the uncontrolled growth of markets has made the distribution of income unfair. This causes the government to behave as a social regulator in the society. In our century, the social and economic role of government in the society and its functions and structure are debatable topics. The vertical structure of the public sector has important implications for the way in which government functions. It affects the kind of government services, how they are financed, the potential for innovation and even the overall size of government. We can summarize all these with some questions as the following: what is the need for government? What is the role of government in the economy? How should the functions be distributed among different levels of the government? How should the revenue and expenditure structures of them be? etc.
In section 2.1, the basic role of the government is presented. The allocation of functions among different levels of government is in section 2.2. Section 2.3 is about the
key elements of local administrations. We describe the theoretical perspectives on the benefits and costs of decentralization in section 2.4. Local government structure in Turkey is in section 2.5.
2.1 The Role of Government
Market failure is the basic reason for the need for government. Reaching an optimal allocation of resources rising from individual decision-making is a difficult process. Some classical and well-known assumptions should be made, such as informing people about the choices open to them, no monopoly power, no externalities, no public goods and perfect mobility of capital and labor.
Government intervention may also be necessary to secure the desired distribution of income. The Pareto criterion, being concerned only with economic efficiency, does not concern distributional issues. Since markets cannot produce the desired distributional outcome easily, governments have a key role in redistribution.
The most basic rationale for government intervention is the failure of market mechanism, there are other reasons like externalities and public goods provision. However, the government action does not guarantee a better situation. This depends on the capacity of government to respond sensitively to the needs and preferences of individuals and communities, and on its ability to obtain and process the necessary information. These possibilities limit the ability of governments to respond the market failure.
The possibility of improvement of failures with the help of the government intervention varies from case to case. An important element in the ability of governments to process information and to make appropriate decisions is the organizational structure of government. This is one of the main crucial things to think about in terms of decentralization.
The information processing of particular individuals or communities is healthier in decentralized governments. Politically and democratically more decentralized governments may also be more capable in reflecting the preferences of individuals. However, both of these advantages of decentralization must be weighted against the advantages of centralization in terms of administrative economies of scale, and against the need for central or national solutions to some of the problems of market failure.
Different policy targets bring different weights and determine the allocation of particular functions to central or local level. The proper degree of decentralization independent of the characteristics of the goods and services provided does not have a certain answer. Decentralization itself is neither good nor bad. The issue is whether it is successful or not (see World Bank, World Development Report, 2000). Successful decentralization improves the efficiency and responsiveness of the public sector while accommodating potentially explosive political forces. Unsuccessful decentralization threatens economic and political stability and disrupts the delivery of public services. The success of decentralization depends on its design.
2.2 Allocation of Functions among Levels of the
Government
In order to understand decentralization of government and the rationale behind a decentralized government better, we should basically try to specify the functions of the different levels of the government. In the existing public-finance literature, a popular approach to this issue makes use of Musgrave’s (1959) tripartite division of the public sector. Considering each of Musgrave’s three functions of the public sector will be helpful to capture the idea of decentralization.
Macroeconomic Stability:
The proper form and scope of macroeconomic policies to stabilize the economy at high levels of output and employment together with reasonable price stability is a very controversial topic of today as well as the past. In spite of this controversy, it can be claimed that the exercise of counter-cyclical policy must rest with the central government.
This claim is has two aspects. First, the basic control over the money supply and credit is exercised by central government in nearly all countries. If each level of government has the right of creating and destroying money, there would exist a powerful incentive for local governments to finance their purchases of goods and services with local taxation. The aggregate result would obviously be a rapid national monetary expansion with concurrent inflationary pressures.
Second, regional or local economies tend to be highly open such that they import and export relatively large shares of the goods that they produce and consume. Such openness implies serious constraints on the capacity of decentralized governments to be responsible for counter-cyclical fiscal measures. If a local government, for example, were to undertake a substantial tax cut to stimulate the local economy, such an event happens that most of the newly generated spending would flow out of the local economy in payment for goods and services produced elsewhere with little ultimate effect on local levels of employment which is the main aim of the tax cut.
In brief, the absence of monetary rights and the openness of regional or local economies suggest that the potential for effective macroeconomic stabilization policy is quite limited at decentralized levels of the public sector. Thus, the central government having broad monetary and fiscal powers should have the primary role for an active counter-cyclical policy.
Income Distribution:
The other function of the public sector is the redistribution of income to achieve a socially just outcome. This typically implies a transfer of funds to low-income households to reach a somewhat more equal distribution of income. Again, local levels have some serious constraints to achieve this objective. First, when we think of in terms of perceiving poor relief and the well being of the poor elsewhere as a national goal, purely local policies cannot cover the income transfers throughout the nation that is the way should be pursued. Redistributive measures from this perspective are a “national public good” that requires a central-government presence.
Second, the capacity of decentralized governments to redistribute income can be limited by the potential mobility of households and firms. If a local government, for example, were to undertake program to redistribute income equally among poor and rich people, it would create compelling incentives for high-income people to move elsewhere and for low-income people to immigrate into the jurisdiction. Thus, such movements create a process that is not desirable from the perspective of most jurisdictions.
The Provision of Public Goods and Services:
Decentralized levels of government have their primary rationale in the provision of public goods and services. There are certain public goods, like national defense and
foreign policy, which benefit all members of a nation, that the central government is obviously the appropriate agent for providing such national public services. In contrast, the responsibility of many other public services belongs to local governments, including such things as refuse-collection system, local fire protection and many others. For such services, there is a compelling argument for decentralized provision. Centralized control tends to result in relatively uniform levels of services across local jurisdictions.
Decentralized provision of services, in contrast, provides the scope for adapting levels of output to the circumstances and tastes of individual jurisdictions. People suggesting the local control over these local goods and services say that the magnitude of the welfare losses from the uniform provision of public services can be quite sizeable and the levels of local services should be adjusted to the tastes of local constituencies.
2.3 Key Elements of Local Governments
Local accountability, fiscal autonomy and decentralization are the most important concepts in local government literature. How they are defined and measured, however, is debatable. The issues of local autonomy and local accountability are closely linked because the main reason for giving local government some fiscal jurisdictions is to encourage local accountability. Local accountability can enable promoting a more efficient allocation of resources and encouraging cost containment at the local level. This is the main rationale of decentralization.
Local accountability requires that the revenue to finance locally determined expenditures should be passed on to the local electorate either through taxation or user charges. This process becomes easy, if local governments have their own tax resources and are able to fix the tax rates by reference to the level of local services asked for by their local electorates. On this basis, it has been argued that there is a case for relatively large local taxes to finance, such as grants, over which the local government authorities may have little or no control. Thus, local government should be accountable to the local electorate.
Local fiscal autonomy depends upon the degree of discretion available to local government. Autonomy refers to revenues, grants or expenditures. Fiscal autonomy requires that local governments should be able to change the level and composition of its
overlapping taxes, non-tax revenues, shared taxes, general-purpose grants and specific grants. In practice, most of these instruments are subject to detailed controls by central government. For example, own taxes are almost always subject to constraints on the base and rates. In terms of autonomy, different kinds of grants offer different degrees of discretion to beneficiary governments. There are also different kinds of grants such as project specific grants, general-purpose grants and sector specific grants. The nature of the expenditure programs carried out by local governments is important in terms of local autonomy. Decision on the allocation of functions is the first way in which central government influences local autonomy over expenditure. Central government can constrain local autonomy by setting specific standards for each function that is carried out by local government. In education, for example, central government may determine the curricula, set ratio of teacher to pupil, teaching standards, etc. Here local government has no or little discretion and merely acts as an agent for carrying out centrally determined policies. Central government may leave local authorities entirely free as to whether or not they provide certain services and, if they do, the way in which the service is implemented.
Fiscal decentralization can be approached in three ways in the local level. The first is to decentralize the share of taxing and expenditure responsibility of lower levels of government. For example, in Denmark, local governments have substantial social welfare expenditure responsibilities as well as authority of taxing powers. It is hypothesized that local government shares of total taxes and expenditure is a good measure of the extent of this type of decentralization (Owen and Panella, 1991). The second approach is to decentralize expenditure responsibility but not the taxing authority, and to finance the gap with intergovernmental grants. Under this approach to decentralization, it could be expected to observe a higher sub-national government expenditure share, a smaller tax share, and a greater dependence on grants. The third approach is administrative or political decentralization of central government activities, i.e., giving more fiscal discretion to regional offices of various ministries or departments, involving local governments more directly in decisions regarding the allocation of central funds within region, etc. The third approach may not be quantified easily, but the statistical annex
provides information about the shares of different levels of government in overall revenue and expenditures.
Although we mention about the decentralization and fiscal federalism above in the framework of government structure and functions, a brief literature survey will also be given below.
2.4 Theories of Decentralization and Federalism: The
Traditional and New Perspectives
Two different but related theoretical perspectives examine the economic effects of decentralization. Efficient allocation of scarce resources is the basic problem in this area. The traditional theories emphasize this point for informational reasons. There are two related ideas. The first one belongs to Hayek (1945) stating the crucial advantages of local decision-making process in terms of best using the local information. As the local conditions and the problems are known better by local governments than the national government and the transfer of information is problematic, local governments can have a better role in providing the local goods and services than the national government.
The second one is of Tiebout (1956). He presented a simple model, which yields a solution for the local level of expenditure for local goods that reflects the preferences of the individuals more adequately than can be reflected at the national level. His approach focuses on the inter-jurisdictional competition. According to Tiebout, this kind of competition among local governments on local expenditure allocation presents an opportunity to the residents to look for a community that is the most suitable one for themselves in terms of the provided local goods. In a centralized government structure where the provision of public goods is uniform, this kind of segregation mechanism cannot be achieved. Inman (1988), Buchanan and Brennan (1980) showed that inter-jurisdictional competition approach of Tiebout could limit local governments’ behaviors. In the light of these ideas, Musgrave (1959) and Oates (1972) constituted a theoretical perspective of decentralization stating that there can be achieved an improvement in the welfare of society by making appropriate assignments of taxes and expenditures to the various levels of government.
Following a large literature in this area, there appear some new approaches to this issue that emphasize the ignored aspects of the benefits of decentralization (McKinnon, 1997; Weingast, 1997). Weingast and Qian in their paper (1997) ask the following question: how do governments commit to providing efficient local goods and preserving market incentives? They apply the theory of firm to address a range of problems in federal systems. The new theories do not accept the assumption of benevolent government with full commitment power. They mainly tackle the general regulation over economic activities or the state-market relations. Also they point out that very powerful and not controlled government intervention may be very harmful and malevolent to market preservation and regulation.
There are some important differences between new and traditional theories as the new theories concern with government incentives and state-market relations more than the traditional one. The main difference is in the transfers between central and local governments. The traditional theory, assuming benevolent government, claims that expenditure decentralization should be realized because of informational benefits of local levels. But it also considers the probability of the creation of bad allocation and the restricting of fiscal power of central government, which maintains the macroeconomic stability and equality among regions may be harmful for economic prosperity purposes. Because of these concerns, traditional theory says that the dependence of local governments to their own revenue collection to finance their expenditure is undesirable. Sizeable transfers from central to local governments are considered necessary to finance the expenditures of local governments.
The new federalism theories, in contrast, are more concerned with government incentives and focus on the importance of linking the financing local expenditures to the own revenues of local governments in order to attract the attention of them to local economic prosperity. According to new theories, the revenue distribution made in the spirit of traditional theories is harmful both to government’s positive incentives and its financial discipline. The scenario also provides that the local governments’ officials are responsible for their actions in the expenditures but in traditional theories, when the transfer revenue is the large portion of total revenue of local governments, the officials may perform the expenditures carelessly and inefficiently.
Strong fiscal incentives together with limited transfers from central government can foster local governments to realize the market reforms better. Zhuravskaya (1998), by using a simple model, examined the effects of the fiscal incentives for local governments on markets. First finding is that the strong fiscal incentives encourage local governments to put fewer restrictions on non-state enterprises. As more restrictions on enterprises reduce the revenue that is obtained by local governments, they increase their revenues by making restrictions flexible. Second, local governments facing with strong incentives try to make state-owned enterprises more productive and well performing. Third, because local governments obtain limited transfer, they make their expenditures and investments more carefully and they tend to provide more productive local goods and investments.
In China, which has realized an extensive reform, Weingast, Hehui and Qian (1999) showed that local governments are faced with strong fiscal incentives to pursue market reform. They find a strong correlation between local government’s revenue collection and expenditures. They also find that the reform improves horizontal distribution across provinces in budgetary spending. As in the case of Russia, stronger fiscal incentives imply better economic performance, faster development of non-state enterprises and more reform in state-owned enterprises.
Dillenger and Webb (1999), in their paper concerning fiscal management in Colombia, observe a problematic case of decentralization trial. Because of the defective design of decentralization, Colombia has experienced some weakening of macroeconomic performance especially in the last decade. The decentralization has led to some problems, both in maintaining fiscal balance at the national level, as resources are transferred to sub national levels, and in preventing unsustainable deficits by the sub national governments. The problems have appeared because national government interference prevents departments from controlling their costs and because sub national governments have come to expect debt bailouts. Briefly, the fiscal problems of the national government in the 1990s mostly originated on the spending side for items not related to decentralization. The requirement to share all revenues with the sub national governments meant that the national government could not balance the budget just by raising taxes. The continued increase in transfers to the municipalities made the problems of the center worse.
This is a bad application of traditional fiscal federalism theory. Because it foresees expenditure decentralization but not revenue decentralization and it proposes to finance the local expenditures mostly with central transfers for the allocative and distributional purposes of the national government. However, in the case of Colombia , because of not determining all the arrangements and rules about the transfer system, this causes the creation of soft budget constraints for local governments, which means that they have come to expect debt bailouts by central government. In order to control sub national indebtedness, the national government of Colombia is currently working through both the borrowing-demand and the credit-supply channels (Webb and Dillenger, 1999).
2.5 Local Governments in Turkey
Decentralization issue is widely debatable in Turkey because the relationships between central and local governments appear mostly inefficient (see Falay, Kalaycıoğlu and Özkırımlı, 1996). In contrast to most developing countries, Turkey currently does not have a specific program for a more decentralized government structure. When compared with the industrialized countries, Turkish government seems highly centralized. While sub-national levels of government are responsible for over 35 percent of total government expenditure in industrialized countries, in Turkey the underlying figure is about 10-11 percent. This percentage is between 12 and 15 on average in Latin American countries (Stein, 1997). Although, in the last decade, for example, decentralization tendency in Latin America is strong, in Turkey the percentage value decreased to 10.2 in 1998 from 11.7 in 1995.
In Turkey, municipalities are the main units in terms of representation of local government structure. Fiscal governance and budgetary process of municipalities became more apparent and important as a consequence of the increasing importance and problems of provinces. This increasing pattern enforced central government to take some financial, discretionary and legislative precautions. There was an attempt in 1984 to improve the political and economic structures of the municipalities, which is the enactment of the ‘Statue concerning the administration of metropolitan municipalities’ (Act No. 3030). However, by now, it has been realized that this act is not the proper remedy of the existing problems (Falay et al., 1996). There were also some attempts to improve the budgetary structure of local governments but again they could not solve the
problems completely. According to Falay et al. (1996), local governments are not strong enough in terms of possessing financial resources and generating new resources. Local governments’ budget revenues are not enough because the shares that they take from central government’s total tax revenue is not enough and they have no discretion of creating new income sources.
In terms of budgetary magnitude, Turkish local governments include villages, provincial offices and municipalities. Villages, provincial offices and municipalities cover financially 1%, 14% and 85%, respectively, of the total Turkish local governments’ budget. Villages are local government units in which most of the services are provided by other local government units. On the other hand, municipalities are the main parts of the local governments.
According to a report by the State Planning Organization (2001), provincial offices, on average, gave 15% of the budgetary surplus between 1983 and 1998. While provincial offices were working with surplus, on the contrary, municipalities were in budgetary debt in all years and made an extra 6 % expenditure, on average, in addition to their budgets.
As of the end of 1995, the number of municipalities was 2802. This number increased year by year and it reached 3227 at the end of 1999. In Turkey, the urbanization rate is 66% and the ratio of people living in municipalities is realized as 81% in 2000. Similarly, 40% of the total population lives in metropolitan municipalities.
Revenue side
Local governments in Turkey have three main sources of revenue. The first one is the Shares Taken from Consolidated Budget Tax Revenue (STCBTR) for provincial offices and municipalities, the second is self-revenues and the third is borrowing. The allocation of the first part of the revenues is as follows:
• 6% to municipalities according to population, • 1.14% to provincial offices,
• 3% to municipalities fund,
• 0.25% to local governance fund, (Local Governments Fund) • 0.28% to provincial offices fund,
0.53% of revenues for local governance fund allocated as follows: • 0.35% to local governance fund (Ministry of Interior Affairs),
• 0.18% to local governance fund (Ministry of Public Works and Housing), Metropolitan municipalities also take 5% revenue from STCBTR. There are also other types of funds such as ministry of Culture fund, touristic municipalities fund and environment cleaning fund.
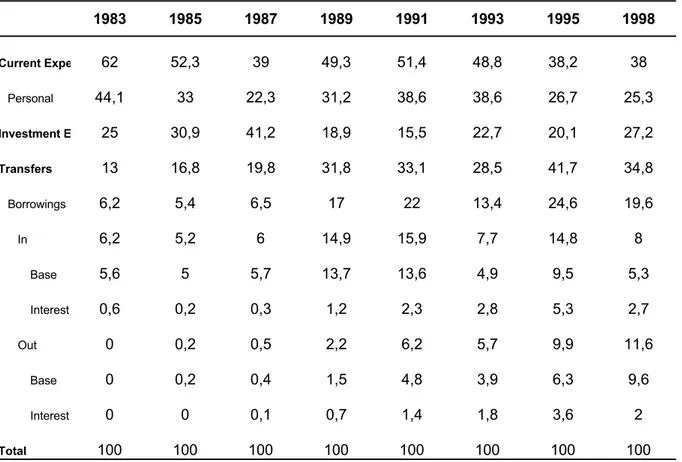
According to the budget structure (Appendix 2, table B), revenues can be separated into three parts: tax revenues, nontax revenues and borrowings. While revenues from STCBTR under tax revenues includes transfers from central governments, local taxes and nontax revenues constitutes the own revenues. Borrowings are financed from two sources: domestic borrowing and foreign borrowing. This part of the revenues has showed a continuously increasing pattern that it was approximately 8% of the total revenue in 1983 but it increased to 20% in 1998.The municipalities basically pay the second one back but these borrowings are guaranteed by the Treasury. These revenues are included in self-revenues. Municipality revenues significantly increased between 1983 and 1998. After 1980, revenue system of municipalities, which were basically financed by transfers from center and self-revenues, started to use borrowing as another source of financing. The ratio of borrowings in the whole budget was 8% in 1983 but it increased to 20% level in 1998.
The STCBTR constitutes on average, 45% of the total revenue of municipalities. This figure is 54% for metropolitan municipalities and 40% for other municipalities. The 45% percent of tax transfer from center is similar to that of the developed countries. If we think in terms of reaching to the national target of prosperity over the country and preventing the income distribution differences across the country, this ratio is normal. Thus, local governments should be compensated financially by central government according to their needs. Even if the transfer ratio from the center is at ideal level, which is assumed as the level of developed countries, the amount of total revenues of municipalities are not enough to balance the expenditures and they persistently incur debt in their budget because of this inadequate revenue sources.
There are basically two remedies of this problem and one of them may be applied in Turkey to solve this crucial problem. First, the tax transfer ratio from center should be
increased to a level that is sufficient for municipalities to balance their budget. Second, new revenue sources should be created for municipalities and the necessary financial and legislative regulations should be made (see also, Falay et al.).
Expenditure Side
According to budget structure, municipality expenditures can be separated into three: investment, transfer and current expenditures. Each category has an important sub-category: structure building; debt service and personal expenditures have priority in these expenditure breakdowns, respectively (Table C).
At the beginning of 1983, the ratios of investment, transfer and current expenditures were 25%, 13% and 62%, respectively. In 1998, however, it became as follows; 27%, 35% and 38%, respectively. For current expenditures, the ratio of personal expenditures was 44% in 1983 but it decreased to 25% in 1998.
Chapter 3
Descriptive Statistics and Data
Turkey has a highly centralized government that is inherited from the Ottoman Empire. We can also say that in our traditional system, it is very important to have a hierarchical structure among the discretions of different levels of the government. However, as the need for local goods provided by local governments increases, there has been an increase in importance of local governments, which are the main units of administrations responsible for local needs. In this study, we attempt to examine Turkey’s recent situation in terms of this important process by looking at the local-central government relationships.
In our study, we compile a large provincial data set and produce descriptive statistics on the local and central governments of Turkey. There are currently 81 cities in Turkey with the addition of new ones. We try to reach all necessary data for our analysis. However, especially for new cities and for some variables, we do not have an access to all time-series data. In order to make the representation of this data easier, Appendix 1 provides the list of variables, abbreviations, data ranges, data sources and availability of data for each province. In the remainder of this chapter, we mainly examine basic relationships between these variables.
We first delineate the economic activities of local-central governments with the help of some descriptive statistics. To do that, we specifically look at the relationships between expenditures and revenues of both local and central governments with the level of per capita GDP, agricultural value added and income indicators such as the ratio of top %20 income to bottom %20 income (available for only 19 large cities). We also examine
the relationships of various breakdowns of government spending with the level of per capita income and its distribution. In addition, we look at the correlation between social indicators, which are education and health, and other budgetary variables. These relationships help us to understand the dimensions of the existing problems as well as to produce some hypotheses about them. These will guide us when we perform the regression analysis.
3.1 Central and Municipal Expenditures
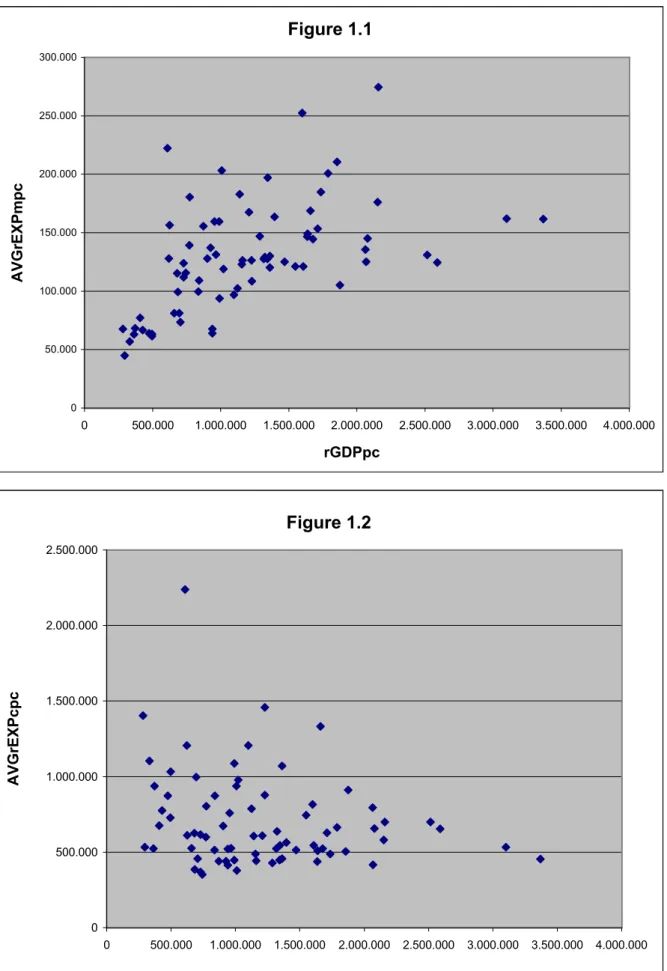
We first examine the expenditures of the central government and local municipalities across the provinces. To do that, we look at the average of real per capita budget expenditures of both center Avg(rEXPcpc)i and municipalities Avg(rEXPmpc)i. We plot (Avg(rEXPcpc)i and Avg(rEXPmpc)i) versus real per capita gross domestic product (rGDPpci) (Figures 1.1-1.2). We observe that while rGDPpci is increasing, the average expenditure of center is slightly decreasing. This negative relationship is intuitive and reflects efficiency in the sense that it appears as government allocate more expenditure to provinces with lower rGDPpc. However, in the municipality expenditures case, we see a positive relationship, which either means that municipalities in higher income provinces spend more or that in provinces where municipalities spend more, income becomes higher. These results give some hints about the segragation of communities according to their income that is implicated by Tiebout model.
The expenditure side of decentralization is very important because unless local governments have autonomy over their expenditure, decentralization process cannot be realized properly. In this conjunction, we next plot real per capita expenditures of municipalities (rEXPmpc) versus real per capita budget expenditure of the central government (rEXPcpc) (Figure 1.3). We cannot see any relationship between them. In a country pursuing a decentralization process in terms of expenditure autonomy, we expect a negative relationship between central and municipal per capita expenditures (Webb, Dillenger, 1999). As we do not see a negative correlation in Turkey, we may say that Turkey’s expenditure policy is not sufficiently in favor of decentralization.
In order to find the relationship between agricultural value added and expenditures, we plot them and we observe a slightly positive relationship between per
(Avg(EXPmpc)i versus Avg(rVAagrpc)i) (Figures 1.4-1.5). In the case of per capita real expenditure of center versus per capita rVAagr, we do not see any relationship. The positive relationship in the case of municipalities means that in agricultural regions, the role of municipal budget expenditures is higher than others. We also look at the real per capita investment expenditure (rInvEXPcpc) versus rVAagrpc and we come up with a slight negative relationship (Figure 1.6). This means that agricultural regions may be getting less investment spending than others.
We also look at the relationship between expenditures and the number of taxpayers (NuTAXp). In per capita expenditures, there is no relationship between rEXPcpc and NuTAXp and there is a positive relationship between rEXPmpc and NuTAXp (Figures 1.7-1.8). If we think of the number of taxpayers as the magnitude of registered economy in a province, then we observe that when it increases, the municipality expenditures of that province also increase.
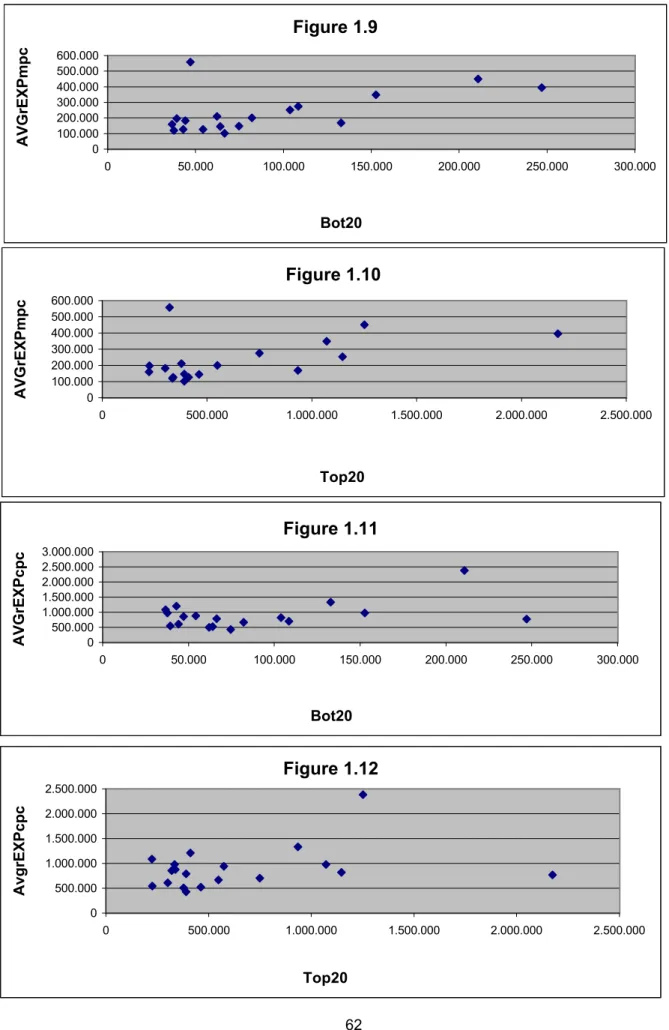
Income distribution is a very crucial concept in the context of budgetary efficiency. The relationships of our variables with the indicators of provincial level income distribution yield us significant hints about budgetary efficiency. There is a positive correlation between per capita income of top and bottom 20 % of households and per capita real budget expenditures of municipalities but there is no correlation for central expenditures (Figures 1.9-1.10 and Figures 1.11-1.12). Positive relationship may be interpreted in two different ways. First, when people become wealthier they receive more and this is not a good result for efficiency. On the other hand, when expenditure increases across provinces, wealth of people improves then this is an efficient result. Since our study does not involve time series analysis, we are unable to address these two directions of the reasoning.
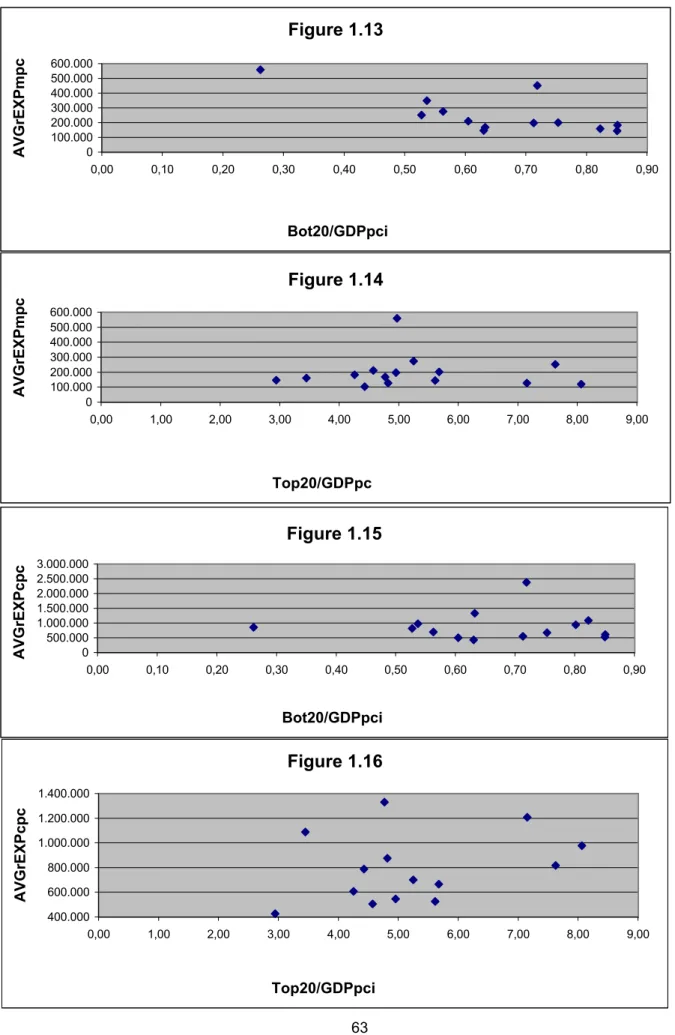
Instead of income of top and bottom % 20 (Top20 and Bot20), we can use the ratio of Bot20 to rGDPpci (Avg(Bot20/GDPpc)i) and the ratio of Top20 to rGDPpc of Turkey (Avg(Top20i/GDPpc) as variables for income distribution. For real per capita municipality expenditures, there is a negative relationship with Avg(Bot20i/GDPpci), but in Avg(Top20i/GDPpci) case, there is no relationship (Figures 1.13 and 1.14). For real per capita central expenditures, there is no correlation with Avg(Bot20i/GDPpci), but in Avg(Top20i/GDPpci) case, there is a slightly positive relationship which may be an
indication of inefficient budgetary expenditure pattern across provinces (Figure 1.15 and 1.16). However, due to small number of data points, we need to interpret the above results, which are based on income data of 19 provinces only, with caution.
3.2 Central and Local Tax Revenues
We secondly examine the characteristics of local and central tax revenue collection. The relationship between average of real per capita tax revenue for both central and local governments (rTAXcpci and rTAXmpci) and rGDPpc is positive (Figures 2.1-2.2). This is expected because when people have more income, they should pay more tax and this indicates the above result. We also observe that when the number of taxpayers increases, central and municipal real per capita tax revenues increase (Figures 2.3-2.4). This positive relationship is also valid for both government levels, if we use tax revenue per taxpayer instead of tax revenue (Figures 2.5-2.6). In addition to this, when we plot real per capita tax revenue of municipalities versus real per capita tax revenue of the center, we get a positive relationship between them (Figure 2.7). This result is expected because they are both increasing in income.
We next examine tax revenue relationship with income distribution indicators. Negative relationships are observed both between Bot20pci/GDPpci and rTAXcpci and Bot20pci/GDPpci and rTAXmpci (Figures 2.8-2.9). However, there is no relationship between rTAXmpci and Top20pci/GDPpc (Figure 2.11). We see a slightly positive relationship between rTAXcpci and Top20pci/GDPpc (Figure 2.10). We expect positive relationships between these variables because when people become richer, they should give more tax to both central and local governments. Our results are against expectations because while Bot20 income is increasing, the amount of tax that they pay decrease. In addition, we do not see the strongly expected positive relationship in Top20 income case. This shows that in Turkey, the wealth you have and the tax amount you pay are not correlated properly.
3.3 Measures of Decentralization
We define the ratios of expenditure of municipalities to expenditures of center (EXPm/EXPc) and tax revenue of municipalities to central tax revenue (TAXm/TAXc) as the measures of decentralization. When we look at the expenditures separately, we see
that rEXPcpc is negatively related with rGDPpc and rEXPmpc is positively related with rGDPpc (Figures 1.1-1.2). Then, we observe that the expenditure ratio is positively related with rGDPpc (Figure 3.1). This result is intuitive due to the observations made on the preceding sentences. rEXPmpc is positively related with the number of taxpayers (NuTAXp) but rEXPcpc and NuTAXp relationship is slightly negative (Figure 1.9-1.10). The ratio of expenditures is positively related with the number of taxpayers (Figure 3.2). This result is also intuitive as a result of individual relationships between expenditures and NuTAXp. This is an indicator of municipalities being more responsive for the local needs and demands than the central government.
If we examine the tax revenue side, we see a negative relationship between TAXm/TAXc and both rGDPpc and NuTAXp (Figures 3.3-3.4). Tax revenue increases in both rGDPpc and NuTAXp and for both government levels (Figures 2.1-2.2-2.3-2.4). However, negative relationship in tax ratio tells us that tax revenue of municipalities increase in both rGDPpc and NuTAXp less than that of center. Thus, municipalities appears to have little ability or capacity of collecting taxes, or, generally, collecting own revenue. This is an important result about the efficiency of local governments while they are performing their budgetary practices. This result intuitively shows that decentralization had not been realized to a great extent in Turkey.
3.4 Volatility Measures
Another kind of variable that is important for fiscal policy and its efficiency is the volatility or variability of our variables. How central government has reacted to shocks occurring in the economy shows the responsiveness of the government to these shocks. Volatility in rGDPpc (STDrGDPpc) and in rGDPpc growth rate (STDrgrGDPpc) are our main variables with which we can observe the shocks or changes in economic environment. In our analysis, when we plot volatility in real per capita growth rate of central expenditures (STDrgrEXPcpc) versus STDrgrGDPpc, we do not see a relationship (Figure 4.1). The relationships of volatility variables with real tax revenue and real expenditures of central government are also ambiguous (Figures 4.2-4.3-4.4). Thus, we can say that the volatility in expenditures of central government is not associated with the volatility of the underlying macroeconomic environment.
3.5 Government Size
Government size is generally defined as total government expenditure in percentage of GDP in public finance literature. Similarly, we define a subset of total government expenditures, which is personal expenditure, as an indicator of government size. In our study, we try to investigate whether there is a correlation between real per capita personnel expenditure (rPersEXPcpc) and real per capita tax revenue; rGDPpc; and the ratio of real tax revenue to number of taxpayers (rTAXc/NuTAXp). We find a slightly positive correlation between rPersEXPcpc and rTAXc/NuTAXp (Figure 5.1). This result is intuitive in the sense that in provinces where the state’s real per capita personnel spending is higher, tax collection appears more efficient. However, this causality may be interpreted also like that more tax revenue per tax payer may also result more employment opportunities. There does not appear to be any relationship between rPersEXPcpc and real per capita tax revenues of central and local governments (Figures 5.2-5.3). This says nothing about tax collection efficiency. However, we observe a negative correlation between rPersEXPcpc and rGDPpc (Figure 5.4). Thus, it is possible to say that in the richer areas, the government size tend to be smaller than poorer ones.
3.6 Investment Spending
As a breakdown of spending, we examine the public investment expenditure and private sector investment incentives (PubInvExp and PrivInvInc). The most important efficiency indicator under this topic is the number of employed people as a result of these investments (EMPpub and EMPprvt). According to our data, the relationship between real aggregate private investment expenditures and the resulting number of employed people is positive as expected and this indicates efficiency in private investments incentives (Figure 6.1). However, in the case of public investment expenditures, there is no correlation (Figure 6.2). When we plot the same graph with per capita investments, we get the same results (Figures 6.3-6.4). We next try to connect both real per capita investment expenditures with rGDPpc. In this case, we do not observe significant correlations between them except the positive relationship between rGDPpc and rPrivInvIncpc (Figures 6.5-6.6 and Figures 6.7-6.8). This positive relationship indicates that private incentives are higher in richer areas. We next check whether there is a
relationship between real per capita investment expenditures and Bot20pc and Top20pc. We get no significant relationships among them (Figures 6.9-6.10 and Figures 6.11-6.12). Thus, only the number of employed people as a result of private investment incentives appears significant for our analysis. Then, we may conclude that private sector investment incentives are more efficient than public investment expenditures.
3.7 Social Indicators
Lastly, we examine the connection between some crucial social indicators and our other budgetary variables. We have two different social indicators, which are the number of students per teacher (SPTeacher) and the number of people per doctor (PPDoctor). The education index does not vary much across provinces. However, a slight negative relationship with rGDPpc shows that people in richer areas have better education opportunities across the provinces (Figure 7.1). There is no significant correlation between education index and real per capita expenditures of central government (Figure 7.3. However, we have a slightly negative relationship education and municipal expenditures (Figure 7.2). For both of the income distribution variables, there is no correlation with Top20/Bot20 (Figure 7.4), Bot20pci/GDPpci (Figure 7.5) and Top20pci/GDPpc (Figure 7.6). There is a slight decrease in it, however, with the increase in Bot20pc (Figure 7.7) and Bot20pc/GDPpc (Figure 7.8) variables. These observations indicate that the government’s education spending is rather even across the provinces of country.
With health indicator, on the other hand, we observe strong relationships. Firstly, it decreases with the increase of rGDPpc (Figure 7.9). When we plot PPDoctor versus rEXPmpc and rEXPcpc, we observe negative relationships between them (Figures 7.10-7.11). PPDoctor is decreasing with almost all income distribution variables (Figures 7.12-7.13-7.14) except Bot20pci/GDPpci (Figure 7.15). As a result, the findings can be interpreted as people who are wealthier than others have better health opportunities across the provinces of the country. Thus, we may conclude that public spending on health may not be accommodative of all income groups in an even way.
Chapter 4
Methodology and Regression Analysis
4.1 Methodology
In this chapter, we empirically analyze the determinants of variables related to budgetary efficiency in Turkish provinces. In order to do this, we regress these budgetary variables on some other explanatory variables. Our basic variables are municipal and central expenditure, tax revenues, GDP, education and health indicators. However, by using these basic variables, we obtain different set of variables, such as expenditure and tax ratios, volatility in GDP and in central expenditure. Thus, we have about 20 variables together with the mentioned ones generated from the basic variables. Table 4 in Appendix 2 includes all data that we use in regression analysis.
Initially, we intended to do a panel data analysis but due to the difficulties in obtaining some of the data for the last decade, we use only a cross-sectional analysis in the current study. As we have time-series data for some of the variables, we used yearly average of these data in the regression analysis1.
---1
for example, we have real per capita central expenditure data of each province for 10 years but in our data set, we take the average of these 10 years data and then use it.
In order to be able to interpret the results, we use real and per capita values for our data. In addition to this, in order to avoid the scale problems in our regression analysis, all variables are converted into logarithmic scale except those appearing in ratios such as decentralization measures and income ratios of top and bottom. In our regression analysis, we also use two different dummies, which are OHAL (Emergency State Regions) and KOY (Priority Regions for development), as control variables. Moreover, all regressions are white-heteroscedasticity consistent and robust.
An important note is that income distribution variables are available only for 19 of the 81 provinces in our regressions. Hence, this obviously poses a problem of the loss of degrees of freedom. Table 1.b and 2.b in Appendix 2 present the results of our regressions conducted by adding the income distribution variables to the variables in Table 1.a and 2.a. Because of lack of degrees of freedom, the results obtained from these regressions are not comparable with the ones obtained without using income distribution variables. Also, we observe that different data sources give different data for the same variables and for the same years1. In addition, there appear measurement problems with some data2.
4.2 Regression Analysis
4.2.1 Central and Municipal Expenditures
In order to understand the multivariate relationships among central and municipal expenditures and other variables, we make regression analysis. These regressions are reported in the first three columns of Table 1.a and 1.b. When we regress central expenditure on rGDPpc, Vaagr, Taxc and income distribution variable, we observe significant results. The relationship between Expc and rGDPpc is negative and significant as observed in the graphical analysis. This result indicates expenditure efficiency in the sense that central government expenditure is high in lower GDP regions. However, the causality may also be vice versa.
---1 for example, State Planning Organization and General Directorate of Public Accounts give different values for investment expenditures. We use the first ones’ data because it gives the breakdowns of the investment expenditures as public and private.
Positive correlation between agricultural production and central expenditure may be interpreted as there is expenditure compensation to the regions whose agricultural production is high. In addition, the dependence of central expenditures to central tax collection can be recognized easily. In the regression of central expenditures on municipal expenditures, the relationship between these two variables is significant and positive. We also observe similar relationship in the graphical analysis. In countries, which are decentralized in terms of expenditure, this relation is negative but in Turkey, we do not see any negative relationship. In addition, we used two different dummy variables which are OHAL (D1, Emergency State Regions) and KOY (D2, Priority Regions for Development). In central expenditure case, OHAL’s and KOY’s coefficients are positive and significant indicating more expenditure for OHAL and KOY as expected (Table 1.a).
We then regress EXPm on rGDPpc, Vaagr, Taxm and the D1 and D2. We find positive but not significant relationship between EXPm and rGDPpc as in the graphical analysis. The coefficient of VAagr is positive and significant, which implies that when agricultural production increase, then municipal expenditure also increase and this also can be interpreted as an expenditure compensation policy of municipalities to agricultural regions. The correlation of EXPm with TAXm is significant and positive. D1 has a positive but not a significant coefficient. D2 has a negative but not significant coefficient in the EXPm regression analysis. This shows that central government make more expenditure for OHAL and KOY than municipalities do.
When we add the income distribution variable, Top20/Bot20, to our analysis, we see positive correlation for both central and municipal expenditures (Table 1.b). However, income distribution variable is not significant in both cases. Moreover, the goodness of fit remarkably decreases in the central expenditure case with the addition of income distribution variable. The positive relationship can be interpreted as when income distribution becomes worse, municipality expenditure increases.
Although we would have liked to make an analysis of whether local governments are self-financing or not, we cannot find the necessary own revenue data of municipalities. This analysis would have also provided useful information about decentralization.