25
CliniCal MediCine insights: WoMen’s health 2015:8
Predictive Risk Factors in the Treatment of Gestational
Diabetes Mellitus
lebriz hale aktun
1, Betul Yorgunlar
1, nilay Karaca
2and Yaşam Kemal Akpak
31Department of Obstetrics and Gynecology, Istanbul Medipol University, Istanbul, Turkey. 2Department of Obstetrics and Gynecology, Bezmialem Vakif University, Istanbul, Turkey. 3Department of Obstetrics and Gynecology, Ankara Mevki Military Hospital, Ankara, Turkey.
ABSTRACT
OBJECTIVE: This study aims to investigate predictive risk factors in the treatment of gestational diabetes mellitus (GDM).
PATIENTS AND METHODS: A total of 256 pregnant women who underwent 75 g oral glucose tolerance test (OGTT) during 24–28 weeks of pregnancy were included according to the World Health Organization criteria. Demographic characteristics of the patients, including age, parity, family history of diabetes, body weight before pregnancy, and body weight at the diagnosis of GDM, were recorded. Fasting insulin and hemoglobin A1c (HbA1c) values at the time of diagnosis were evaluated. The patients were divided into two groups: those requiring insulin treat-ment (insulin group, n = 89) and those receiving diet therapy (diet group, n = 167) during pregnancy according to the American Diabetes Association recommendations.
RESULTS: A total of 34.76% of the pregnant women with GDM required insulin treatment. The mean age of these patients was significantly higher compared to the diet group (34.9 ± 0.6 years vs. 31.9 ± 0.6 years; P = 0.004). Body mass index before pregnancy was also significantly higher in the insulin group than that in the diet group (32 ± 0.9 kg/m2 vs. 29 ± 0.7 kg/m2; P = 0.004). Fasting blood glucose (FBG) during OGTT was 105.6 ± 2.1 mg/dL and 96.7 ± 1.1 mg/dL in the insulin group and diet group, respectively (P 0.001). There was no significant difference in fasting plasma glucose during OGTT between the groups (P = 0.069), while plasma glucose at two hours was 161.1 ± 6.8 mg/dL in the insulin group and 145.1 ± 3.7 mg/dL in the diet group (P = 0.027). At the time of diagnosis, HbA1c values were significantly higher in the insulin group compared to the diet group (5.3 ± 0.1 vs. 4.9 ± 0.1; P = 0.001). There was no significant difference in FBG and homeostasis model assessment-insulin resistance values between the groups (P = 0.908, P = 0.073).
CONCLUSION: Our study results suggest that age, family history of diabetes, body weight before pregnancy, FBG, and HbA1c values are predictors for the necessity of insulin treatment.
KEYWORDS: fasting blood glucose, pregnancy, obstetric outcome, oral glucose tolerance test, hemoglobin A1c CITATION: Aktun et al. Predictive Risk Factors in the Treatment of Gestational
diabetes Mellitus. Clinical Medicine Insights: Women’s Health 2015:8 25–28 doi:10.4137/CMWh.s31564.
TYPE: original Research
RECEIVED: July 10, 2015. RESUBMITTED: September 22, 2015. ACCEPTED FOR PUBLICATION: September 22, 2015.
ACADEMIC EDITOR: Garry Walsh, editor in chief, Clinical Medicine Insights:
Therapeutics
PEER REVIEW: Six peer reviewers contributed to the peer review report. Reviewers’
reports totaled 1,841 words, excluding any confidential comments to the academic editor.
FUNDING: Authors disclose no funding sources.
COMPETING INTERESTS: Authors disclose no potential conflicts of interest.
COPYRIGHT: © the authors, publisher and licensee Libertas Academica Limited.
This is an open-access article distributed under the terms of the Creative Commons CC-BY-NC 3.0 License.
CORRESPONDENCE: [email protected]
Paper subject to independent expert blind peer review. All editorial decisions made by independent academic editor. Upon submission manuscript was subject to anti-plagiarism scanning. Prior to publication all authors have given signed confirmation of agreement to article publication and compliance with all applicable ethical and legal requirements, including the accuracy of author and contributor information, disclosure of competing interests and funding sources, compliance with ethical requirements relating to human and animal study participants, and compliance with any copyright requirements of third parties. This journal is a member of the Committee on Publication Ethics (COPE). Provenance: the authors were invited to submit this paper.
Published by Libertas Academica. Learn more about this journal.
Introduction
Gestational diabetes mellitus (GDM) is one of the most common metabolic disorder diagnosed during pregnancy, and it refers to carbohydrate intolerance in various levels.1 The
rate of pregnant women with GDM is rising.2 It is possible
to protect the fetus from macrosomia, a possible long-term obesity, and to prevent the fetus from birth injury by diagnos-ing and treatdiagnos-ing pregnant women with GDM.
It is hard to make a comparison of GDM prevalence among various populations because there is no common agree-ment on universal screening and diagnosing. According to the American Diabetes Association (ADA), GDM accounts for 4% of pregnant women. However, it may vary between 1% and 14% in different populations.2,3 Screening of GDM is often
performed at 24–28 weeks during pregnancy, whereas high-risk patients are recommended to be screened at the onset of pregnancy.4 Similar to the rest of the world, a two-stage
screening test with 50 g oral glucose tolerance test (OGTT) and 100 g OGTT has been performed for many years in Turkey. However, in recent years, a single-stage screening with 75 g OGTT has been adopted.5,6
Fetal and maternal complication risks should be mini-mized by following treatment and monitoring protocols in patients with GDM.3 The first-line treatment of GDM is
medical diet therapy and exercise. However, insulin therapy can be initiated if diet and exercise alone are inadequate, based on individual fasting blood glucose (FBG) and postprandial blood glucose (PPBG) levels. Basal–bolus insulin regimen (0.8–1 kg/day) is administered to patients with an FBG level of 95 mg/dL, a one-hour PPBG level of 140 mg/dL, and a two-hour PPBG level of 120 mg/dL besides diet and exercise.7
The aim of this study is to investigate predictive risk factors in the treatment of GDM.
Journal name: Clinical Medicine Insights: Women’s Health Journal type: Original Research
Year: 2015 Volume: 8
Running head verso: Aktun et al
Aktun et al
26 CliniCal MediCine insights: WoMen’s health 2015:8
Materials and Methods
Patients. Between December 2013 and December 2014,
a total of 970 pregnant women were screened for GDM with 75 g OGTT at 24–28 weeks of pregnancy at Istan-bul Medipol University Hospital, gynecology and obstetrics outpatient clinic. Of these women, 256 women who were diagnosed with GDM according to the World Health Orga-nization (WHO) criteria (defined as FBG 126 mg/dL; two-hour PPGT 140 mg/dL) were included.8,9 Women
with multiple pregnancies, type 1 and type 2 diabetes, grand multipara (greater than four births), and systemic diseases were excluded. After 8–12-hour fasting, venous blood sam-ples were collected at 08.00 a.m. from all patients. Hemoglo-bin A1c (HbA1c), glucose, and insulin levels were measured according to anamnesis and FBG measures in the first tri-mester of pregnant women. Based on homeostasis model assessment-insulin resistance (HOMA-IR), an insulin resis-tance score was calculated using the following formula: fast-ing plasma glucose (mmol/L) times fastfast-ing serum insulin (mU/L) divided by 22.5.10 A threshold of 2.7 was considered
for HOMA-IR.11 Insulin level was measured using
chemi-luminescent microparticle immunoassay (Architect System; Abbott), while glucose level was measured using hexokinase method and HbA1c values were measured using immuno-turbidimetry. Demographic characteristics of the patients, including age, parity, family history of diabetes, body weight before pregnancy, and body weight at the diagnosis of GDM, were recorded. The patients were divided into two groups: those requiring insulin treatment (insulin group; n = 89) and those receiving diet therapy (diet group; n = 167) during pregnancy.
The first-line treatment was medical diet for patients with GDM. Daily calorie intake was calculated based on body mass index (BMI) values. A diet program consisting of three main meals and four snacks was scheduled for obese patients (24 kcal/kg) and nonobese patients (35 kcal/kg) as of the second trimester of pregnancy. All the patients were followed with FBG tests and PPBG at one and two hours. The mean duration of blood glucose monitoring in patients on diet was 15 days. Insulin treatment was initiated in patients
with an FBG level of 95 mg/dL and a one-hour PPBG level of 140 mg/dL despite diet and exercise. Treatment goals were based on the ADA recommendations.6
Insulin treatment was initiated with basal–bolus or bolus alone, based on the individual FBG levels. Neutral prot-amine hagedorn (NPH) insulin was administered to patients with high levels of FBG, whereas NPH with crystallized insulin was administered to those with high levels of FBG and PPTT. Target value for blood glucose with insulin treat-ment was 95 mg/dL, one-hour PPTT 140 mg/dL, and two-hour PPTT 120 mg/dL.6
Statistical analysis. Statistical analysis was performed
using the SPSS v18.0 software (SPSS Inc.). Categorical data were expressed in number and percentage, while numerical data were expressed in mean and standard deviation (minimum and maximum, where applicable). Chi-square test was used to compare categorical data, whereas independent t-test was performed to compare numerical data. The Mann–Whitney
U test was used if the assumptions were not met. Logistic
regression analysis was performed to identify the insulin group. A P-value of 0.05 was considered statistically signifi-cant. The risk factors of logistic regression analysis were FBG and HbA1c, which required insulin treatment.
Results
The mean age of the 256 pregnant women was 34.9 ± 0.6 years (range, 25–45 years). Of these women, 32% were above 35 years of age. The mean BMI value before pregnancy was 30 ± 5.6 kg/m2, and 45.3% of the patients were deemed as obese.
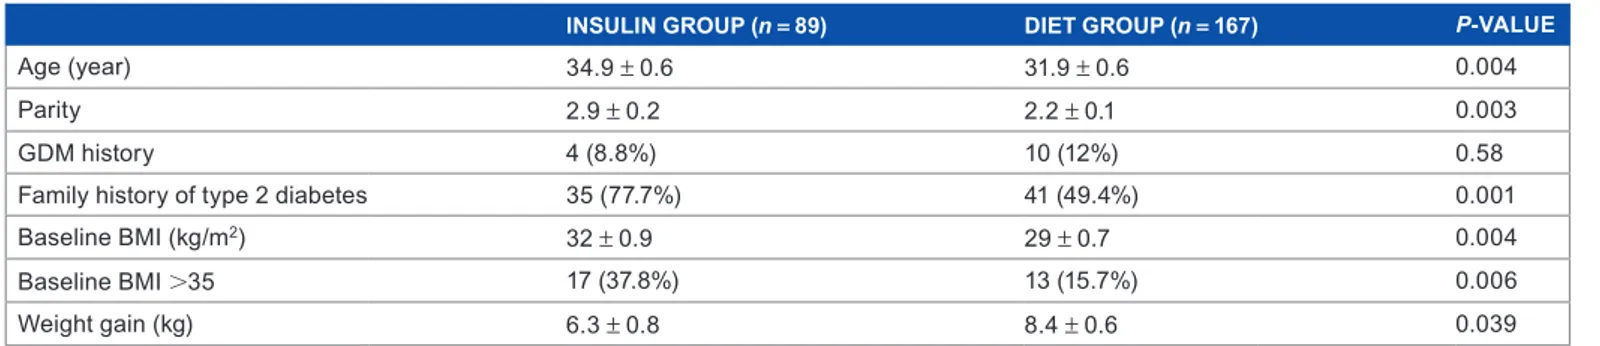
A total of 34.76% pregnant women with GDM required insulin treatment. The mean age of these patients was signifi-cantly higher compared to the diet group (Table 1). Insulin treatment was required for 49% of patients above 35 years of age and 26% of patients below 35 years of age. BMI before pregnancy was also significantly higher in the insulin group compared to the diet group (32 ± 0.9 kg/m2 vs. 29 ± 0.7 kg/m2;
P = 0.004). Insulin treatment was required for 43.1% of
patients having a BMI 30 kg/m2 and 20.4% of patients
hav-ing a BMI 30 kg/m2. However, weight gain was higher in
the diet group compared to the insulin group until the time
Table 1. Demographic, anthropometric, and clinical characteristics of the patients.
INSULIN GROUP (n = 89) DIET GROUP (n = 167) P-VALUE
Age (year) 34.9 ± 0.6 31.9 ± 0.6 0.004
Parity 2.9 ± 0.2 2.2 ± 0.1 0.003
gdM history 4 (8.8%) 10 (12%) 0.58
Family history of type 2 diabetes 35 (77.7%) 41 (49.4%) 0.001
Baseline BMI (kg/m2) 32 ± 0.9 29 ± 0.7 0.004
Baseline BMi 35 17 (37.8%) 13 (15.7%) 0.006
Weight gain (kg) 6.3 ± 0.8 8.4 ± 0.6 0.039
Treatment of gestational diabetes mellitus
27
CliniCal MediCine insights: WoMen’s health 2015:8
of the diagnosis of GDM (P = 0.039) (Table 1). In the insu-lin group, parity was 2.9 ± 0.2, while it was 2.2 ± 0.1 in the diet group. The difference between the parities was significant (P = 0.003). Considering the family history of type 2 diabetes, there was a significant difference between the two groups (P = 0.001) (Table 1).
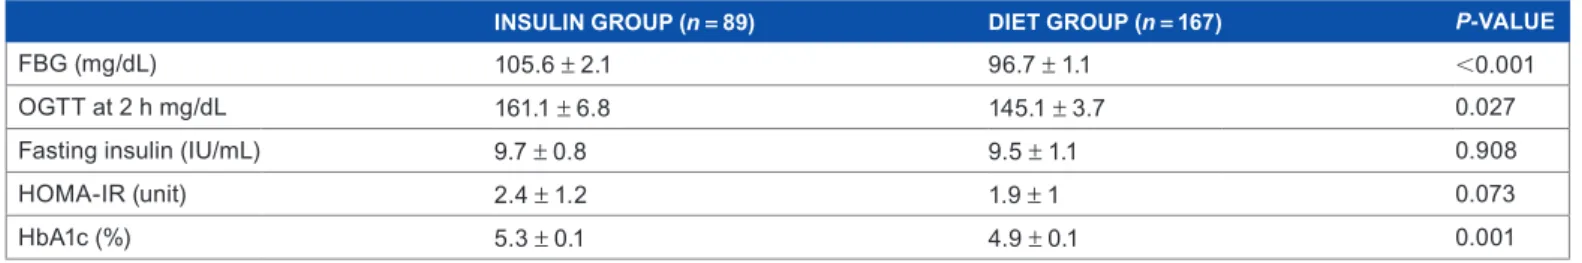
FBG during OGTT was 105.6 ± 2.1 mg/dL and 96.7 ± 1.1 mg/dL in the insulin group and diet group, respec-tively (P 0.001). There was no significant difference in the fasting plasma glucose during OGTT between the groups (P = 0.069), while plasma glucose during OGTT at two hours was 161.1 ± 6.8 mg/dL in the insulin group and 145.1 ± 3.7 mg/dL in the diet group (P = 0.027). At the time of GDM diagnosis, HbA1c values were significantly higher in the insulin group compared to the diet group (5.3 ± 0.1 vs. 4.9 ± 0.1; P = 0.001). There was no significant difference in FBG and HOMA-IR values between the groups (Table 2).
Logistic regression analysis revealed that a higher number of patients with increased FBG and HbA1c required insulin treatment. Each one-unit increase in FBG increased the prob-ability of insulin use by 1.062-fold (95% confidence interval (CI): 1.021–1.104), whereas each one-unit increase in HbA1c increased the probability by 3.1-fold (95% CI: 1.185–8.164). Age-adjusted regression analysis also showed that each one-year increase in age increased the probability of insulin use by 1.109-fold (95% CI: 1.018–1.209) (Table 3).
Discussion
GDM risk factors may be maternal or pregnancy related. Some of these factors are history of diabetes mellitus in fam-ily, elderly pregnancy, obesity, macrosomic infant in previous delivery, and multiparity.12 Diagnosing GDM is paramount
to prevent prenatal and maternal complications.9,13 WHO
adopted the two-hour 75-g OGTT during pregnancy and recommended the same diagnostic cutoff points established for the diagnosis of impaired glucose tolerance in nonpregnant women.14 Untreated GDM was associated with significantly
higher perinatal mortality rate compared to those with nor-mal glucose tolerance.15 Also, with the modern management
of GDM, lower morbidity rate can be expected in the infants of diabetic mothers.16 Changing lifestyle, diet, and additional
insulin treatment have shown better perinatal outcomes.17,18
In the present study, we identified risk factors based on the WHO diagnostic criteria among patients requir-ing insulin for the treatment of GDM. In the insulin group, the number of parity was higher with an increased number of family history of type 2 diabetes, increased BMI, and age indicating a significant difference. We also found that each one-unit (1 mg/dL) increase in the FBG at the time of diag-nosis increased the probability of insulin use by 1.062-fold and each one-unit increase in HbA1c increased it by 3.1-fold.
Similarly, Pertot et al19 demonstrated that family history
of diabetes, body weight before pregnancy, and BMI were determinant factors for insulin treatment. In another study, Ouzounian et al20 reported that overweight and obese women
with GDM had an increased need for medical nutrition ther-apy for glycemic regulation and insulin treatment.
In our study, FBG, two-hour OGTT, and HbA1c values were higher in the insulin group compared to the diet group, which are consistent with other reports in the literature. In a study including 300 women with GDM, Bakiner et al21
showed that 36.7% required insulin treatment with a higher incidence among patients with elevated FBG and HbA1c values. The authors reported that an FBG level of 89.5 mg/dL and an HbA1c value of 5.4 were positive predictors for GDM. In another study, the authors found that an FBG level of 105 mg/dL might be used to identify high-risk pregnant women requiring insulin treatment.22 In addition, Clayton
et al23 demonstrated that increased HbA1c, FBG, and BMI
values were positively associated with insulin treatment among patients with GDM. Another study showed that the majority of pregnant women with a one-hour OGTT of 190 mg/dL needed insulin treatment.20
Table 2. Biochemistry results of the patients.
INSULIN GROUP (n = 89) DIET GROUP (n = 167) P-VALUE
FBG (mg/dL) 105.6 ± 2.1 96.7 ± 1.1 0.001
OGTT at 2 h mg/dL 161.1 ± 6.8 145.1 ± 3.7 0.027
Fasting insulin (IU/mL) 9.7 ± 0.8 9.5 ± 1.1 0.908
HOMA-IR (unit) 2.4 ± 1.2 1.9 ± 1 0.073
HbA1c (%) 5.3 ± 0.1 4.9 ± 0.1 0.001
Abbreviations: FBG, fasting blood glucose; OGTT, oral glucose tolerance test; HOMA-IR, homeostasis model assessment-insulin resistance; HbA1c, hemoglobin A1c.
Table 3. Factors affecting insulin need in patients with GDM.
VARIABLE P-VALUE OR 95% CONFIDENCE INTERVAL
FBG (mg/dL) 0.003 1.062 1.021–1.104
hba1c 0.021 3.110 1.185–8.164
age 0.017 1.109 1.018–1.209
Note: Only significant values via regression analysis are presented. Abbreviations: FBG, fasting blood glucose; HbA1c, hemoglobin A1c.
Aktun et al
28 CliniCal MediCine insights: WoMen’s health 2015:8
In this study, a significantly higher number of patients with increased two-hour OGTT, FBG, and HbA1c values required insulin treatment than those in the diet group. However, logistic regression analysis revealed that two-hour OGTT was not a predictor for the insulin need. The analysis also showed that each one-unit increase in FBG at the time of diagnosis increased the probability of using insulin by 1.062-fold and each one-unit increase in the HbA1c increased it by 3.1-fold.
In conclusion, we found that advanced age and increased BMI values before pregnancy were more frequent among patients receiving insulin treatment for GDM. Based on logis-tic regression analysis, FBG (odds ratio (OR), 1.062), HbA1c (OR, 3.110), and age (OR, 1.109) were found to be predictors for insulin treatment. The close monitoring of patients with GDM during pregnancy is essential for the early prediction of fetal and maternal complications.
Consent
Written informed consent was obtained from all the participants. Local ethics committee approval was not needed because of noninvasive retrospective clinical study.
Author Contributions
Conceived and designed the experiments: LHA, BY. Ana-lyzed the data: LHA, BY. Wrote the first draft of the manu-script: LHA, BY, NK, YKA. Contributed to the writing of the manuscript: LHA, BY, NK, YKA. Agree with manuscript results and conclusions: LHA, BY, NK, YKA. Jointly devel-oped the structure and arguments for the paper: LHA, BY, NK, YKA. Made critical revisions and approved final version: LHA, BY, NK, YKA. All authors reviewed and approved of the final manuscript.
REFERENCES
1. Kharroubi AT, Darwish HM. Diabetes mellitus: the epidemic of the century.
World J Diabetes. 2015;6:850–867.
2. American Diabetes Association. Diagnosis and classification of diabetes mellitus. Diabetes Care. 2009;32:62–67.
3. Kemal Akpak Y, Gün I, Kaya N, Atay V. A comparison of pregnant subgroups with positive 50-gram glucose challenge test results to those with negative results in terms of obstetric and perinatal outcomes. Med Glas (Zenica). 2012;9:262–267.
4. Kapoor N, Sankaran S, Hyer S, Shehata H. Diabetes in pregnancy: a review of current evidence. Curr Opin Obstet Gynecol. 2007;19:586–590.
5. Landon MB, Spong CY, Thom E, et al. A multicenter, randomized trial of treat-ment for mild gestational diabetes. N Engl J Med. 2009;361:1339–1348. 6. American Diabetes Association. Standards of medical care in diabetes—2013.
Diabetes Care. 2013;36(suppl 1):11–66.
7. Klein J, Charach R, Sheiner E. Treating diabetes during pregnancy. Expert Opin
Pharmacother. 2015;16:357–368.
8. Metzger BE, Gabbe SG, Persson B, et al. International association of diabetes and pregnancy study groups recommendations on the diagnosis and classification of hyperglycemia in pregnancy. Diabetes Care. 2010;33:676–682.
9. Griffin ME, Coffery M, Johnson H, et al. Universal vs., risk factor-based screen-ing for gestational diabetes mellitus: detection rates, gestation at diagnosis and outcome. Diabetes Med. 2000;17:26–32.
10. Matthews DR, Hosker JP, Rudenski AS, Naylor BA, Treacher DF, Turner RC. Homeostasis model assessment: insulin resistance and beta-cell function from fasting plasma glucose and insulin concentrations in man. Diabetologia. 1985;28: 412–419.
11. Gokcel A, Ozsahin AK, Sezgin N, et al. High prevalence of diabetes in Adana, a southern province of Turkey. Diabetes Care. 2003;26:3031–3034.
12. Ben-Haroush A, Yogev Y, Hod M. Epidemiology of gestational diabetes mel-litus and its association with Type 2 diabetes. Diabet Med. 2004;21:103–113. 13. Sayah SH, Chondra A, Eberhardt MS. Pregnancy experience among women
with and without gestational in the U.S. 1995 national survey of family growth.
Diabetes Care. 2005;28:1035–1040.
14. Puavilai G, Chanprasertyotin S, Sriphrapradaeng A. Diagnostic criteria for diabetes mellitus and other categories of glucose intolerance: 1997 criteria by the Expert Committee on the diagnosis and classification of diabetes mellitus (ADA), 1998 WHO consultation criteria, and 1985 WHO criteria. World Health Organization. Diabetes Res Clin Pract. 1999;44:21–26.
15. Beischer NA, Wein P, Sheedy MT, Steffen B. Identification and treatment of women with hyperglycaemia diagnosed during pregnancy can significantly reduce perinatal mortality rates. Aust N Z J Obstet Gynaecol. 1996;36:239–247. 16. Langer O. Is normoglycemia the correct threshold to prevent complications in
the pregnant diabetic patient? Diabetes Rev. 1996;4:2–10.
17. Bantle JP, Wylie-Rosett J, Albright AL, et al. Nutrition recommendations and interventions for diabetes: a position statement of the American Diabetes Asso-ciation. Diabetes Care. 2008;31(suppl 1):61–78.
18. Reader DM. Medical nutrition therapy and lifestyle interventions. Diabetes Care. 2007;30(suppl 2):188–193.
19. Pertot T, Molyneaux L, Tan K, Ross GP, Yue DK, Wong J. Can common clini-cal param eters be used to identify patients who will need insulin treatment in gestational diabetes mellitus? Diabetes Care. 2011;34:2214–2216.
20. Ouzounian JG, Rosenheck R, Lee RH, Yedigarova L, Walden CL, Korst LM. One-hour post-glucose results and pre-pregnancy body mass index are associated with the need for insulin therapy in women with gestational diabetes. J Matern
Fetal Neonatal Med. 2011;24:718–722.
21. Bakiner O, Bozkirli E, Ozsahin K, Sariturk C, Ertorer E. Risk factors that can predict antenatal insulin need in gestational diabetes. J Clin Med Res. 2013;5:381–388.
22. Akinci B, Celtik A, Yener S, Yesil S. Is fasting glucose level during oral glucose tolerance test an indicator of the insulin need in gestational diabetes? Diabetes
Res Clin Pract. 2008;82:219–225.
23. Clayton W, Agarwal N, Wang L, Jagasia S. Clinical markers implying the need for treatment in patients with gestational diabetes. Endocr Pract. 2012;18:62–65.