published as:
Measurement of the e^{+}e^{-}→ηJ/ψ cross section and
search for e^{+}e^{-}→π^{0}J/ψ at center-of-mass
energies between 3.810 and 4.600 GeV
M. Ablikim et al. (BESIII Collaboration)
Phys. Rev. D 91, 112005 — Published 9 June 2015
DOI:
10.1103/PhysRevD.91.112005
center-of-mass energies between 3.810 and 4.600 GeV
M. Ablikim1, M. N. Achasov9,a, X. C. Ai1, O. Albayrak5, M. Albrecht4, D. J. Ambrose44, A. Amoroso48A,48C, F. F. An1,
Q. An45, J. Z. Bai1, R. Baldini Ferroli20A, Y. Ban31, D. W. Bennett19, J. V. Bennett5, M. Bertani20A, D. Bettoni21A,
J. M. Bian43, F. Bianchi48A,48C, E. Boger23,h, O. Bondarenko25, I. Boyko23, R. A. Briere5, H. Cai50, X. Cai1, O. Cakir40A,b,
A. Calcaterra20A, G. F. Cao1, S. A. Cetin40B, J. F. Chang1, G. Chelkov23,c, G. Chen1, H. S. Chen1, H. Y. Chen2,
J. C. Chen1, M. L. Chen1, S. J. Chen29, X. Chen1, X. R. Chen26, Y. B. Chen1, H. P. Cheng17, X. K. Chu31, G. Cibinetto21A,
D. Cronin-Hennessy43, H. L. Dai1, J. P. Dai34, A. Dbeyssi14, D. Dedovich23, Z. Y. Deng1, A. Denig22, I. Denysenko23,
M. Destefanis48A,48C, F. De Mori48A,48C, Y. Ding27, C. Dong30, J. Dong1, L. Y. Dong1, M. Y. Dong1, S. X. Du52,
P. F. Duan1, J. Z. Fan39, J. Fang1, S. S. Fang1, X. Fang45, Y. Fang1, L. Fava48B,48C, F. Feldbauer22, G. Felici20A,
C. Q. Feng45, E. Fioravanti21A, M. Fritsch14,22, C. D. Fu1, Q. Gao1, X. Y. Gao2, Y. Gao39, Z. Gao45, I. Garzia21A,
C. Geng45, K. Goetzen10, W. X. Gong1, W. Gradl22, M. Greco48A,48C, M. H. Gu1, Y. T. Gu12, Y. H. Guan1, A. Q. Guo1,
L. B. Guo28, Y. Guo1, Y. P. Guo22, Z. Haddadi25, A. Hafner22, S. Han50, Y. L. Han1, X. Q. Hao15, F. A. Harris42, K. L. He1,
Z. Y. He30, T. Held4, Y. K. Heng1, Z. L. Hou1, C. Hu28, H. M. Hu1, J. F. Hu48A,48C, T. Hu1, Y. Hu1, G. M. Huang6,
G. S. Huang45, H. P. Huang50, J. S. Huang15, X. T. Huang33, Y. Huang29, T. Hussain47, Q. Ji1, Q. P. Ji30, X. B. Ji1,
X. L. Ji1, L. L. Jiang1, L. W. Jiang50, X. S. Jiang1, J. B. Jiao33, Z. Jiao17, D. P. Jin1, S. Jin1, T. Johansson49, A. Julin43,
N. Kalantar-Nayestanaki25, X. L. Kang1, X. S. Kang30, M. Kavatsyuk25, B. C. Ke5, R. Kliemt14, B. Kloss22,
O. B. Kolcu40B,d, B. Kopf4, M. Kornicer42, W. Kuehn24, A. Kupsc49, W. Lai1, J. S. Lange24, M. Lara19, P. Larin14,
C. Leng48C, C. H. Li1, Cheng Li45, D. M. Li52, F. Li1, G. Li1, H. B. Li1, J. C. Li1, Jin Li32, K. Li13, K. Li33, Lei Li3,
P. R. Li41, T. Li33, W. D. Li1, W. G. Li1, X. L. Li33, X. M. Li12, X. N. Li1, X. Q. Li30, Z. B. Li38, H. Liang45, Y. F. Liang36,
Y. T. Liang24, G. R. Liao11, D. X. Lin14, B. J. Liu1, C. X. Liu1, F. H. Liu35, Fang Liu1, Feng Liu6, H. B. Liu12, H. H. Liu16,
H. H. Liu1, H. M. Liu1, J. Liu1, J. P. Liu50, J. Y. Liu1, K. Liu39, K. Y. Liu27, L. D. Liu31, P. L. Liu1, Q. Liu41, S. B. Liu45,
X. Liu26, X. X. Liu41, Y. B. Liu30, Z. A. Liu1, Zhiqiang Liu1, Zhiqing Liu22, H. Loehner25, X. C. Lou1,e, H. J. Lu17,
J. G. Lu1, R. Q. Lu18, Y. Lu1, Y. P. Lu1, C. L. Luo28, M. X. Luo51, T. Luo42, X. L. Luo1, M. Lv1, X. R. Lyu41, F. C. Ma27,
H. L. Ma1, L. L. Ma33, Q. M. Ma1, S. Ma1, T. Ma1, X. N. Ma30, X. Y. Ma1, F. E. Maas14, M. Maggiora48A,48C,
Q. A. Malik47, Y. J. Mao31, Z. P. Mao1, S. Marcello48A,48C, J. G. Messchendorp25, J. Min1, T. J. Min1, R. E. Mitchell19,
X. H. Mo1, Y. J. Mo6, C. Morales Morales14, K. Moriya19, N. Yu. Muchnoi9,a, H. Muramatsu43, Y. Nefedov23, F. Nerling14,
I. B. Nikolaev9,a, Z. Ning1, S. Nisar8, S. L. Niu1, X. Y. Niu1, S. L. Olsen32, Q. Ouyang1, S. Pacetti20B, P. Patteri20A,
M. Pelizaeus4, H. P. Peng45, K. Peters10, J. Pettersson49, J. L. Ping28, R. G. Ping1, R. Poling43, Y. N. Pu18, M. Qi29,
S. Qian1, C. F. Qiao41, L. Q. Qin33, N. Qin50, X. S. Qin1, Y. Qin31, Z. H. Qin1, J. F. Qiu1, K. H. Rashid47, C. F. Redmer22,
H. L. Ren18, M. Ripka22, G. Rong1, Ch. Rosner14, X. D. Ruan12, V. Santoro21A, A. Sarantsev23,f, M. Savri´e21B,
K. Schoenning49, S. Schumann22, W. Shan31, M. Shao45, C. P. Shen2, P. X. Shen30, X. Y. Shen1, H. Y. Sheng1, W. M. Song1,
X. Y. Song1, S. Sosio48A,48C, S. Spataro48A,48C, G. X. Sun1, J. F. Sun15, S. S. Sun1, Y. J. Sun45, Y. Z. Sun1, Z. J. Sun1,
Z. T. Sun19, C. J. Tang36, X. Tang1, I. Tapan40C, E. H. Thorndike44, M. Tiemens25, D. Toth43, M. Ullrich24, I. Uman40B,
G. S. Varner42, B. Wang30, B. L. Wang41, D. Wang31, D. Y. Wang31, K. Wang1, L. L. Wang1, L. S. Wang1, M. Wang33,
P. Wang1, P. L. Wang1, Q. J. Wang1, S. G. Wang31, W. Wang1, X. F. Wang39, Y. D. Wang14, Y. D. Wang20A, Y. F. Wang1,
Y. Q. Wang22, Z. Wang1, Z. G. Wang1, Z. H. Wang45, Z. Y. Wang1, T. Weber22, D. H. Wei11, J. B. Wei31, P. Weidenkaff22,
S. P. Wen1, U. Wiedner4, M. Wolke49, L. H. Wu1, Z. Wu1, L. G. Xia39, Y. Xia18, D. Xiao1, Z. J. Xiao28, Y. G. Xie1,
Q. L. Xiu1, G. F. Xu1, L. Xu1, Q. J. Xu13, Q. N. Xu41, X. P. Xu37, L. Yan45, W. B. Yan45, W. C. Yan45, Y. H. Yan18,
H. X. Yang1, L. Yang50, Y. Yang6, Y. X. Yang11, H. Ye1, M. Ye1, M. H. Ye7, J. H. Yin1, B. X. Yu1, C. X. Yu30, H. W. Yu31,
J. S. Yu26, C. Z. Yuan1, W. L. Yuan29, Y. Yuan1, A. Yuncu40B,g, A. A. Zafar47, A. Zallo20A, Y. Zeng18, B. X. Zhang1,
B. Y. Zhang1, C. Zhang29, C. C. Zhang1, D. H. Zhang1, H. H. Zhang38, H. Y. Zhang1, J. J. Zhang1, J. L. Zhang1,
J. Q. Zhang1, J. W. Zhang1, J. Y. Zhang1, J. Z. Zhang1, K. Zhang1, L. Zhang1, S. H. Zhang1, X. Y. Zhang33, Y. Zhang1,
Y. H. Zhang1, Y. T. Zhang45, Z. H. Zhang6, Z. P. Zhang45, Z. Y. Zhang50, G. Zhao1, J. W. Zhao1, J. Y. Zhao1, J. Z. Zhao1,
Lei Zhao45, Ling Zhao1, M. G. Zhao30, Q. Zhao1, Q. W. Zhao1, S. J. Zhao52, T. C. Zhao1, Y. B. Zhao1, Z. G. Zhao45,
A. Zhemchugov23,h, B. Zheng46, J. P. Zheng1, W. J. Zheng33, Y. H. Zheng41, B. Zhong28, L. Zhou1, Li Zhou30, X. Zhou50,
X. K. Zhou45, X. R. Zhou45, X. Y. Zhou1, K. Zhu1, K. J. Zhu1, S. Zhu1, X. L. Zhu39, Y. C. Zhu45, Y. S. Zhu1, Z. A. Zhu1,
J. Zhuang1, L. Zotti48A,48C, B. S. Zou1, J. H. Zou1
(BESIII Collaboration)
1 Institute of High Energy Physics, Beijing 100049, People’s Republic of China 2 Beihang University, Beijing 100191, People’s Republic of China
3 Beijing Institute of Petrochemical Technology, Beijing 102617, People’s Republic of China 4 Bochum Ruhr-University, D-44780 Bochum, Germany
5 Carnegie Mellon University, Pittsburgh, Pennsylvania 15213, USA 6 Central China Normal University, Wuhan 430079, People’s Republic of China
7 China Center of Advanced Science and Technology, Beijing 100190, People’s Republic of China
8 COMSATS Institute of Information Technology, Lahore, Defence Road, Off Raiwind Road, 54000 Lahore, Pakistan 9 G.I. Budker Institute of Nuclear Physics SB RAS (BINP), Novosibirsk 630090, Russia
10GSI Helmholtzcentre for Heavy Ion Research GmbH, D-64291 Darmstadt, Germany 11 Guangxi Normal University, Guilin 541004, People’s Republic of China
13 Hangzhou Normal University, Hangzhou 310036, People’s Republic of China 14 Helmholtz Institute Mainz, Johann-Joachim-Becher-Weg 45, D-55099 Mainz, Germany
15 Henan Normal University, Xinxiang 453007, People’s Republic of China
16 Henan University of Science and Technology, Luoyang 471003, People’s Republic of China 17Huangshan College, Huangshan 245000, People’s Republic of China
18Hunan University, Changsha 410082, People’s Republic of China 19 Indiana University, Bloomington, Indiana 47405, USA
20(A)INFN Laboratori Nazionali di Frascati, I-00044, Frascati, Italy; (B)INFN and University of Perugia, I-06100, Perugia,
Italy
21 (A)INFN Sezione di Ferrara, I-44122, Ferrara, Italy; (B)University of Ferrara, I-44122, Ferrara, Italy 22Johannes Gutenberg University of Mainz, Johann-Joachim-Becher-Weg 45, D-55099 Mainz, Germany
23 Joint Institute for Nuclear Research, 141980 Dubna, Moscow region, Russia
24 Justus Liebig University Giessen, II. Physikalisches Institut, Heinrich-Buff-Ring 16, D-35392 Giessen, Germany 25 KVI-CART, University of Groningen, NL-9747 AA Groningen, The Netherlands
26Lanzhou University, Lanzhou 730000, People’s Republic of China 27Liaoning University, Shenyang 110036, People’s Republic of China 28 Nanjing Normal University, Nanjing 210023, People’s Republic of China
29 Nanjing University, Nanjing 210093, People’s Republic of China 30Nankai University, Tianjin 300071, People’s Republic of China
31 Peking University, Beijing 100871, People’s Republic of China 32Seoul National University, Seoul, 151-747 Korea 33Shandong University, Jinan 250100, People’s Republic of China 34Shanghai Jiao Tong University, Shanghai 200240, People’s Republic of China
35 Shanxi University, Taiyuan 030006, People’s Republic of China 36 Sichuan University, Chengdu 610064, People’s Republic of China
37 Soochow University, Suzhou 215006, People’s Republic of China 38Sun Yat-Sen University, Guangzhou 510275, People’s Republic of China
39Tsinghua University, Beijing 100084, People’s Republic of China
40 (A)Istanbul Aydin University, 34295 Sefakoy, Istanbul, Turkey; (B)Dogus University, 34722 Istanbul, Turkey; (C)Uludag
University, 16059 Bursa, Turkey
41 University of Chinese Academy of Sciences, Beijing 100049, People’s Republic of China 42 University of Hawaii, Honolulu, Hawaii 96822, USA
43 University of Minnesota, Minneapolis, Minnesota 55455, USA 44University of Rochester, Rochester, New York 14627, USA
45 University of Science and Technology of China, Hefei 230026, People’s Republic of China 46 University of South China, Hengyang 421001, People’s Republic of China
47 University of the Punjab, Lahore-54590, Pakistan
48 (A)University of Turin, I-10125, Turin, Italy; (B)University of Eastern Piedmont, I-15121, Alessandria, Italy; (C)INFN,
I-10125, Turin, Italy
49 Uppsala University, Box 516, SE-75120 Uppsala, Sweden 50Wuhan University, Wuhan 430072, People’s Republic of China 51Zhejiang University, Hangzhou 310027, People’s Republic of China 52Zhengzhou University, Zhengzhou 450001, People’s Republic of China
a Also at the Novosibirsk State University, Novosibirsk, 630090, Russia bAlso at Ankara University, 06100 Tandogan, Ankara, Turkey
c Also at the Moscow Institute of Physics and Technology, Moscow 141700, Russia and at the Functional Electronics
Laboratory, Tomsk State University, Tomsk, 634050, Russia
dCurrently at Istanbul Arel University, 34295 Istanbul, Turkey e Also at University of Texas at Dallas, Richardson, Texas 75083, USA f Also at the NRC ”Kurchatov Institute”, PNPI, 188300, Gatchina, Russia
g Also at Bogazici University, 34342 Istanbul, Turkey
hAlso at the Moscow Institute of Physics and Technology, Moscow 141700, Russia
1
1
Using data samples collected with the BESIII detector operating at the BEPCII collider at 17 center-of-mass energies from 3.810 to 4.600 GeV, we perform a study of e+e−→ ηJ/ψ and π0J/ψ.
The Born cross sections of these two processes are measured at each center-of-mass energy. The measured energy-dependent Born cross section for e+e− → ηJ/ψ shows an enhancement around
PACS numbers: 13.25.Gv, 13.66.Bc, 14.40.Pq, 14.40.Rt
I. INTRODUCTION
During the last decade, new charmoniumlike vector states, such as the Y (4260), Y (4360) and Y (4660), have been observed by BABAR [1, 2], Belle [3–6] and CLEO [7]. The masses of these new Y states are above the D ¯D production threshold, ranging from 4.0 to 4.7 GeV/c2. Since all of them are produced in e+e−
anni-hilation (either directly or via the initial state radiation (ISR) process), and since they have been observed to de-cay in dipion hadronic transitions to the J/ψ or ψ(3686), one would naturally interpret these states as vector char-monium excitations. However, peculiar features of these Y states reveal an exotic nature that likely excludes a conventional charmonium interpretation. These features include a discrepancy with the spectrum of vector char-monium states predicted by the potential model given in reference [8], a surprisingly large coupling to final states without open-charm mesons [9, 10], and a lack of obser-vation in the inclusive hadronic cross section [11]. Also, very recently, several charged charmoniumlike states — the Zc(3900)±[4, 12, 13], Zc(3885)±[14], Zc(4020)±[15],
Zc(4025)±[16], as well as their isospin partners, the
neu-tral states Zc(3900)0[13] and Zc(4020)0[17] — were
ob-served in the same mass region as these Y states. This suggests that the nature of the Y states could be related to that of the Zc states. Moreover, the observed cross
sections as a function of center-of-mass (CM) energy for e+e− → π+π−J/ψ [1, 3, 4, 7], π+π−ψ(3686) [2, 5, 6],
π+π−h
c [15], ηJ/ψ [18] and ωχc0 [19] are inconsistent
with each other. These observations hint at the exis-tence of a more complicated and mysterious underlying dynamics.
Many theoretical interpretations have been proposed to classify these Y states, such as hybrid charmo-nium [20], tetraquark [21], or hadronic molecule [22] mod-els, but none of them has been able to describe all ex-perimental observations in all aspects. Searching for new decay modes and measuring the line shapes of their pro-duction cross sections will be very helpful for these Y states interpretation. Hadronic transitions (by η, π0, or
a pion pair) to lower charmonia like the J/ψ are also regarded as sensitive probes to study the properties of these Y states [23].
The cross sections of e+e−→ ηJ/ψ and π0J/ψ above
the D ¯D production threshold have been evaluated within a non-relativistic framework derived from QCD [24], and their line shapes are predicted to be strongly affected by open charm effects [25]. Belle, BESIII and CLEO-c have measured the production cross sections of e+e−→ ηJ/ψ
above the open charm threshold [18, 26, 27]. However, Belle and CLEO-c results suffer from large statistical un-certainties. BESIII reported on a more accurate result, but the measurement was limited to a single CM energy of√s = 4.009 GeV. Experimental studies with large data
samples in a broad energy region may shed light on the nature of the Y states.
In this paper, we report a measurement of the Born cross sections of e+e− → ηJ/ψ and π0J/ψ at 17 CM
energies from 3.810 GeV to 4.600 GeV. The data sam-ples are taken by the BESIII detector at the BEPCII collider [28] and are listed in Table I and Table II. The CM energies are measured with a beam-energy measure-ment system [29] with an uncertainty of ±1.0 MeV. In our analysis, the η and π0are reconstructed in their
two-photon decay mode and the J/ψ via its decay into lepton pairs (ℓ+ℓ−).
II. DETECTOR AND MONTE CARLO SIMULATION
BEPCII [28] is a double-ring e+e− collider running at
CM energies ranging from 2.0 to 4.6 GeV, and providing a peak luminosity of 0.85×1033cm−2s−1at the CM energy
of 3.770 GeV. The BESIII [28] detector has a geometrical acceptance of 93% of 4π and has four main components. (1) A small-cell, helium-based (40% He, 60% C3H8) main
drift chamber (MDC) with 43 layers provides an average single-hit resolution of 135 µm, and a charged-particle momentum resolution in a 1 T magnetic field of 0.5% at 1.0 GeV/c. (2) A time-of-flight system (TOF) is con-structed of 5 cm thick plastic scintillators, with 176 de-tectors of 2.4 m length in two layers in the barrel and 96 fan-shaped detectors in the endcaps. The barrel (end-cap) time resolution of 80 ps (110 ps) provides a 2σ K/π separation for momenta up to ∼1 GeV/c. (3) An elec-tromagnetic calorimeter (EMC) consists of 6240 CsI(Tl) crystals in a cylindrical structure (barrel) and two end-caps. The photon energy resolution at 1.0 GeV/c is 2.5% (5%) in the barrel (endcaps), and the position resolution is 6 mm (9 mm) in the barrel (endcaps). (4) The muon system (MUC) is located in the iron flux return yoke of the superconducting solenoid and consists of 1000 m2
of Resistive Plate Chambers (RPCs) in nine barrel and eight endcap layers. It provides a position resolution of 2.0 cm.
The optimization of the selection criteria, the deter-mination of detection efficiencies, and the estimations of potential backgrounds are performed based on Monte Carlo (MC) simulations taking various aspects of the experimental setup into account. GEANT4-based [30] MC simulation software, which includes the geometric and material description of the BESIII detector, the de-tector response and digitization models, as well as ac-counting of the detector running conditions and perfor-mances, is used to generate MC samples. In the simula-tion, the electron-positron collision is simulated with the KKMC [31, 32] generator taking into consideration the spread in the beam energy and ISR. In this analysis, large signal MC samples of e+e− → ηJ/ψ and e+e−→ π0J/ψ
are generated at CM energies corresponding to the ex-perimental values, where the line shape of the produc-tion cross secproduc-tion of these two processes, assumed to be identical, are taken from the Belle experiment [18].
III. EVENT SELECTION
The candidate events of e+e− → ηJ/ψ and π0J/ψ
are required to have two charged tracks with a total net charge of zero and at least two photon candidates.
Charged tracks are reconstructed from the hits in the MDC. Each charged track is required to have a polar an-gle that is well within the fiducial volume of the MDC, | cos θ| < 0.93, where θ is the polar angle of the track in the laboratory frame, to have a point of closest approach to the interaction point that is within ±10 cm along the beam direction and within 1 cm in the radial direction, and to have a momentum p larger than 1.0 GeV/c. Elec-tron and muon separation is carried out by making use of the deposited energy in the EMC. Tracks with an en-ergy deposition of E < 0.4 GeV are identified as muons, while tracks with E/p > 0.8 c are identified as electrons or positrons.
Photon candidates are reconstructed by isolated show-ers in the EMC. The photon energy is required to be at least 25 MeV in the barrel (| cos θ| < 0.80) and 50 MeV in the endcaps (0.86 < | cos θ| < 0.92). To eliminate show-ers produced by charged particles, the angle between the shower and the nearest charged track must be larger than 20 degrees. A general requirement on the EMC timing (0 ≤ T ≤ 700 ns) is implemented to suppress detector electronic noise and energy depositions unrelated to the physical event.
A kinematic fit that imposes momentum and energy conservation (4C) is implemented under the hypothesis of e+e− → γγℓ+ℓ− to improve the momentum and
en-ergy resolutions of the final-state particles and to reduce the potential backgrounds. The chi-square of the kine-matic fit, χ2
4C, is required to be less than 40. If there
are more than two photons in an event, the combina-tion of γγℓ+ℓ− with the least χ2
4C is chosen. To
sup-press the backgrounds from radiative Bhabha and ra-diative dimuon events associated with a random photon candidate, the energy of each selected photon is further required to be larger than 80 MeV.
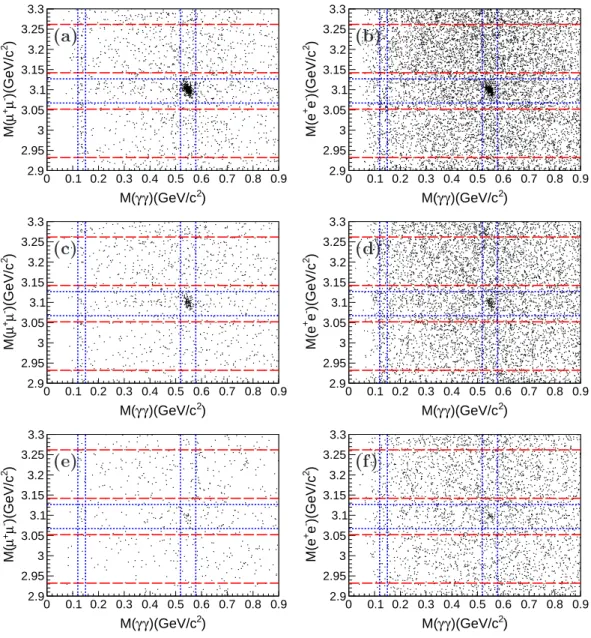
Figure 1 depicts scatter plots of the invariant mass of lepton pairs, M (ℓ+ℓ−), versus that of two photons,
M (γγ), for data taken at√s = 4.230 and 4.260 GeV. A clear accumulation of events is observed around the in-tersection of the η and J/ψ mass regions, which indicates e+e− → ηJ/ψ signals. There is no significant signal
ob-served around the intersection of the π0 and J/ψ mass
regions. MC studies show that dominant backgrounds are from the radiative Bhabha and dimuon events, and are expected to be distributed uniformly around the J/ψ and η/π0mass regions. A significantly larger background
yield is observed in the e+e− mode than in the µ+µ−
mode, which is due to the much larger Bhabha scatter-ing cross section compared with the dimuon cross sec-tion. MC simulations show that the resolution of the invariant mass distributions of lepton pairs is about 10.7 MeV/c2 for the µ+µ− mode and 11.5 MeV/c2 for the
e+e− mode. The candidate event of e+e− → ηJ/ψ
is required to be within the J/ψ signal region, defined as 3.067 < M (ℓ+ℓ−) < 3.127 GeV/c2. Sideband
re-gions, defined as 2.932 < M (ℓ+ℓ−) < 3.052 GeV/c2 and
3.142 < M (ℓ+ℓ−) < 3.262 GeV/c2, four times as wide
as the signal region, are used to estimate the non-J/ψ background contributions.
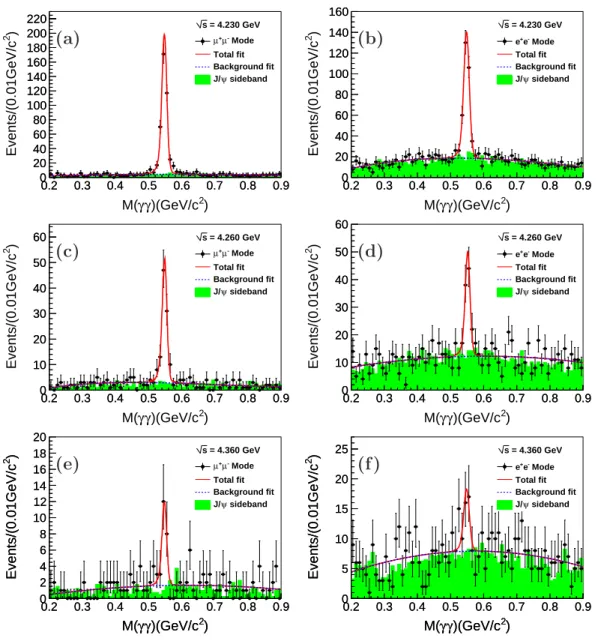
After selecting the J/ψ signal, the invariant mass dis-tributions of two photons, M (γγ), are shown in Fig. 2 for data at√s = 4.230 and 4.260 GeV. Clear η signals are observed. The corresponding normalized distributions from the events in the J/ψ sideband regions are shown as shaded histograms in the plots. The backgrounds are well described by J/ψ sideband events and show no peak-ing structure within the η signal region.
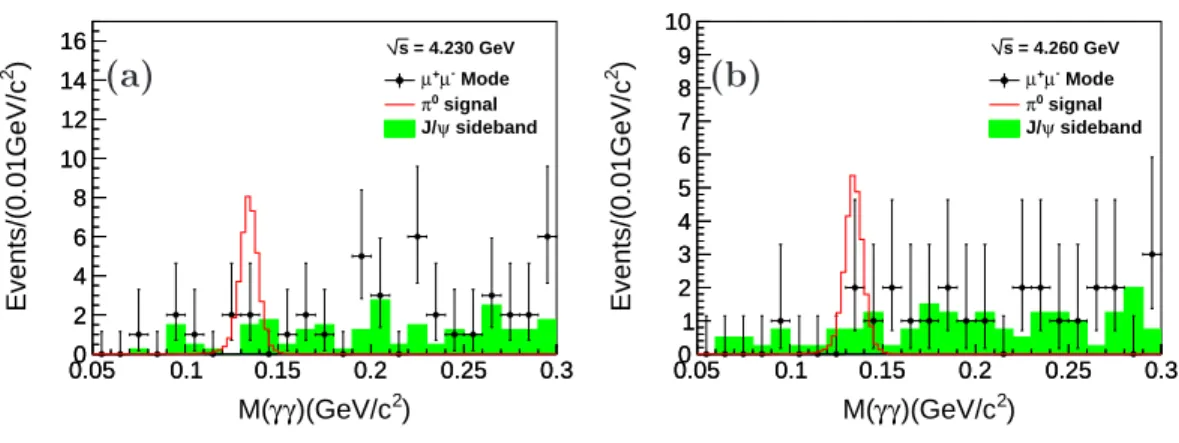
The process e+e− → π0J/ψ is also searched for in
the J/ψ → µ+µ− mode by analyzing the M (γγ)
dis-tribution around the π0 mass region. Such a search is
not performed for the J/ψ → e+e− mode due to the
large background of radiative Bhabha events. Due to the misidentification of π± as µ±, peaking background from
e+e− → π+π−π0 would contaminate the π0 signal for
both candidate events within the J/ψ signal or sideband regions. To remove such backgrounds, we require that at least one charged track has a muon counter hit depth larger than 30 cm. Figure 3 shows the M (γγ) distribu-tions around the π0 mass region after this requirement.
No significant signal is observed for π0→ γγ decays.
IV. FITS TO THE M(γγ) SPECTRUM AND CROSS SECTION RESULTS
After imposing the J/ψ signal selection, an unbinned maximum likelihood fit is performed on M (γγ) in the J/ψ → e+e− and µ+µ− modes, respectively. The
prob-ability density function (PDF) of the M (γγ) distribu-tion for η signals is obtained from signal MC simuladistribu-tions convoluted with a Gaussian function, where the Gaus-sian function describes the difference in resolution be-tween data and MC simulation, and its parameters are left free in the fit. The background shape is described by a second-order Chebyshev polynomial function. The cor-responding fit results for√s = 4.230 and 4.260 GeV are shown in Fig. 2 and the numbers of η signal events are summarized in Table I. The statistical significances of η signals are larger than 8σ, which are examined using the differences in log-likelihood values of fits with or without an η signal component.
The same event selection criteria and fit procedure on M (γγ) are implemented on the other 15 data samples taken at different CM energies. We observe a significant yield of η signal with statistical significance more than
) 2 )(GeV/c γ γ M( 0 0.1 0.2 0.3 0.4 0.5 0.6 0.7 0.8 0.9 ) 2 )(GeV/c -µ + µ M( 2.9 2.95 3 3.05 3.1 3.15 3.2 3.25 3.3
(a)
) 2 )(GeV/c γ γ M( 0 0.1 0.2 0.3 0.4 0.5 0.6 0.7 0.8 0.9 ) 2 )(GeV/c -e + M(e 2.9 2.95 3 3.05 3.1 3.15 3.2 3.25 3.3(b)
) 2 )(GeV/c γ γ M( 0 0.1 0.2 0.3 0.4 0.5 0.6 0.7 0.8 0.9 ) 2 )(GeV/c - µ +µ M( 2.9 2.95 3 3.05 3.1 3.15 3.2 3.25 3.3(c)
) 2 )(GeV/c γ γ M( 0 0.1 0.2 0.3 0.4 0.5 0.6 0.7 0.8 0.9 ) 2 )(GeV/c -e + M(e 2.9 2.95 3 3.05 3.1 3.15 3.2 3.25 3.3(d)
) 2 )(GeV/c γ γ M( 0 0.1 0.2 0.3 0.4 0.5 0.6 0.7 0.8 0.9 ) 2 )(GeV/c -µ + µ M( 2.9 2.95 3 3.05 3.1 3.15 3.2 3.25 3.3(e)
) 2 )(GeV/c γ γ M( 0 0.1 0.2 0.3 0.4 0.5 0.6 0.7 0.8 0.9 ) 2 )(GeV/c -e + M(e 2.9 2.95 3 3.05 3.1 3.15 3.2 3.25 3.3(f)
FIG. 1. Scatter plots of M (ℓ+ℓ−) versus M (γγ) for data at√s = 4.230 (top panels (a, b)), 4.260 GeV (middle panels (c, d))
and 4.360 GeV (bottom panels (c, d)). The two panels on the left-hand side correspond to the µ+µ−mode and the right-hand
side to the e+e−mode. The blue dotted lines denote the η/π0 and J/ψ mass bands. The red dashed lines denote the sideband
regions of J/ψ.
TABLE I. Results on e+e− → ηJ/ψ in data samples in which a signal is observed with a statistical significance larger than
5σ. The table shows the CM energy√s, integrated luminosity Lint, number of observed η events Nηobs(µ+µ−)/Nηobs(e+e−)
from the fit, efficiency ǫµ/ǫe, radiative correction factor (1 + δr), vacuum polarization factor (1 + δv), Born cross section
σB(µ+µ−)/σB(e+e−), combined Born cross section σB
Comand statistical significance. The first uncertainties are statistical and
the second systematic.
√ s(GeV) L(pb−1) Nobs η (µ + µ−) Nobs η (e + e−) ǫ µ(%) ǫe(%) (1 + δr) (1 + δv) σB(µ+µ−)(pb) σB(e+e−)(pb) σComB (pb) Significance 4.190 43.1 17.5 ± 4.3 10.4 ± 3.6 35.2 24.1 0.866 1.056 53.7 ± 13.2 ± 3.1 46.6 ± 16.1 ± 1.7 50.8 ± 10.2 ± 2.1 8.4σ 4.210 54.6 25.7 ± 5.1 14.8 ± 4.5 33.7 23.1 0.914 1.057 61.6 ± 12.2 ± 4.1 51.7 ± 15.7 ± 4.5 57.8 ± 9.6 ± 3.2 10.8σ 4.220 54.1 32.6 ± 5.8 11.4 ± 3.9 33.1 22.8 0.937 1.057 78.2 ± 13.9 ± 5.0 39.6 ± 13.6 ± 2.9 57.7 ± 9.7 ± 3.0 12.0σ 4.230 1091.7 394.3 ± 20.9 274.9 ± 20.1 32.4 22.3 0.960 1.056 46.8 ± 2.5 ± 2.5 47.3 ± 3.5 ± 3.4 47.0 ± 2.0 ± 2.2 >37.0σ 4.245 55.6 9.3 ± 3.3 9.7 ± 3.6 31.4 21.7 0.992 1.056 21.6 ± 7.7 ± 2.4 32.6 ± 12.1 ± 3.5 24.8 ± 6.5 ± 2.0 5.1σ 4.260 825.7 94.4 ± 10.5 75.9 ± 11.9 30.3 20.9 1.021 1.054 14.9 ± 1.7 ± 1.1 17.4 ± 2.7 ± 1.2 15.7 ± 1.4 ± 0.9 17.3σ 4.360 539.8 19.8 ± 5.3 23.9 ± 7.7 25.7 17.7 1.168 1.051 4.9 ± 1.3 ± 0.7 8.7 ± 2.8 ± 1.1 5.6 ± 1.2 ± 0.6 6.2σ 4.420 1074.7 56.9 ± 8.2 42.6 ± 9.9 24.2 16.7 1.225 1.053 7.3 ± 1.1 ± 0.8 7.8 ± 1.8 ± 0.7 7.5 ± 0.9 ± 0.6 11.5σ
0.2 0.3 0.4 0.5 0.6 0.7 0.8 0.9 0 20 40 60 80 100 120 140 160 180 200 220 ) 2 )(GeV/c γ γ M( 0.2 0.3 0.4 0.5 0.6 0.7 0.8 0.9 ) 2 Events/(0.01GeV/c 0 20 40 60 80 100 120 140 160 180 200 220 Mode -µ + µ Total fit Background fit sideband ψ J/ = 4.230 GeV s
(a)
0.2 0.3 0.4 0.5 0.6 0.7 0.8 0.9 0 20 40 60 80 100 120 140 160 ) 2 )(GeV/c γ γ M( 0.2 0.3 0.4 0.5 0.6 0.7 0.8 0.9 ) 2 Events/(0.01GeV/c 0 20 40 60 80 100 120 140 160 Mode -e + e Total fit Background fit sideband ψ J/ = 4.230 GeV s(b)
0.2 0.3 0.4 0.5 0.6 0.7 0.8 0.9 0 10 20 30 40 50 60 ) 2 )(GeV/c γ γ M( 0.2 0.3 0.4 0.5 0.6 0.7 0.8 0.9 ) 2 Events/(0.01GeV/c 0 10 20 30 40 50 60 Mode -µ + µ Total fit Background fit sideband ψ J/ = 4.260 GeV s(c)
0.2 0.3 0.4 0.5 0.6 0.7 0.8 0.9 0 10 20 30 40 50 60 ) 2 )(GeV/c γ γ M( 0.2 0.3 0.4 0.5 0.6 0.7 0.8 0.9 ) 2 Events/(0.01GeV/c 0 10 20 30 40 50 60 Mode -e + e Total fit Background fit sideband ψ J/ = 4.260 GeV s(d)
) 2 )(GeV/c γ γ M( 0.2 0.3 0.4 0.5 0.6 0.7 0.8 0.9 ) 2 Events/(0.01GeV/c 0 2 4 6 8 10 12 14 16 18 20 ) 2 )(GeV/c γ γ M( 0.2 0.3 0.4 0.5 0.6 0.7 0.8 0.9 ) 2 Events/(0.01GeV/c 0 2 4 6 8 10 12 14 16 18 20 Mode -µ + µ Total fit Background fit sideband ψ J/ = 4.360 GeV s(e)
) 2 )(GeV/c γ γ M( 0.2 0.3 0.4 0.5 0.6 0.7 0.8 0.9 ) 2 Events/(0.01GeV/c 0 5 10 15 20 25 ) 2 )(GeV/c γ γ M( 0.2 0.3 0.4 0.5 0.6 0.7 0.8 0.9 ) 2 Events/(0.01GeV/c 0 5 10 15 20 25 Mode -e + e Total fit Background fit sideband ψ J/ = 4.360 GeV s(f)
FIG. 2. Invariant mass distributions of two photons for data at√s = 4.230 (top panels (a, b)), 4.260 GeV (middle panels (c, d)) and 4.360 GeV (bottom panels (e, f)). The left two plots are for the J/ψ → µ+µ−mode and the right two for J/ψ → e+e−
mode. Dots with error bars are for data in the J/ψ signal region, the green shaded histograms for the normalized J/ψ sideband events, the red solid curves for the total fit results and the blue dotted curves for the background from the fit.
5σ for data at√s = 4.190, 4.210, 4.220, 4.245, 4.360 and 4.420 GeV. The number of events and statistical signifi-cance of η signal for these samples are listed in Table I. The scatter plots of the invariant mass of the lepton pairs (M (ℓ+ℓ−)) versus that of the two photons (M (γγ)) and
fit results of the η signal for data taken at √s = 4.360 GeV are illustrated in Fig. 1 ((e) and (f)) and Fig. 2 ((e) and (f)), respectively. For the other 9 data samples at √s = 3.810, 3.900, 4.090, 4.310, 4.390, 4.470, 4.530, 4.575 and 4.600 GeV, the statistical significances of η signal are found to be less than 5σ, and the upper limits at the 90% confidence level (C.L.) on the Born cross section are de-termined. Due to the large background from Bhabha events in the J/ψ → e+e− decay mode, only the decay
mode J/ψ → µ+µ−is considered when setting the upper
limit. Since the statistics are low, the number counting method is performed to extract the number of signal and background events to avoid the large uncertainty of back-ground shape. The number of observed signal events is obtained by counting the entries in the η signal region (0.518 < M (γγ) < 0.578 GeV/c2). The number of
back-ground events in the signal region is estimated with the events in the η sideband region or J/ψ sideband region (with an additional η signal mass window requirement) corrected with a factor. The correction factors, which take into account the difference on the number of back-ground events in the signal region and sideband regions, are extracted by fitting on the M (γγ) distributions for
0.050 0.1 0.15 0.2 0.25 0.3 2 4 6 8 10 12 14 16 ) 2 )(GeV/c γ γ M( 0.05 0.1 0.15 0.2 0.25 0.3 ) 2 Events/(0.01GeV/c 0 2 4 6 8 10 12 14 16 Mode -µ + µ signal 0 π sideband ψ J/ = 4.230 GeV s
(a)
0.050 0.1 0.15 0.2 0.25 0.3 1 2 3 4 5 6 7 8 9 10 ) 2 )(GeV/c γ γ M( 0.05 0.1 0.15 0.2 0.25 0.3 ) 2 Events/(0.01GeV/c 0 1 2 3 4 5 6 7 8 9 10 Mode -µ + µ signal 0 π sideband ψ J/ = 4.260 GeV s(b)
FIG. 3. Invariant mass distributions of two photons for data at√s = 4.230 (a) and 4.260 GeV (b) in J/ψ → µ+µ−mode. Dots
with error bars are for data in the J/ψ signal region, the green shaded histograms are the normalized J/ψ sideband events and the red histograms are π0 MC signal with arbitrary normalization.
the data samples with high statistics. The η sideband region is defined as 0.383 < M (γγ) < 0.503 GeV/c2 and
0.593 < M (γγ) < 0.713 GeV/c2, where their sizes are
four times as that of the signal region. The results are all listed in Table II.
The Born cross section is calculated by:
σB = N
obs
Lint· (1 + δr) · (1 + δv) · ǫ · B, (1)
where Nobsis the number of observed signal events, L int
is the integrated luminosity, (1+δr) is the ISR correction
factor which is obtained by QED calculation [33] and taking the line shape of the Born cross section measured by the Belle experiment [18]. The vacuum polarization (VP) factor (1 + δv) is taken from a QED calculation
with an accuracy of 0.5% [34], ǫ is the detection efficiency including reconstruction and all selection criteria, B is the product branching ratio, and B(J/ψ → ℓ+ℓ−) · B(η →
γγ), taken from the Particle Data Group (PDG) [35]. The final Born cross sections of e+e− → ηJ/ψ at
en-ergy points with a statistically significant observation of signal events are listed in Table I.
For the other energy points where the η signal is not significant, we set upper limits at the 90% C.L. on the Born cross section. The upper limit is calculated by a frequentist method with a profile likelihood treatment of systematic uncertainties taken into account in the effi-ciency uncertainty, which is implemented by a C++ class TROLKE in the ROOT framework [36]. The numbers of observed signal events and estimated background events are assumed to follow a Poisson distribution, and the efficiencies are assumed to have Gaussian uncertainties. Since the number of background events can be estimated from either the η or J/ψ sideband events, the one with the larger upper limit on the Born cross section is taken as the final result as a conservative estimation. The re-sults on the upper limits are listed in Table II. An-other approach using the Bayesian method by fitting the M (γγ) distribution is implemented to extract the
up-per limit on the Born cross section, a consistent result is achieved.
Since there is no significant signal of e+e− → π0J/ψ
observed at any energy, we set upper limits at the 90% C.L. on the Born cross section. The number of observed events is obtained by counting the entries in the π0signal region (0.120 < M (γγ) < 0.150 GeV/c2). The number
of background events in the signal region is estimated by counting the number of events in the π0 sideband
regions (0.055 < M (γγ) < 0.115 GeV/c2 and 0.155 <
M (γγ) < 0.215 GeV/c2) or J/ψ sideband regions (with
an additional π0 signal mass window requirement). The
same frequentist method is implemented to extract the upper limits. The results and the related variables used to calculate the upper limit are listed in Table III.
V. SYSTEMATIC UNCERTAINTIES
Several sources of systematic uncertainties are con-sidered in the measurement of the Born cross sections. These include differences between data and MC simula-tion for the tracking efficiency, photon detecsimula-tion, kine-matic fit, mass window requirement, the fit procedure, the shower depth in the MUC, MC simulation of the ISR correction factor and vacuum polarization factor, as well as uncertainties in the branching fractions of intermedi-ate stintermedi-ate decays and in the luminosity measurements.
(a) Tracking: The uncertainty of the tracking effi-ciency is investigated using a control sample ψ(3686) → π+π−J/ψ with the subsequent decay of J/ψ → ℓ+ℓ−.
The difference in tracking efficiency for the lepton recon-struction between data and MC simulation is estimated to be 1% per track. So, 2% is taken as the systematic uncertainty for the two leptons.
(b) Photon detection efficiency: The uncertainty due to the photon detection and reconstruction efficiency is 1% per photon [37]. This value is determined from stud-ies using background-free control samples J/ψ → ρ0π0
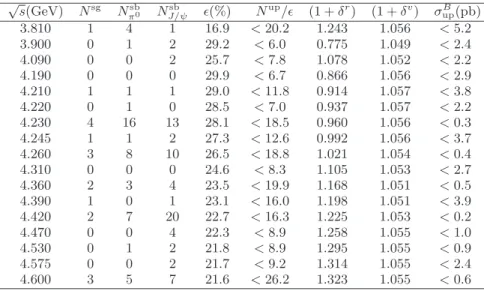
TABLE II. Upper limits of e+e−→ ηJ/ψ using the µ+µ−mode. The table shows the CM energy √s, integrated luminosity
Lint, number of observed η events Nηsg, number of background from η sideband Nηsb, and from J/ψ sideband NJ/ψsb , efficiency ǫ,
upper limit of signal number with the consideration of selection efficiency Nup
η /ǫ (at the 90% C.L.), radiative correction factor
(1 + δr), vacuum polarization factor (1 + δv), Born cross section σBand upper limit on the Born cross sections σB
up(at the 90%
C.L.). The first uncertainties are statistical and the second systematic. √s(GeV) L(pb−1) Nsg η Nηsb NJ/ψsb ǫ(%) Nηup/ǫ (1 + δr) (1 + δv) σB(pb) σBup(pb) 3.810 50.5 5 9 11 32.3 < 23.3 1.243 1.056 5.5+7.1 −4.6± 0.2 < 15.1 3.900 52.6 5 8 7 38.3 < 20.9 0.775 1.049 7.9+9.2 −5.9± 0.3 < 20.8 4.090 52.6 7 7 5 31.0 < 36.3 1.087 1.052 12.2+9.0 −6.2± 0.9 < 25.9 4.310 44.9 1 4 2 27.4 < 11.7 1.105 1.053 0.0+7.2 −2.9± 0.0 < 9.5 4.390 55.2 5 1 4 25.0 < 38.4 1.198 1.051 11.7+8.5 −5.4± 0.6 < 23.5 4.470 109.9 2 12 8 23.5 < 14.7 1.258 1.055 −1.2+3.5 −1.9± 0.1 < 4.3 4.530 110.0 5 6 4 22.8 < 38.2 1.295 1.055 4.3+4.3 −2.8± 0.2 < 10.8 4.575 47.7 2 2 1 22.6 < 22.5 1.314 1.055 4.3+7.7 −3.8± 0.2 < 14.5 4.600 570.0 5 34 19 22.4 < 23.0 1.323 1.055 −0.8+0.9−0.6± 0.1 < 1.2
TABLE III. Upper limits of e+e−→ π0J/ψ. The table shows the number of observed events in the π0signal region Nsg, number
of events in π0 sideband Nsb
π0, and in J/ψ sideband NJ/ψsb , efficiency ǫ, the upper limit of signal events with the consideration
of the selection efficiency Nup(µ+µ−)/ǫ (at the 90% C.L.) and the upper limit of Born cross sections σB
up(at the 90% C.L.). √s(GeV) Nsg Nsb π0 NJ/ψsb ǫ(%) Nup/ǫ (1 + δr) (1 + δv) σupB(pb) 3.810 1 4 1 16.9 < 20.2 1.243 1.056 < 5.2 3.900 0 1 2 29.2 < 6.0 0.775 1.049 < 2.4 4.090 0 0 2 25.7 < 7.8 1.078 1.052 < 2.2 4.190 0 0 0 29.9 < 6.7 0.866 1.056 < 2.9 4.210 1 1 1 29.0 < 11.8 0.914 1.057 < 3.8 4.220 0 1 0 28.5 < 7.0 0.937 1.057 < 2.2 4.230 4 16 13 28.1 < 18.5 0.960 1.056 < 0.3 4.245 1 1 2 27.3 < 12.6 0.992 1.056 < 3.7 4.260 3 8 10 26.5 < 18.8 1.021 1.054 < 0.4 4.310 0 0 0 24.6 < 8.3 1.105 1.053 < 2.7 4.360 2 3 4 23.5 < 19.9 1.168 1.051 < 0.5 4.390 1 0 1 23.1 < 16.0 1.198 1.051 < 3.9 4.420 2 7 20 22.7 < 16.3 1.225 1.053 < 0.2 4.470 0 0 4 22.3 < 8.9 1.258 1.055 < 1.0 4.530 0 1 2 21.8 < 8.9 1.295 1.055 < 0.9 4.575 0 0 2 21.7 < 9.2 1.314 1.055 < 2.4 4.600 3 5 7 21.6 < 26.2 1.323 1.055 < 0.6
and e+e− → γγ. Therefore, an uncertainty of 2% is
taken for the detection efficiency of two photons. (c) Kinematic fit: In order to reduce the difference on the 4C kinematic fit χ2
4C between data and MC
simula-tions, the track helix parameters (φ0, κ, tan λ) of
sim-ulated tracks have been corrected, where φ0 is the
az-imuthal angle that specifies the pivot with respect to the helix center, κ is the reciprocal of the transverse momen-tum, and tan λ is the slope of the track. The correction factors are obtained from a nearly background-free sam-ple of e+e− → π+π−J/ψ and J/ψ → e+e−/µ+µ− at
√
s = 4.230 GeV. An alternative detector efficiency is evaluated with the same MC samples, but without helix parameters corrections. The difference in this efficiency from its nominal value is taken to be the uncertainty due to the 4C kinematic fit requirement [38].
(d) Mass window requirements: A mass window re-quirement on the ℓ+ℓ− invariant mass introduces a
sys-tematic uncertainty on its efficiency. The J/ψ signal at √
s = 4.230 GeV is fitted with a MC shape convoluted with a Gaussian function, where the parameters of the Gaussian function are left free in the fit. To evaluate the systematic effects on the mass window requirement, the invariant mass of ℓ+ℓ− in MC samples are smeared with
a Gaussian function, where the parameters of the Gaus-sian function are obtained from the fit. The difference in the efficiencies between the signal MC sample with and without mass resolution smearing is 0.2% in the µ+µ−
mode and 0.1% in the e+e− mode, and is taken as the
systematic uncertainty.
(e) Fitting procedure: For the eight data samples with clearly observed η signals, fits to the two photon invari-ant mass M (γγ) are performed to extract the number of e+e− → ηJ/ψ decays. The following three aspects are
considered when evaluating the systematic uncertainty associated with the fit procedure. (1) Fitting range: In
TABLE IV. Summary of systematic uncertainties (%) in the cross section of e+e−→ ηJ/ψ for energies with significant signal
in the µ+µ−(e+e−) mode. The common uncertainties (Luminosity, Tracking, Photon, Branching fraction and Others) between
the two modes are shown together.
Source/√s(GeV) 4.190 4.210 4.220 4.230 4.245 4.260 4.360 4.420 Luminosity 1.0 1.0 1.0 1.0 1.0 1.0 1.0 1.0 Tracking 2.0 2.0 2.0 2.0 2.0 2.0 2.0 2.0 Photon 2.0 2.0 2.0 2.0 2.0 2.0 2.0 2.0 Kinematic fit 0.4 (0.4) 0.4 (0.4) 0.4 (0.3) 0.4 (0.3) 0.5 (0.5) 0.4 (0.4) 0.3 (0.4) 0.4 (0.4) Mass window 0.2 (0.1) 0.2 (0.1) 0.2 (0.1) 0.2 (0.1) 0.2 (0.1) 0.2 (0.1) 0.2 (0.1) 0.2 (0.1) Fitting range 0.0 (1.0) 0.4 (0.7) 0.3 (2.6) 0.1 (2.2) 0.0 (1.0) 0.0 (0.6) 8.6 (7.5) 0.7 (2.1) Signal shape 0.3 (1.1) 0.3 (1.1) 0.3 (1.1) 0.3 (1.1) 0.3 (1.1) 0.3 (1.1) 0.3 (1.1) 0.3 (1.1) Background shape 4.6 (0.1) 3.9 (6.8) 2.8 (0.0) 0.0 (0.1) 9.7 (9.3) 0.2 (0.0) 0.5 (0.4) 0.1 (0.2) ISR factor 0.6 (0.3) 4.3 (4.2) 4.7 (6.0) 4.2 (5.9) 4.0 (3.6) 6.6 (5.8) 9.4 (9.1) 10.5 (7.7) Branching fraction 0.8 0.8 0.8 0.8 0.8 0.8 0.8 0.8 Others 1.0 1.0 1.0 1.0 1.0 1.0 1.0 1.0 Sum 5.7 (3.6) 6.7 (8.7) 6.4 (7.4) 5.3 (7.2) 11.0 (10.6) 7.4 (6.8) 13.2 (12.3) 11.0 (8.7)
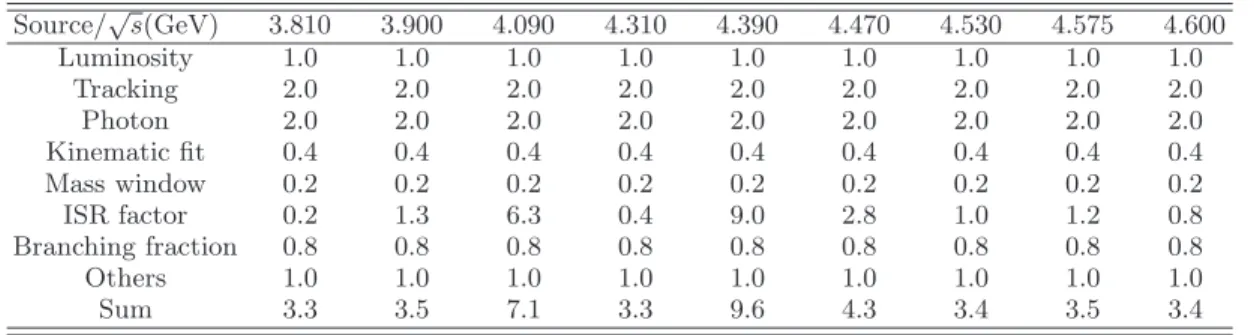
TABLE V. Summary of systematic uncertainties (%) in the upper limit on cross section of e+e−→ ηJ/ψ in µ+µ−mode.
Source/√s(GeV) 3.810 3.900 4.090 4.310 4.390 4.470 4.530 4.575 4.600 Luminosity 1.0 1.0 1.0 1.0 1.0 1.0 1.0 1.0 1.0 Tracking 2.0 2.0 2.0 2.0 2.0 2.0 2.0 2.0 2.0 Photon 2.0 2.0 2.0 2.0 2.0 2.0 2.0 2.0 2.0 Kinematic fit 0.4 0.4 0.4 0.4 0.4 0.4 0.4 0.4 0.4 Mass window 0.2 0.2 0.2 0.2 0.2 0.2 0.2 0.2 0.2 ISR factor 0.2 1.3 6.3 0.4 9.0 2.8 1.0 1.2 0.8 Branching fraction 0.8 0.8 0.8 0.8 0.8 0.8 0.8 0.8 0.8 Others 1.0 1.0 1.0 1.0 1.0 1.0 1.0 1.0 1.0 Sum 3.3 3.5 7.1 3.3 9.6 4.3 3.4 3.5 3.4
the fit, the M (γγ) is fitted in a region from 0.2 to 0.9 GeV/c2. An alternative fit with a different fit range, from
0.25 to 0.85 GeV/c2, is performed. The differences in the
yield are treated as the systematic uncertainty from the fit range. (2) Signal shape: In the fit, the signal shape is described by a shape obtained from a MC simulation convoluted with a Gaussian function. An alternative fit with a Crystal Ball function [39] for the η signal shape is performed, where the parameters of the Crystal Ball function at different CM energies are fixed to those ob-tained from the fit of the η signal at √s = 4.230 GeV. The difference in the yield with respect to the nominal fit is considered as the systematic uncertainty from the sig-nal shape. (3) Background shape: In the fit, background shapes are described as a second-order polynomial func-tion. The fit with a third-order polynomial function for the background shape is used to estimate its uncertainty. For the data sets where no evident η signal is found, the frequentist method is employed to determine upper limits on the Born cross section, and the numbers of signal and background events are obtained by counting the entries in signal and sideband regions. Two different sideband regions, either the η sideband region or the J/ψ side-band region, are used to estimate the uncertainty from the background shape. The systematic uncertainty as-sociated with the background shape has been considered by taking the most conservative upper limit as the final
result.
(f) MUC requirement: In the search for the process e+e− → π0J/ψ, an additional requirement on the hit
depth in the MUC for muon tracks was imposed to re-move the background from e+e−→ π+π−π0. By
study-ing the control sample of e+e−→ π+π−J/ψ with a
sub-sequent decay of J/ψ → µ+µ− at√s = 4.230 GeV, the
efficiency difference of this requirement between data and MC sample was found to be (9.0 ± 1.2)%. The MC effi-ciency has been corrected for this difference and a value of 1.2% is taken as the corresponding systematic uncer-tainty.
(g) ISR factor: The uncertainties of the line shape of the cross section used in the KKMC generator introduce uncertainties in both the radiative correction factor and the efficiency. In the nominal results, the line shape of the cross section is taken from the fit result from the Belle experiment [18]. We have also performed a new fit with three incoherent Breit-Wigner functions, including the Y (4360) and a second order polynomial function, to the same observed cross section σ(e+e−→ ηJ/ψ), where
the parameters of the Breit-Wigner functions are left free in the fit. With this line shape of the cross section, the variations in (1 + δr) × ǫ are taken as the uncertainties.
(h) Luminosity: The integrated luminosity of data samples used in this analysis are measured using large angle Bhabha events, and the corresponding
uncertain-TABLE VI. Summary of systematic uncertainties (%) in the cross section of e+e−→ π0J/ψ. Source/√s(GeV) 3.810 3.900 4.090 4.190 4.210 4.220 4.230 4.245 4.260 4.310 4.360 4.390 4.420 4.470 4.530 4.575 4.600 Luminosity 1.0 1.0 1.0 1.0 1.0 1.0 1.0 1.0 1.0 1.0 1.0 1.0 1.0 1.0 1.0 1.0 1.0 Tracking 2.0 2.0 2.0 2.0 2.0 2.0 2.0 2.0 2.0 2.0 2.0 2.0 2.0 2.0 2.0 2.0 2.0 Photon 2.0 2.0 2.0 2.0 2.0 2.0 2.0 2.0 2.0 2.0 2.0 2.0 2.0 2.0 2.0 2.0 2.0 Kinematic fit 0.4 0.4 0.4 0.4 0.4 0.4 0.4 0.4 0.4 0.4 0.4 0.4 0.4 0.4 0.4 0.4 0.4 Mass window 0.2 0.2 0.2 0.2 0.2 0.2 0.2 0.2 0.2 0.2 0.2 0.2 0.2 0.2 0.2 0.2 0.2 MUC cut 1.2 1.2 1.2 1.2 1.2 1.2 1.2 1.2 1.2 1.2 1.2 1.2 1.2 1.2 1.2 1.2 1.2 ISR factor 0.2 1.1 6.5 0.3 4.6 5.7 3.9 4.1 6.7 0.8 9.6 8.7 7.9 1.0 0.7 0.5 0.7 Branching fraction 0.6 0.6 0.6 0.6 0.6 0.6 0.6 0.6 0.6 0.6 0.6 0.6 0.6 0.6 0.6 0.6 0.6 Others 0.6 0.6 0.6 0.6 0.6 0.6 0.6 0.6 0.6 0.6 0.6 0.6 0.6 0.6 0.6 0.6 0.6 Sum 3.5 3.6 7.4 3.5 5.8 6.7 5.2 5.4 7.5 3.6 10.2 9.4 8.6 3.6 3.5 3.5 3.5
ties are estimated to be 1.0% [40].
(i) Branching fractions: The experimental uncertain-ties in the branching fractions for the processes J/ψ → ℓ+ℓ−, η → γγ and π0→ γγ are taken from the PDG [35].
(j) Other systematic uncertainties: Other sources of systematic uncertainties include the trigger efficiency, event start time determination and final-state-radiation simulation. The total systematic uncertainty due to these sources is estimated to be less than 1.0%. To be conser-vative, we take 1.0% as the systematic uncertainty.
Assuming all of the above systematic uncertainties, shown in Table IV, Table V and Table VI, are indepen-dent, the total systematic uncertainties are obtained by adding the individual uncertainties in quadrature.
For the energy points where statistically significant sig-nal yields were found, the results from the two J/ψ decay modes are found to be consistent. The combined cross sections are calculated by considering the correlation of uncertainties between these two measurements [41] and the results are also listed in Table I.
VI. SUMMARY AND DISCUSSION
In summary, using data samples collected with the BE-SIII detector at 17 energies from 3.810 to 4.600 GeV, we performed an analysis of e+e− → ηJ/ψ. Statistically
significant η signals are observed at √s = 4.190, 4210, 4220, 4230, 4245, 4260, 4360 and 4420 GeV, and the corresponding Born cross sections are measured. In ad-dition, we searched for the process e+e− → π0J/ψ. No
significant signals are observed and the upper limits at the 90% C.L. on the Born cross section are set.
A comparison of the Born cross sections σ(e+e− →
ηJ/ψ) in this measurement to that of previous re-sults [18, 26] is shown in Fig. 4, and a very good agree-ment is achieved. The measured Born cross sections are also compared to that of e+e− → π+π−J/ψ obtained
from Belle [4]. Different lineshapes are observed in these two processes, which indicate that the production mecha-nism of the ηJ/ψ clearly differs from that of π+π−J/ψ in
the vicinity of√s = 4.1-4.6 GeV. This could indicate the existence of a rich spectrum of Y states in this energy region with different coupling strengths to the various
(GeV)
s
3.8 3.9
4
4.1 4.2 4.3 4.4 4.5 4.6 4.7
) (pb)
ψ
J/
η
→
-e
+(e
σ
-20
0
20
40
60
80
100
Belle BESIII(2012) This workFIG. 4. A comparison of the measured Born cross section of e+e−→ ηJ/ψ to that of previous measurements [18, 26].
The blue dots are results from Belle, the black star dot is from BESIII(2012) and the red square dots are the results obtained in this work. The errors of the Belle data only include the statistical uncertainty. For the previously published BESIII results and our data, the errors reflect both statistical and systematical uncertainties.
decay modes.
Compared with a theoretical prediction [25] that con-siders open charm effects on the exclusive cross section line shapes of e+e− → ηJ/ψ and π0J/ψ, our results on
ηJ/ψ are within the range of the theoretical prediction, and the obtained π0J/ψ upper limits are higher by a
factor of 50 than that of the theoretical prediction.
ACKNOWLEDGMENTS
The BESIII collaboration thanks the staff of BEPCII and the IHEP computing center for their strong sup-port. This work is supported in part by National Key Basic Research Program of China under Contract No. 2015CB856700; National Natural Science
Founda-tion of China (NSFC) under Contracts Nos. 10935007, 11121092, 11125525, 11235011, 11322544, 11335008, 11375170, 11275189, 11079030, 11475164, 11005109, 11475169; the Chinese Academy of Sciences (CAS) Scale Scientific Facility Program; Joint Large-Scale Scientific Facility Funds of the NSFC and CAS under Contracts Nos. 11179007, U1232201, U1332201; CAS under Contracts Nos. YW-N29, KJCX2-YW-N45; 100 Talents Program of CAS; INPAC and Shanghai Key Laboratory for Particle Physics and Cos-mology; German Research Foundation DFG under
Con-tract No. Collaborative Research Center CRC-1044; Is-tituto Nazionale di Fisica Nucleare, Italy; Ministry of Development of Turkey under Contract No. DPT2006K-120470; Russian Foundation for Basic Research under Contract No. 14-07-91152; U. S. Department of Energy under Contracts Nos. 04ER41291, DE-FG02-05ER41374, DE-FG02-94ER40823, DESC0010118; U.S. National Science Foundation; University of Groningen (RuG) and the Helmholtzzentrum fuer Schwerionen-forschung GmbH (GSI), Darmstadt; WCU Program of National Research Foundation of Korea under Contract No. R32-2008-000-10155-0.
[1] B. Aubert et al. (BABAR Collaboration), Phys. Rev. Lett. 95, 142001 (2005);
J. P. Lees et al. (BABAR Collaboration), Phys. Rev. D 86, 051102(R) (2012).
[2] B. Aubert et al. (BABAR Collaboration), Phys. Rev. Lett. 98, 212001 (2007);
J. P. Lees et al. (BABAR Collaboration), Phys. Rev. D 89, 111103(R) (2014).
[3] C. Z. Yuan et al. (Belle Collaboration), Phys. Rev. Lett. 99, 182004 (2007).
[4] Z. Q. Liu et al. (Belle Collaboration), Phys. Rev. Lett. 110, 252002 (2013).
[5] X. L. Wang et al. (Belle Collaboration), Phys. Rev. Lett. 99, 142002 (2007).
[6] X. L. Wang et al. (Belle Collaboration), arXiv:1410.7641 [hep-ex].
[7] Q. He et al. (CLEO Collaboration), Phys. Rev. D 74, 091104(R) (2006).
[8] T. Barnes, S. Godfrey and E. S. Swanson, Phys. Rev. D 72, 054026 (2005).
[9] B. Aubert et al. (BABAR Collaboration), Phys. Rev. D 76, 111105(R) (2007);
B. Aubert et al. (BABAR Collaboration), Phys. Rev. D 79, 092001 (2009);
G. Pakhlova et al. (Belle Collaboration), Phys. Rev. Lett. 98, 092001 (2007);
G. Pakhlova et al. (Belle Collaboration), Phys. Rev. D 77, 011103(R) (2008);
G. Pakhlova et al. (Belle Collaboration), Phys. Rev. Lett. 100, 062001 (2008);
G. Pakhlova et al. (Belle Collaboration), Phys. Rev. D 80, 091101(R) (2009).
[10] T. E. Coan et al. (CLEO Collaboration), Phys. Rev. Lett. 96, 162003 (2006).
[11] J. Z. Bai et al. (BES Collaboration), Phys. Rev. Lett. 88, 101802 (2002).
[12] M. Ablikim et al. (BESIII Collaboration), Phys. Rev. Lett. 110, 252001 (2013).
[13] T. Xiao, S. Dobbs, A. Tomaradze, Kamal K. Seth, Phys. Lett. B. 727, (2013) 366-370.
[14] M. Ablikim et al. (BESIII Collaboration), Phys. Rev. Lett. 112, 022001 (2014).
[15] M. Ablikim et al. (BESIII Collaboration), Phys. Rev. Lett. 111, 242001 (2013).
[16] M. Ablikim et al. (BESIII Collaboration), Phys. Rev. Lett. 112, 132001 (2014).
[17] M. Ablikim et al. (BESIII Collaboration), Phys. Rev. Lett. 113, 212002 (2014).
[18] X. L. Wang et al. (Belle Collaboration), Phys. Rev. D. 87, 051101(R) (2013).
[19] M. Ablikim et al. (BESIII Collaboration), Phys. Rev. Lett. 114, 092003 (2015).
[20] F. E. Close and P.R. Page, Phys. Lett. B. 628, 215 (2005);
S. L. Zhu, Phys. Lett. B. 625, 212 (2005);
E. Kou and O. Pene, Phys. Lett. B. 631, 164 (2005); X. Q. Luo and Y. Liu, hep-lat/0512044.
[21] D. Ebert, R. N. Faustov, and V. O. Galkin, Phys. Lett. B. 634, 214 (2006);
L. Maiani, V. Riquer, F. Piccinini and A. D. Polosa, Phys. Rev. D. 72, 031502(R) (2005);
T. W. Chiu and T. H. Hsieh (TWQCD Collaboration), heplat/0512029.
[22] X. Liu, X. Q. Zeng and X. Q. Li, Phys. Rev. D. 72, 054023(R) (2005);
C. F. Qiao, Phys. Lett. B. 639, 263 (2006);
C. Z. Yuan, P. Wang and X. H. Mo, Phys. Lett. B. 634, 399 (2006).
[23] Y. P. Kuang, Front. Phys. China 1, 19 (2006).
[24] C. F. Qiao, R. L. Zhu, Phys. Rev. D. 89, 074006 (2014). [25] Q. Wang, X. H. Liu, and Q. Zhao, Phys. Rev. D. 84,
014007 (2011).
[26] M. Ablikim et al. (BESIII Collaboration), Phys. Rev. D. 86, 071101(R) (2012).
[27] T. E. Coan et al. (CLEO Collaboration), Phys. Rev. Lett. 96, 162003 (2006).
[28] M. Ablikim et al. (BESIII Collaboration), Nucl. Instrum. Meth. A 614, 345 (2010).
[29] E. V. Abakumova et al., Nucl. Instrum. Methods Phys. Res., Sect. A 659, 21 (2011).
[30] S. Agostinelli et al. (GEANT4 Collaboration), Nucl. In-strum. Meth. A 506, 250 (2003).
[31] S. Jadach, B. F. L. Ward and Z. Was, Comp. Phys. Commu. 130, 260 (2000); Phys. Rev. D. 63, 113009 (2001).
[32] K. T. Chao et al., Modern Physics A, 24 N0.1 supp. (2009); R. G. Ping, Chin. Phys. C 32, 599 (2008); D. J. Lange, Nucl. Instrum. Meth. A 462, 152 (2001); [33] E. A. Kuraev and V. S. Fadin, Yad. Fiz. 41, 733-742
(1985).
[35] K.A. Olive et al. (Particle Data Group), Chin. Phys. C. 38, 090001 (2014).
[36] W. A. Rolke et al. Nucl. Instrum. Meth. A 551, 439 (2005).
[37] M. Ablikim et al. (BESIII Collaboration), Phys. Rev. D 81, 052005 (2010).
[38] M. Ablikim et al. (BESIII Collaboration), Phys. Rev. D 87, 012002 (2013).
[39] T. Skwarnicki, PhD thesis, DESY-F31-86-02. See https://root.cern.ch/download/doc/RooFit_Users_ Manual_2.91-33.pdffor the implementation used. [40] M. Ablikim et al. [BESIII Collaboration],
arXiv:1503.03408 [hep-ex].
[41] M. Ablikim et al. (BESIII Collaboration), Phys. Rev. D 89, 074030 (2014).
![FIG. 4. A comparison of the measured Born cross section of e + e − → ηJ/ψ to that of previous measurements [18, 26].](https://thumb-eu.123doks.com/thumbv2/9libnet/4231107.66578/11.918.82.837.113.290/fig-comparison-measured-born-cross-section-previous-measurements.webp)
