Regional efficiency analysis of Turkish commercial banks with the use of data envelopment analysis between years 2007 - 2012
197
0
0
Tam metin
(2)(3)
(4)
(5)
(6)
(7)
(8)
(9)
(10)
(11)
(12)
(13)
(14)
(15)
(16)
(17)
(19)
(20)
(21)
(22)
(23)
(24)
(25)
(26)
(27)
(28)
(29)
(30)
(31)
(32)
(33)
(34)
(35)
(36)
(37)
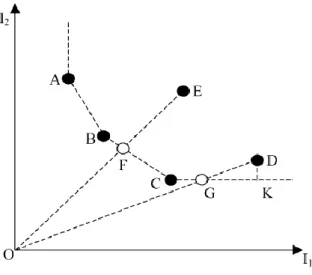
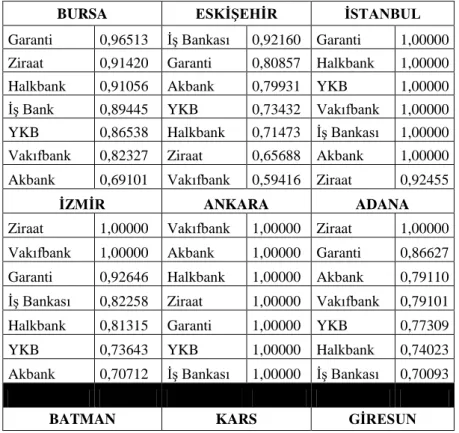
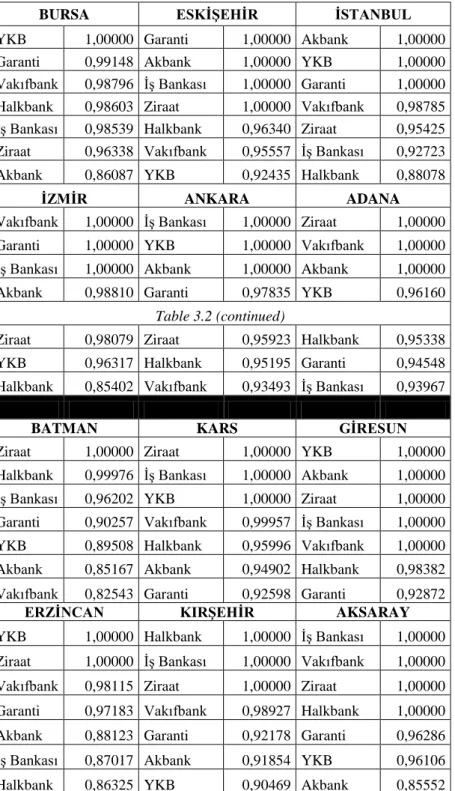
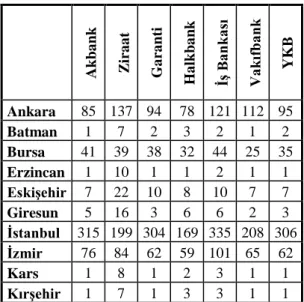
Şekil
Benzer Belgeler
[r]
symptoms before or after diagnosis were more likely to adhere to self management activities than those who were uncertain; (3) the findings of confirmatory factor analysis
Dolayısıyla insan merkezli olan Bektaşi ve Alevi kültüründe Tanrı, herkesin tanrısıdır, ibadet herkes içindir, bu nedenle kadın ve erkek beraber ibadet eder.. Onlar
O zamanlar Boğaziçi cennetten bir nümuney- di. Hele mehtab geceleri denizin yüzü seyirci kayıklarile resmi ahnacak bir şekil ve mahiyet teydi. Malûm ya, en güzel
Araştırmada, Google Lighthouse analiz aracının ölçtüğü SEO skoru ile arama motoru sonuç sayfalarında ortaya çıkan sıralama arasındaki ilişkinin tespit
Lomber KMY sonuçlar› gruplar kendi içinde tedavi sonras›, öncesiyle karfl›- laflt›r›ld›¤›nda istatistiksel olarak anlaml› bir iyileflme saptand› (alendronat
Resveratrolün Kardiyovasküler Hastalıklar Üzerine Etkileri Effects of Resveratrol on Cardiovascular Diseases.. Enver Çıracı 1 , Tuğçe
Multicomponent Efficiency Measurement and Shared Inputs in Data Envelopment Analysis: An Application to Sales and Service Performance in Bank Branches.. Sales
