PROBABILISTIC PREDICTION OF THE NEXT
EARTHQUAKE IN THE NAFZ (NORTH ANATOLIAN FAULT
ZONE), TURKEY
KUZEY ANADOLU FAY ZONUNDA (NAFZ) GELECEK DEPREMLER N OLASILIKSAL TAHM N
Veysel YILMAZ
Department of Statistics, Science and Literature Faculty Osmangazi University
Murat ER O LU
Department of Statistics, Science and Literature Faculty Selçuk University
H. Eray ÇEL K
Department of Statistics, Science and Literature Faculty Osmangazi University
ABSTRACT
Statistical methods are useful for characterizing seismic hazard because earthquakes are, for all practical purposes, random phenomena. They provide additional insights to the seismic hazard or risk problem. Seismic risk and earthquake occurrence probabilities can be estimated by using probability distributions. In this study Weibull, Log-normal, Log-logistic, Exponential and Gamma distributions have been examined for which one has the best fit for the given data. Kolmogorov-Smirnov test statistics was used at the research of the distribution best represents earthquake data. At the end of the test, it has been detected that Weibull distribution is more appropriate than other distributions.
Key Words: Earthquake Prediction, Probability Distributions, Kolmogorov-Smirnov Test
ÖZET
Depremler rassal olaylar oldu u için bu alanda istatistiksel metotların kullanımı yaygındır. statistiksel metotlar risk problemlerinin çözümlenmesinde kullanılır. Sismik risk ve deprem meydana gelme olasılıkları istatistiksel olasılık da ılımıları yardımıyla tahmin edilebilir. Bu çalı mada Weibull, Log-normal, Log-lojistik, Üstel ve Gamma da ılımları kullanılarak deprem verisini en iyi ekilde temsil edecek olasılık da ılımı bulunmaya çalı ılmı tır. Bu amaçla etkin olasılık da ılımının belirlenmesinde Kolmogorov-Smirnov test istatisti i kullanılmı tır. Çalı ma sonucunda Weibull da ılımının di er olasılık da ılımlarına gore deprem verisini en iyi ekilde temsil etti i görülmü tür.
Anahtar Kelimeler : Deprem tahmini, Olasılık Da ılımları, Kolmogorov- Simirnov Testi
1. Introduction
It has been one quarter century since Utsu (1972a, 1972b), Rikitake (1974) and Hagiwara (1974) proposed a probabilistic approach for forecasting the time of the next earthquake on a specific fault. Poisson distribution is applied for seismicty studies (for example, Cornell 1968; Caputo 1974; Shah 1975; Bath 1978; Cluff at al. 1980). A number candidate statistical distributions have been proposed for
Exponential (Utsu, 1972b), Gaussian (Rikitake, 1974), Weibull (Hagiwara, 1974; Rikitake, 1974), Log-normal (Nishenko and Buland, 1987) and Gamma (Utsu, 1984), Pareto (Sergio G. Ferráes, 2003) distributions. The difficulty lies in determining the correct distribution, given data of large seismic event on a given faults. Nishenko and Buland (1987) obtained a reasonably good fit to a log-normal distribution. Mc Nolly and Minster (1981) have argued that a Weibull distribution is more appropriate. [ Workshop on Earthquake Recurrence, 1999]. In this study, in order to find the probability distribution best represents the data set, we have compared Weibull, Log-normal, Log-logistic, Exponential and Gamma distributions through Kolmogorov-Smirnov test.
NAFZ (North Anatolian Fault Zone) were selected as an area of investigation. In this paper, the earthquake data which were occurred in the area coordinated 39.00o –
42.00o North latitudes and 30.000-40.000 East longitudes between 1900-2000 years
and whose magnitudes equal 5 or higher were used (http://www.koeri.boun.edu.tr -Bo aziçi Univ. Kandilli Observatory and Earthquake Research Institute). The last earthquake occurred on the NAFZ is zmit Eartquake of 19 August 1999. Kocaeli earthquake occurred at 00:01:39 UTC (3:01 a.m. local time), and was centered at 40.74 N., 29.86 E., which places the epicenter about 11 kilometers, or seven miles, South East of the city of Izmit. On August 17, 1999, the Mw=7.4 Kocaeli earthquake struck a densely populated region in North Western Turkey, which is also the industrial heartland of the country. This location indicates that the earthquake occurred on the Northernmost strand of the North Anatolian fault system. The earthquake originated at a depth of 17 kilometers, or about 10.5 miles, and caused right-lateral strike-slip movement on the fault. Since the earthquake occurred 3.00 a.m., when most of the people were indoors, the result was a tragedy, causing 17255 dead, 23781 injured, 626 damaged schools, 47 damaged health facilities, 283240 damaged private homes and 41164 damaged working buildings according to formal statistics. In fact, it is estimated that the mortality is, unfortunately, even higher than this figure. Therefore, prediction of the next large earthquake under the NAFZ would be useful. Such a prediction must be rely on the observation of phenomena that relate to large earthquake.
2. Proper Distribution Selection to Determine Earthquake Risk
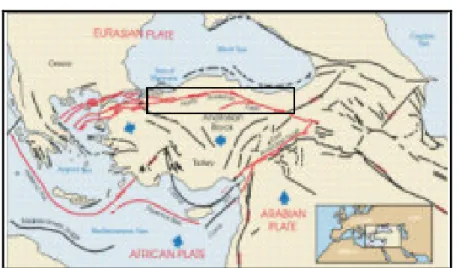
In the usual studies for determining earthquake risk generally year is used as time unit and classified frequency distribution is used as frequency distribution. In this study day is preferred as time unit and series is preferred as frequency distribution. In this way increase of this study’s sensitivity is satisfied (Çelik and Yılmaz, 2002). Fig.1 shows the area of investigation (NAFZ), Fig.2 shows, NAFZ’s 39.00o – 42.00o
Fig.1 The Area of Investigation (NAFZ) [http://neic.usg.gov/neis/world/turkey].
Fig.2.The earthquakes occurred in 39.00o - 42.00o North latitude and 30.00o
-40.00o East longitude. (http://neic.usg.gov)
In order to determine proper distribution for the earthquake data set, Kolmogorov-Smirnov test statistics have been calculated and the results are given in Table 1.
Table 1 Kolmogorov-Smirnov Calculation Values
Distribution Calculated D Exponential 0.187174 Gamma 0.102502 Log-normal 0.091767 Log-lojistik 0.087780 Weibull 0.065040
Kolmogorov-Smirnov test D Critical table value, the only sampling to compare calculated test statistics, is approximately calculated at 0.05 significance level as given below.
n
D
n;0.05=
1
.
36
,n
>
35
(1)The critical table value is determined 0.1395 for n=95 and α=0.05 significance level when test statistics are compared with table value it is concluded that in α=0.05 significance level the earthquake data does not fit to exponential distribution among advised distributions. When the calculated test statistics are evaluated it can be said that Weibull distribution should present the earthquake data well. It can be usually seen from P-P plot given Figure 3.
Fig. 3. Plot of probability functions of advised distributions
3. To Determine Earthquake Risk
In modeling earthquake data the most appropriate distribution was established as Weibull Distribution. According to this; when the T random variable is defined as the time (day) elapsed between two earthquakes occurred successively on 39.00o-
42.00o North latitude and 30.00o - 40.00o East longitudes of NAFZ, the probability
density function of T random variable is:(Yılmaz and Eri o lu, 2003).
. ) exp( ) , ; (t α β βα βtβ 1 α βtβ f = − − − − 0<t<∞,α >0,β >0 (2) We have the following expressions for cumulative distribution and the reliability function: ) ) t ( exp( 1 ) t ( F β α − − = (3) ) ) ( exp( ) ( β α t t R = − (4) P-P Plot 0 0,2 0,4 0,6 0,8 1 0 0,1 0,2 0,3 0,4 0,5 0,6 0,7 0,8 0,9 1 Observed Cum. Prob.
E xp ec te d C um . P ro b.
The kth order moment of the two parameter Weibull law can be expressed as = Γ = k i i i k t E 1 ) ( α (5) Where dt e t i x i i ∞ − = + Γ = Γ 0 ) 1 ( β β ,
is the well-known gamma function. Then the mean, ) 1 1 ( ) ( = Γ + β α t E (6)
Parameter estimation values and mean occurrence period found by using MLE (Maximum Likelihood Estimation) technique are given in Table-2. By placing the parameter estimation values given in Table 2,
Table 2 Parameter estimation values and mean occurrence period found by using MLE. βˆ αˆ E(t) 0.656625 281.1 379.8027 ) 6566 , 0 6566 , 0 1 , 281 exp( 1 6566 , 0 ) 6566 , 0 1 , 281 )( 6566 , 0 ( ) , ; (t t t f
α
β
= − − − − (7)and earthquake data are well modeled by Weibull distribution (equation 7). The mean occurrence period of earthquakes between 39.00o–42.00o North latitudes and
30.000-40.000 East longitudes which have magnitudes equal to or above 5 is
calculated approximately 380 days. So it is expected to have another earthquake having magnitude equal to 5 or above between 39.00o–42.00o North latitudes 30.000
-40.000 East longitudes are average 380 days later than the preceding one.
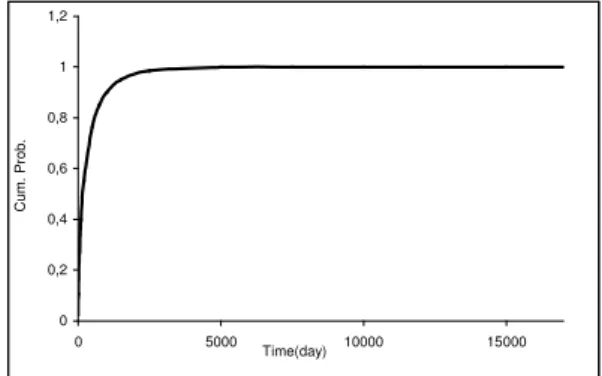
Cumulative distribution function graph that shows occurrence risk of an earthquake having magnitude equal to 5 or above in t day(s) after an earthquake occurred between 39.00o–42.00o North latitudes and 30.00o-40.00o East longitudes with
magnitudes equal to or above 5 is given in Figure-4
Fig.4. The graph of cumulative distribution function F(t)
0 0,2 0,4 0,6 0,8 1 1,2 0 5000 Time(day) 10000 15000 C um . P ro b.
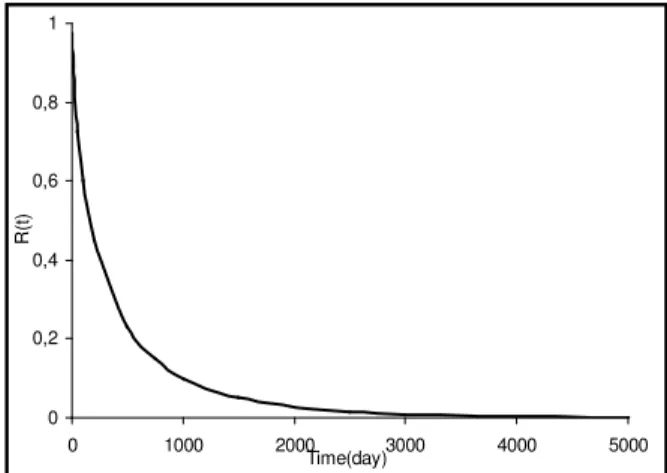
in the investigation area after the preceding one with the same magnitude is 77%. The graph of reliability function that gives the probability of having another earthquake with magnitude 5 or above in t days after the preceding one with the same magnitude between 39.00o–42.00o North latitudes and 30.000-40.000 East
longitudes is given in Figure 5.
Fig.5. The graph of reliability function R(t)
In this section of the study, NAFZ has been divided into three areas in terms of different features such as the number of the earthquakes and magnitudes (Fig.2). Risk evaluation has been performed for the three areas individually. By dividing the investigation area, which locates between 39.00o- 42.00o North latitude and 30.00o
-40.00o East longitudes of NAFZ, into three as West (I), Middle (II) and East (III),
risk-rating can be made in the investigation area. According to this, let the area 30.00o-33.00o in the East longitude be named as Western investigation area, the
region between 33.00o-37.00o in the East longitude be named as Middle
investigation area, and the area between 37.00o-42.00o in the Eastern longitude be
named as East investigation area. MLE has been used in estimating the Weibull Distribution parameters in the investigation areas. The estimation values of the Weibull Distribution parameters and mean occurrence period the for the three investigation areas are given in Table 3.
Table 3. The estimation values of the Weibull Distribution parameters and mean occurrence period the for the three investigation areas.
West Middle East
β
ˆ
0.48 0.636 0.62α
ˆ
502.976 551.812 1215.55)
t
(
E
1087.835 772.7963 1754.771For the examined three investigation area when mean occurrence periods are evaluated. It can be seen that the Middle investigation area has mean occurrence period less than others. For having risk classification of three investigation areas
0 0,2 0,4 0,6 0,8 1 0 1000 2000 3000 4000 5000 Time(day) R (t)
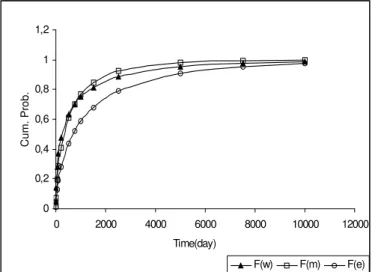
cumulative distribution function graphs are evaluated in the same axis and are shown in Figure 6.
Fig. 6. Evaluation of three cumulative distribution functions on the same axis
4. Conclusion
As a result of this study for determining earthquake risk:
• Weibull distribution is determined as the most appropriate distribution for our data set.
• After an earthquake with magnitude 5 or above, while the West investigation area is the most risky area in the first 750 days. After 750 days Middle investigation area has been detected most risk bearing area.
• East investigation area is less risky relative to West and Middle investigation areas.
• Risks of another earthquake occurrence after the preceding one in a year in West, Middle and East investigation areas are respectively 58%, 54% and 38%.
• Risks of another earthquake occurrence after the preceding one in 5 years in West, Middle and East investigation areas are respectively 84%, 88% and 72%.
• Risk of another earthquake after the preceding one having magnitude 5 or above in investigation area in 100 days is 69% determined as and it is concluded that the region’s earthquake risk is too high.
• In risk grading of inside of each part it is concluded that the East investigation area has the least risk.
References
BATH, M.(1979) Seismic risk in Fennoscandia, Tectonophysics., 57, pp.285-295. CORNELL, CA.(1968) Engineering Seismic Risk Analysis, Bull. Seism.. Soc. Am,
58, pp. 1583-1606. 0 0,2 0,4 0,6 0,8 1 1,2 0 2000 4000 6000 8000 10000 12000 Time(day) C um . P ro b. F(w) F(m) F(e)
Yardımıyla Eski ehir linin Deprem Riskinin Saptanması, statistik Günleri
2002 Sempozyumu, Hacettepe Üniversitesi Fen Fakültesi statistik Bölümü, 57,
Ankara .
CAPUTO, M.(1974) Analysis of seismic risk. Engineering Seismology and Earthquake Engineering: NATO Advanced Study Institutes Series, Series E:
Applied Sciences, 3, pp. 55-86
CLUFF, LS., PATWARDHAM AS. & COPPER-SMITH K. (1980) Estimating the Probability of Occurrence of Surface Faulting Earthquakes on the Wasatch Fault Zone Utah. Bull. Seismol. Soc. Am, 70, pp. 463-478.
HAGIWARA, Y.(1974) Probability of earthquake occurrence as obtained from a Weibull distribution analysis of crustal strain., Tectonophysics ,23, pp. 323-318. MCNALLY, KC. & MINSTER, CB. (1981) Non Uni-Form Seismic Slip Rates
Along The Middle American trench. J. Geophys. Res, 86, pp. 4949-4959. NISHENKO, S. P. & BULAND, R.. A.(1987) Generic recurrence interval
distribution for earthquake forecasting, Bull. Seism. Soc. Am , 77, pp. 1382-1399.
RIKITAKE, T.( 1974) Probability of an earthquake occurrence as estimated from crustal strain, Tectonophysics, 23:, pp. 299-312.
SHAH, HC. & MOVASSATE, M.(1975) Seismic risk analysis of California State water project: Proc. of the 5 th European Conf. on Earthquake Engineering. 10/156, Istanbul.
SERGIO, GF. (2003) Probabilistic prediction of the next large earthquake in the Michoacán fault-segment of the Mexican subduction zone. Institute of Geophysics (UNAM), Ciudad Universitaria, Mexico City, Mexico Geofísica Internacional, 42(1),pp. 69-81.
UTSU, T.(1972a) Large earthquakes near Hokkaido and the expectancy of the occurrence of a large earthquake of Nemuro:.Report of the Coordinating Committee for Earthquake Prediction, 7,pp. 7-13.
UTSU, T. .(1972b) Aftershocks and earthquake statistics (IV). Journal of the Faculty of Science, Hokkaido University Series VII Geophysic, 4, pp. 1-42. UTSU, T.(1984) Estimation of parameters for recurrence models of earthquakes.
Bulletin of the Earthquake Research Institute, University of Tokyo ,59, pp. 53-66.
YILMAZ, V. ve ER O LU, M.(2003), statistiksel Parametre Kestirim Tekniklerinin Weibull Da ılımının Parametrelerinin Hesaplanmasında Kullanımı ve Deprem Verilerinin Weibull Da ılımına Uygulanması, statistik Ara tırma
Dergisi , cilt: 2, no:2.
Workshop On Earthquake Recurrence: State Of The Art And Dırectıons For The Future ,Istituto Nazionale De Geofisica, (1999), Rome, Italy, 22-25.