KADIR HAS UNIVERSITY
GRADUATE SCHOOL OF SCIENCE AND ENGINEERING
LOOP MODELING AND MOLECULAR DYNAMICS SIMULATIONS
OF APO AND LIGAND-BOUND HUMAN GLUN1-GLUN2A
NMDA TYPE RECEPTORS
MUHAMMED AKTOLUN
LOOP MODELING AND MOLECULAR DYNAMICS SIMULATIONS OF
APO AND LIGAND-BOUND HUMAN GLUN1-GLUN2A
NMDA TYPE RECEPTORS
MUHAMMED AKTOLUN
Submitted to the Graduate School of Science and Engineering in partial fulfillment of the requirements for the degree of
Master of Science in
Computational Biology and Bioinformatics
KADIR HAS UNIVERSITY
“I, Muhammed AKTOLUN, hereby declare that this master’s thesis is my own original work and that due references have been appropriately provided on all supporting literature and resources.”
___________________________________________________________________
MUHAMMED AKTOLUN Istanbul, 2017
ABSTRACT
N-Methyl-D-Aspartate receptors (NMDARs) are glutamate-gated ion channels found in the nerve cell membranes. The functioning of the receptor is of crucial importance in consciousness and normal brain functions. As a result of overexcitation of NMDARs, neuronal death occurs and may lead to diseases such as epilepsy, stroke, Alzheimer's and Parkinson's. Understanding the molecular mechanism and structure function relationships of the receptor might lead to discovery of new drug target mechanisms.
Recently, there are two intact X-ray structures available, one is from Xenopus laevis and the other one is from Rattus norvegicus, for GluN1-GluN2B type NMDA receptor. First, both X-ray structures are examined and compared, for the ion channel especially, by taking the general problems into consideration which arise from crystallization conditions. Human GluN1-GluN2A type NMDAR structure is modeled based on the structure of Xenopus laevis template and missing loops are added by ab-initio loop modeling. Final structure is chosen according to the model assessment scoring function. NMDAR activation requires binding of two co-agonists, glycine and glutamate. To be able to observe the structural changes upon ligand binding, glycine and glutamate molecules are docked into the corresponding binding sites of the receptor. Subsequently, Molecular Dynamics (MD) simulations of 1 microsecond are performed for both apo and ligand-bound structures. 10 structural parameters, which have been considered as functionally important in previous NMDA studies, are developed to understand the dynamics of the conformational changes that is associated with the function of the protein throughout the simulations. Moreover, Principal Component Analysis is performed for the equilibrated part of the simulations to classify similar conformations together.
In the ligand-bound simulation, certain loop regions showed higher mobility. Upon ligand binding, closure in LBD clamshell, smaller ATD-LBD inter-domain distance and larger LBD-TMD linker distance is observed in specific subunits. Opening in the bottom LBD-TMD girdle is observed for a short time. Correlated motions of the receptor in the ligand-bound simulation increased. The structure showed rotation-like motion in the apo simulation whereas sliding-like motion within the neighboring heterodimers are observed.
ÖZET
N-Metil-D-Aspartat (NMDA) reseptörleri sinir hücrelerinin zarında bulunan glutamat-kapılı iyon kanallarıdır. Reseptörün fonksiyon göstermesi, bilinçlilik ve normal beyin işlevlerinde büyük öneme sahiptir. NMDA reseptörlerinin aşırı uyarılması sonucu, nöronal hücre ölümü oluşur ve bunun sonucunda epilepsi, inme, Alzheimer ve Parkinson gibi hastalıklar ortaya çıkar. Reseptörün moleküler mekanizmasını ve yapı-fonksiyonu ilişkilerini anlamak, yeni ilaç geliştirme mekanizmalarının keşfedilmesini sağlayacaktır.
Yakın zamanda, GluN1-GluN2B reseptörü için iki yeni bütün X-ışını yapısı, biri Xenopus laevis’ten, diğeri Rattus norvegicus’tan olmak üzere, elde edilmiştir. İki yapı zar proteinlerinin yapılarını kristalize ederken ortaya çıkan genel problemler göz önüne alınarak analiz edilmiş ve karşılaştırılmıştır. İnsan GluN1-GluN2A tipi NMDAR yapısı, Xenopus laevis şablon yapısına dayalı olarak modellenmiştir ve eksik döngüler ab-initio döngü modellemesi ile eklenmiştir. Son yapı, model değerlendirme ve puanlama fonksiyonuna göre seçilmiştir. NMDAR aktivasyonu için, glisin ve glutamat olmak üzere iki agonistin aynı anda yapıya bağlanması gereklidir. Ligand bağlandığında yapısal değişiklikleri gözlemleyebilmek için, glisin ve glutamat molekülleri reseptörün ilgili bağlama bölgelerine “dock” edilmiştir. Sonra hem apo hem de ligand bağlı yapılar için 1 mikrosaniyelik Moleküler Dinamik (MD) simülasyonları uygulanmıştır. Önceki NMDA çalışmalarında fonksiyonel olarak önemli olduğu tespit edilen 10 yapısal parametre, simülasyonlar boyunca yapısal değişikliklerin dinamiklerini anlamak için incelenmiştir. Ayrıca, benzer hareketleri birlikte sınıflandırmak amacıyla simülasyonların dengelenmiş kısmı için “Principal Component Analysis” gerçekleştirilmiştir.
Ligand bağlı simülasyonda, bazı döngü bölgeleri daha yüksek mobilite göstermiştir. Ligand bağlandığında, belli zincirlerde, LBD deniz kabuğunda kapanma, daha küçük ATD-LBD mesafesi ve daha büyük LBD-TMD “linker” mesafesi gözlemlenmiştir. Alttaki TMD girdle’ın açılması kısa bir süre için gözlemlenmiştir. Reseptörün korelasyonlu hareketleri ligand bağlı simülasyonda artmıştır. Yapı, apo simülasyonunda rotasyon benzeri bir hareket gösterirken yan yana duran heterodimerler arasında kayma benzeri hareket gözlemlenmiştir.
ACKNOWLEDGEMENTS
Foremost, I would like to express my sincere gratitude to my thesis advisor Assist. Prof. Dr. Şebnem Eşsiz for the continuous support of my master’s study and research, for her patience, motivation, enthusiasm, and immense knowledge. Her guidance helped me in all the time of research and writing of this thesis.
Besides my advisor, I would like to express my appreciations to the rest of my thesis committee: Prof. Dr. Mine Yurtsever and Asst. Prof. Dr. Bahar Delibaş, for their encouragement and insightful comments.
My special thanks also go to my colleague Ayhan Demir at this project for his friendship and support, and for creating a cordial working environment.
TABLE OF CONTENTS
ABSTRACT IV
ÖZET V
ACKNOWLEDGEMENTS VI
TABLE OF CONTENTS VII
LIST OF FIGURES VIII
LIST OF TABLES IX
LIST OF SYMBOLS/ABBREVIATIONS X
1. CHAPTER 1: INTRODUCTION 1
1.1.ION CHANNELS 1
1.2.LIGAND-GATED ION CHANNELS 3
1.3.N-METHYL-D-ASPARTATE (NMDA)RECEPTORS 6
1.4.STRUCTURAL STUDIES OF GLUTAMATE RECEPTOR 8
2. CHAPTER 2: MATERIALS AND METHOD 11
2.1.LOOP MODELING 11
2.1.1.ROSETTAKINEMATIC CLOSURE (KIC) WITH FRAGMENTS 11
2.2.MOLECULAR DOCKING 12
2.3.MOLECULAR DYNAMICS 13
2.3.1.POTENTIAL ENERGY VELOCITY VERLET 15
2.4.MDSOFTWARE 17
2.5.MDTRAJECTORY ANALYSIS TOOLS 18
2.5.1.ROOT MEAN SQUARE DEVIATION (RMSD) 18 2.5.2.ROOT MEAN SQUARE FLUCTUATION (RMSF) 19
2.5.3.AREA PER LIPID (APL) 19
2.5.4.PRINCIPAL COMPONENT ANALYSIS (PCA) 19
2.6.MODELING AND SIMULATION SETUP 21
2.6.1.DOCKING 23
3. CHAPTER 3: RESULTS AND DISCUSSION 24
3.1.ANALYSIS OF TWO TEMPLATE STRUCTURES 24
3.2.LOOP MODELING 27
3.3.MOLECULAR DYNAMICS SIMULATIONS 32
3.3.1.EQUILIBRATION STEP 32
3.3.2.ANALYSIS OF THE EQUILIBRATED MDTRAJECTORY 37
3.4.PRINCIPAL COMPONENT ANALYSIS (PCA) 52
3.5.PCAFIRST MODE COMPARISON 57
4. CHAPTER 4: CONCLUSION 60
5. REFERENCES 62
LIST OF FIGURES
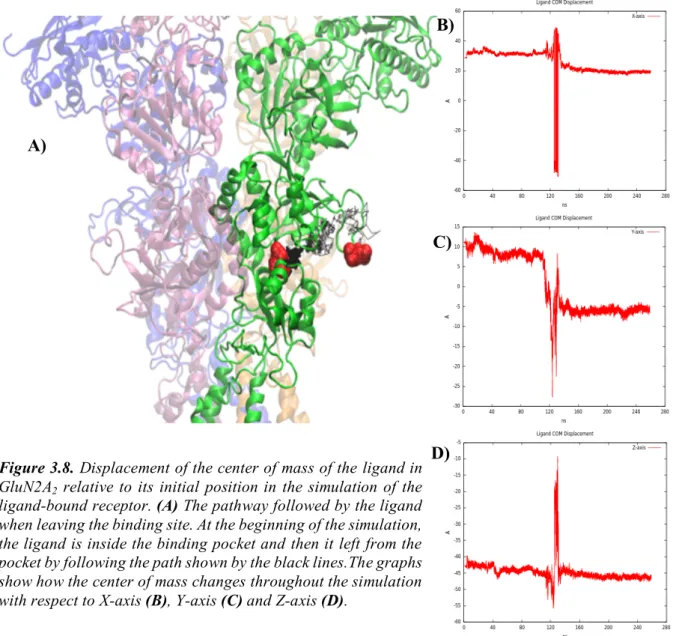
Figure 1.1. NMDAR Topology. ________________________________________________ 5 Figure 2.1. Operation steps of a typical molecular dynamics (MD) simulation. __________ 16 Figure 3.1. Structure of ion channel (TMD part). _________________________________ 25 Figure 3.2. Differences between the 4TLM and 4PE5 structures. _____________________ 26 Figure 3.3. Pore profiles of transmembrane parts of structures. ______________________ 27 Figure 3.4. Ramachandran plots of tetrameric model with loops and the template. _______ 28 Figure 3.5. Ramachandran plot of the structure modeled as tetramer without loops. _____ 29 Figure 3.6. Dimeric structure of NMDAR. _______________________________________ 30 Figure 3.7. Z-DOPE scores and first 20 of the best loop structures modeled. ___________ 31 Figure 3.8. Displacement of the center of mass. __________________________________ 33 Figure 3.9. Glutamate molecule in ligand binding domain. _________________________ 34 Figure 3.10. Ca RMSD plot of Apo and Ligand-bound simulations. ___________________ 35 Figure 3.11. Area per lipid graph and reaching to equilibrium of lipid bilayer. _________ 36 Figure 3.12. Structural parameters measured for the simulations. ____________________ 38 Figure 3.13. K216C mutation site and LBD Angle. ________________________________ 40 Figure 3.14. D1-D2 closure measured in ligand binding domain. ____________________ 42 Figure 3.15. Distance of the loop in LBD to ATD helix. ____________________________ 44 Figure 3.16. Distance between ATD and LBD center of masses. _____________________ 46 Figure 3.17. Linker connecting the LBD and TMD M3 helices. ______________________ 47 Figure 3.18. Root-mean-square fluctuations (RMSF) of GluN11. _____________________ 50
Figure 3.19. Root-mean-square fluctuations (RMSF) of GluN2A1. ____________________ 50
Figure 3.20. Root-mean-square fluctuations (RMSF) of GluN12. _____________________ 51
Figure 3.21. Root-mean-square fluctuations (RMSF) of GluN2A2. ____________________ 51
Figure 3.22. Correlation plots of the simulations for GluN11 and GluN2A1. ____________ 54
Figure 3.23. Correlation plots of the simulations for GluN12 and GluN2A2. ____________ 55
Figure 3.24. First modes of apo simulations from PCA. ____________________________ 57 Figure 3.25. First modes of ligand-bound simulation from PCA. _____________________ 58 Figure S1. Separate distances of ATD center of masses. ____________________________ 64 Figure S2. Separate distances of LBD cross residues. _____________________________ 64
LIST OF TABLES
Table 2.1. Protocols used in MD simulations. ____________________________________ 22 Table 3.1. Percentage contribution of the first 10 eigenvalues. _______________________ 53
LIST OF SYMBOLS/ABBREVIATIONS
3D 3-Dimensional
5-HT3 5-hydroxytryptamine3
Å Angstrom
ACPC 1-aminocyclopropane-1-carboxylic acid
ADT AutoDock Tools
ALA, A Alanine
AMPA a-amino-3-hydroxyl-5-methyl-4-isoxazole-propionate
AMPAR a-amino-3-hydroxyl-5-methyl-4-isoxazole-propionate receptor
APL Area per lipid headgroup
ARG, R Arginine
ASN, N Asparagine
ASP, D Aspartic acid
ATD Amino Terminal Domain
C Carbon
Cα Carbon alpha
CNS Central Nervous System
CTD Carboxy Terminal Domain
CYS, C Cysteine
DOPE Discrete Optimized Protein Energy
fs Femtosecond
GABAA Gamma-aminobutyric acid type A
GLU, E Glutamate
GLY, G Glycine
H Hydrogen
HIS, H Histidine
iGluR Ionotropic Glutamate Receptor
ILE, I Isoleucine
K Kelvin
KIC Kinematic closure
LEU, L Leucine
LGA Lamarckian genetic algorithm
LGIC Ligand-gated ion channel
LYS, K Lysine
MD Molecular dynamics
mGluR Metabotropic Glutamate Receptor
MK-801 Dizocilpine
N Nitrogen
nAChR Nicotinic acetylcholine receptor
NMDA N-methyl-D-aspartate
NMDAR N-methyl-D-aspartate receptor
NMR Nuclear Magnetic Resonance
ns Nanosecond
O Oxygen
PCA Principal component analysis
PCP Phencyclidine
PDB Protein Data Bank
pLGIC Pentameric ligand-gated ion channels POPC Palmitoyl-oleoyl phosphatidylcholine
ps Picosecond
RMSD Root mean square deviation
RMSF Root mean square fluctuation
t-ACBD Trans-1-aminocyclobutane-1,3-dicarboxylic acid
THR, T Threonine
TMD Transmembrane Domain
VAL, V Valine
vdW van der Waals
z-DOPE Normalized Discrete Optimized Protein Energy
φ Phi
Ψ Psi
1. CHAPTER 1: INTRODUCTION
1.1. Ion Channels
Neurodegenerative diseases which occur in the central nervous system (CNS) are related with ion channels, since they play a fundamental role in neurotransmission of ions through the cell membrane. Ion channels are protein complexes which are embedded in the cell membrane and their function is to regulate the diffusion of ions across the membrane. Malfunction in the regulation mechanism of ion channels can cause common diseases such as Alzheimer’s, Parkinson’s, Huntington’s, epilepsy and schizophrenia (Dworakowska & Dołowy, 2000). According to the World Alzheimer Report 2016, the number of people who live with dementia was 46.8 million in 2015 and it is expected to increase to 131.5 million in 2050 (World Alzheimer Report, 2016). Therefore, a better understanding of the relationship between the structure and the working mechanism of the ion channels could provide valuable information in order to design novel drugs and to find new treatment methods.
The cell membrane is a biological membrane that consists of phospholipid bilayer and separates interior of the cell from the outside environment. It has a vital importance for the living cells as it controls and maintains the internal composition of the cell. It is selectively permeable to some molecules where only small uncharged molecules can pass freely through the lipid bilayer while large uncharged polar molecules such as glucose and some amino acids cannot. Charged molecules such as potassium (K+), calcium (Ca2+), sodium (Na+) and chloride (Cl-) ions are also unable to pass through the lipid bilayer regardless of their sizes.
Differences in the concentrations of ions on the opposite sides of a cellular membrane causes a voltage called the membrane potential. Cell membranes maintain a small voltage or "potential" through the membrane in its normal or resting state. In the rest state, the inside of the nerve cell membrane is negative with respect to the extracellular environment. The voltage results from differences in concentration of the electrolyte ions K+ and Na+. For the nerve cell, this equilibrium is disturbed by the arrival of a suitable stimulus. The dynamic changes in the membrane potential in response to the stimulus is called an action potential. The action potential plays an important role in the communication between nerve cells. After the action
potential, the cell membrane comes back to its resting state by making the intracellular side relatively negative with respect to extracellular side of the membrane.
The lipid bilayer has ion channels on it in order to allow ions to flow across the membrane. An external physical or chemical perturbation determines if the channel is open so that ions can pass through, or if it is closed which prevents the ion flow (Bernard & Shevell, 2008). Transition of the channel between these states is called ‘gating’. By the gating mechanism, ion channels regulate the formation of resting and action potentials mentioned above.
Ion channels are fundamental for the normal cellular functioning of the nervous system with three important features including very rapid response to ion flow, to electrical, chemical and mechanical stimuli and selective ion permeation (Hille, 2001).
Ion channels are classified in 5 different subclasses according to how their gating mechanisms work (Keiser & Utzinger, 2010):
• voltage-gated • ligand-gated
• seconder messenger gated • mechanosensitive
• gap junctions
Voltage-gated ion channels are the type of transmembrane proteins that is opened when the membrane potential exceeds a threshold value. There are several classes regarding the ion type that pass through the channel, such as Na+, K+, Ca2+ and Cl-. When a potential difference exists over the membrane, it triggers the conformational changes in the channel. The conformational change distorts the shape of the channel in such a way that the channel opens to allow ion flow across the membrane. This gating is a result of certain mechanisms related to the structure in the protein. For instance, sodium and calcium channels have voltage sensing helices. These helices are positively charged due to their amino acid sequence. A high positive charge outside the membrane repels these helices keeping the channel in its closed state, or vice versa. The migration of ions balances their concentration in both sides of the membrane which produces an electric current to depolarize the cell membrane (Hille, 2001).
Second messenger-gated channels are only found in eukaryotes and they are activated by light-sensitive compounds such as odors and pheromones (Oldham & Hamm, 2008; McCudden et al., 2005). The mechanosensitive channels are found in all cell types and opened by mechanical stimuli such as touch, cardiovascular regulation and sensing of gravity (Ghazi, 1998). Gap junctions are intracellular channels and they allow diffusions of ions directly cell to cell (Goodenough & Paul, 2009).
Ligand-gated ion channels (LGICs) are opened upon ligand binding. LGICs produce rapid synaptic potentials which inhibits or excite the neuron. This channel family will be discussed further in the following section.
1.2. Ligand-Gated Ion Channels
LGICs are a class of membrane proteins whose functional state is modulated by the binding of a ligand. Upon binding of their ligand, conformational changes take place that open the ion pore and allow the passage of ions. In addition to open and closed conformational states, LGICs can be found in desensitized state where the receptor is unresponsive upon prolonged exposure to its neurotransmitter. This causes the channel to remain closed upon ligand binding to the receptor (Keramidas & Lynch, 2013).
Examples of LGICs are the nicotinic acetylcholine receptor (nAChR), glycine receptor, gamma-aminobutyric acid type A (GABAA) receptor, the 5-hydroxytryptamine3 (5-HT3) serotonin receptor, a-amino-3-hydroxyl-5-methyl-4-isoxazole-propionate (AMPA) receptor, kainate receptor and N-methyl-D-aspartate (NMDA) receptor (Barry & Lynch, 2005). First four receptors are also known as "Cys-loop" receptors due to a pair of conserved cysteines in one of the ligand binding domain loops. AMPA, kainate and NMDA receptors are also known as ionotropic glutamate receptors.
These proteins contain at least two different domains, the first one is a transmembrane domain (TMD) which forms the channel, and the second is an extracellular domain that includes the ligand binding domain (LBD). Ligand-gated ion channels convert chemical signals which come with neurotransmitter released from presynaptic neuron to the electrical signals for the
postsynaptic neuron. LGICs are modulated by allosteric ligands, by channel blockers, or by ions (Barry & Lynch, 2005).
Glutamate receptors are protein complexes that contribute to memory and learning functions, and play a crucial role in synaptic conduction and in the formation of neuronal connections during the development of the nervous system (Traynelis et al., 2010). Glutamate receptors are found in the postsynaptic neuron and divided into two categories such as metabotropic glutamate receptors (mGluRs) and ionotropic glutamate receptors (iGluRs).
mGluRs are G-protein-dependent receptors that participate in the modulation of synaptic transmission and neuronal excitability throughout the central nervous system. The mGluRs bind glutamate within a large extracellular domain and transmit signals through the receptor to intracellular signaling partners.
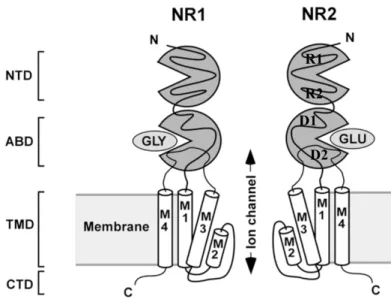
iGluRs are tetrameric ligand-gated ion channels that are activated by the neurotransmitter glutamate (Traynelis et al., 2010). Structurally, iGluRs consist of one or more subunit subtypes forming a pore in the membrane. Each subunit is comprised of several components that act in a semi-modular fashion: an extracellular amino-terminal domain (ATD), an extracellular ligand binding domain (LBD), a transmembrane domain (TMD), and an intracellular carboxy-terminal domain (CTD) (Laube et al., 1998; Rosenmund et al., 1998). The extracellular amino-terminal sequence of each iGluR subunit forms the clamshell-shaped ATD, composed of upper (R1) and lower (R2) lobes (Fig. 1.1). The ATD is followed by a sequence (S1) that forms much of the upper lobe (D1) of the similarly clamshell-shaped LBD. S1 links to the first (M1) of three transmembrane helices (M1, M3 and M4). A short intracellular linker connects M1 to M2 and a pore-lining reentrant loop (M2/p-loop), which forms the selectivity filter toward the intracellular aspect of the channel. Another short linker connects the M2/p-loop segment to M3 helix. The longer sequence (S2) that connects M3 to M4 comprises most of the lower lobe of the LBD (D2). The CTD, likely to be in an extended conformation, is formed by residues C-terminal to M4 (Ryan et al., 2008).
There are three different members of the iGluR family including AMPA receptors, kainate receptors and NMDA receptors. They are named according to the agonists which activate them.
AMPA receptors (AMPARs) are heterotetrameric receptors that belong to the iGluR family. These receptors are primarily responsible for the rapid excitatory glutamatergic neurotransmission. In nature, the majority of AMPA receptors are heterotetrameric and made up of symmetric dimer of dimers of GluR1, GluR2, GluR3 and GluR4 subtype combinations (Mayer, 2005; Greger et al., 2007). There are four binding sites in AMPA receptors. Each binding site or subunit can bind exactly one agonist (Mayer, 2005). The active site is presumed to be uniquely formed by the amino-terminal and the extracellular loop which is between the transmembrane helices M3 and M4 (Sukumaran et al., 2011). In the case where the agonist binds, the pore opens after some of the two loops move towards one another. The channel opens only if the two binding sites are occupied thus, increasing its currents giving rise to more binding sites to be occupied (Platt, 2007; Rosenmund et al., 1998). When a channel opens, it may be subjected to a rapid desensitization state resulting the current to stop or reach a instantaneous state. The so-called desensitization mechanism is assumed to arise from a little
Figure 1.1. NMDAR Topology. Cartoon diagram depicts a NMDAR with
front and back subunits removed for clarity. Each NMDAR subunit contains an extracellular N-terminal domain (ATD), a ligand binding domain (LBD) and a transmembrane domain (TMD) with the helices M1, M2, M3 and M4 and an intracellular C-terminal domain. The ATD and LBD domains are clamshell-shaped with upper lobes termed R1 and D1, respectively, and lower lobes termed R2 and D2, respectively. Reprinted from “Mechanistic Basis of NMDA Receptor Channel Property Variation” by B. S. Retchless, 2011, University of Pittsburgh.
D1 D2 R1 R2
change in the angle of the regions of the binding site that lead to closing the channel pore (Armstrong et al., 2006; Sukumaran et al., 2011).
One of the two non-NMDA ionotropic glutamate receptors are kainate receptors functioning in the CNS. They are named according to their activator ligands, kainate. They are originally identified by their preferential response to kainate, namely a rapid desensitization in its presence that distinguished them from the other class of non-NMDA iGluRs; AMPA receptors (Davies & Watkins, 1979; Bettler & Mulle, 1995). Kainate receptors have five subunits including GluR5, GluR6, GluR7, Ka1 and Ka2 that are similar to AMPA and NMDA receptor subunits and can be arranged in different ways to form a tetramer (Hollmann & Heinemann, 1994). It is possible that GluR5-GluR7 are formed in homomeric or heteromeric arrangement, however Ka1 and Ka2 subunits are only combined with one of GluR5-GluR7 subunits (Traynelis et al., 2010; Sukumaran et al., 2011).
1.3. N-Methyl-D-Aspartate (NMDA) Receptors
NMDA receptors (NMDARs) are heterotetrameric members of iGluRs located in the membrane of the nerve cells and assembled from a pool of three different gene families: GluN1, GluN2 and GluN3 (Dingledine et al., 1999). The most common subtype combination that exist in human brain is GluN1-GluN2A. NMDA receptors include at least one GluN1 subunit and two or more GluN2 or GluN3 subunits (Ozawa et al., 1998). The GluN1 subunit is essential in all functional NMDARs. It possesses the binding site for regulatory glycine and D-serine and is necessary in the formation of tetrameric NMDAR channels (Kuryatov et al., 1994; McIlhinney et al., 2003). The four GluN2 subunits (GluN2A-D) possess the binding sites for the neurotransmitter glutamate (Anson et al., 2000). GluN3 subunits also contains a binding site for regulatory glycine and D-serine and exist in two different isoforms such as GluN3A-B (Yao & Mayer, 2006). Some important functional properties such as kinetics, open channel conductance and voltage dependence can be influenced by receptor composition with respect to these isoforms (Gillesen et al., 2002).
NMDARs characteristically bind the agonist glycine in LBD of GluN1 subunits and glutamate in LBD of GluN2 subunit. When glutamate and glycine binds to their corresponding binding
sites, lower lobe (D2) of the LBD clamshell comes close to the upper lobe (D1) and packs the ligand in the binding site. This closure motion pulls the pore-forming M3 helices in TMD up of the membrane which leads to the activation of the channel allowing the passage of small cations including Na+, K+ and Ca2+. Influx of ions through these channels generates neuronal action potentials (Schneggenburger et al., 1993; Lee et al., 2014; Zheng et al., 2017).
There are several distinguishing properties of neuronal NMDARs that make them unique when compared to other ionotropic receptors: 1) in addition to the natural agonist glutamate, they require an additional co-agonist, either glycine or D-serine, to function and 2) they are normally blocked by Mg2+ ions located within the channel pore. Membrane depolarization occurs in order to repel Mg2+ from the channel pore (Zhu et al., 2013). Other substances which are known to interact with NMDARs and modulate their activity include zinc cations, protons, polyamines such as dizocilpine (MK-801) and the psychotropic drug phencyclidine (PCP) (Ransom & Stec, 1988).
The binding sites of NMDA receptors are of great pharmacological importance. NMDA receptors have 7 different binding sites (Kandel et al., 2014; Kayaalp, 2009).
• Agonist recognition regions; NMDAR reacts with glutamate and other agonists. It enables the opening of the ion channel in the receptor to allow the normal exciter effect to occur (Kandel et al., 2014).
• Glycine binding region; Glycine, normally acting as an inhibitor neurotransmitter, facilitates the activation of NMDA receptors; Physiologically, is called a co-agonist of glutamate (Kandel et al., 2014)
• The polyamine binding site; The natural polyamines, spermidine and spermine, increase glutamate activity as the glycine does (Kandel et al., 2014).
• Zinc binding site; The Zn2+ ion binds to its own specific binding site on the NMDA
receptor, reducing the glycine effect (Kayaalp, 2009). A voltage-dependent blockade is associated with the binding of Zn2+ ion to this region. This region has an inhibitory
effect.
• Antagonist binding site; Phencyclidine, ketamine, dizocilpine and benzomorphan derivatives are the sites to which the substances bind. When antagonists bind this region, channel is closed to flow ions. (Kandel et al., 2014). This region is suitable for binding antagonists which will prevent excitotoxicity.
• Cation binding site; This region is located in the channel, where Mg2+ binds and blocks
the ion current through the membrane. The effect of Mg2+ is voltage dependent. In order
for the cation channel to be able to get rid of the inhibitor effect of Mg2+, the membrane voltage needs to be raised to a sufficient degree (Kayaalp, 2009).
• Allosteric modulation site REZ
1.4. Structural Studies of Glutamate Receptor
The main obstacle to understanding the gating mechanism of NMDAR is that the active, glutamate bound and intact receptor structure open to ion transport has not been experimentally resolved yet (Schmid & Hollmann, 2008).
There are studies that focused on the topics which are based on molecular dynamics such as the ligand selectivity for the LBD part (Lau & Roux, 2011), the semi-active agonist activity (Postila et al., 2011) and the closure of the two LBD shells triggered by the agonist (Dravid et al., 2010; Frydenvang et al., 2009). In addition to these studies, it has been also found that certain amino acids actively coordinated to close LBD clamshell upon glutamate binding to GluR2 LBD. In this study, 256 simulations of 2 ns MD are run, and it is observed that the binding of the glutamate molecule on six of them led to the closure of two halves of LBD onto ligand molecules (Okada et al., 2012). Furthermore, as a result of examining the results obtained by the two different MD simulations in terms of dominant protein motions, it is found that, in contrast to the AMPA receptors, the partial agonists are as effective as full-agonist molecules in the closure of the clamshell. Differences between the agonist and partial agonists are observed only in the part playing the hinge role in the closure of two flaps.
In another simulation study, it has been observed that, in addition to the glutamate molecule, water molecules in LBD play an important role in conformational changes caused by ligand binding, and that water molecules can regulate themselves in the nanosecond time interval (Sahai & Biggin, 2011; Vijayan et al., 2010).
Moreover, in the molecular dynamics simulations of the isolated ATD, the clamshell-like motion of LBD and the twisting motions of two lobes in ATD rotating against each other are observed as dominant global protein movements (Dutta et al., 2012; Zhu et al., 2013). These
studies have identified that the ATD of the NMDA receptors plays a role in ion channel activation as the main difference between AMPA and NMDA receptors.
The iGluR family exists as heterotetramer structures in the nature. This heterotetramer structure consists of two dimers of dimers in all iGluR members including NMDAR. Until 2014, the only resolved X-ray structure was AMPAR-GluR2, which is homotetramer in nature. In 2014, two valuable X-ray structures have been crystallized. Both of those are the GluN1-GluN2B structure in the heterotetramer form. The first is resolved by Lee and his colleagues (Lee et al., 2014) at 3.7 Å, and published in Nature in July, while the second is resolved at 4 Å resolution by Karakas and Furukawa (Karakas & Furukawa, 2014). The first structure is crystalized from the Xenopus laevis with the allosteric inhibitor Ro25-6981 in ATD dimer interface and partial agonists 1-aminocyclopropane-1-carboxylic acid (ACPC) in GluN1 LBD and trans-1-aminocyclobutane-1,3-dicarboxylic acid (t-ACBD) in GluN2B LBD. The second structure is crystalized from the Rattus norvegicus with the allosteric inhibitor ifenprodil in ATD dimer interface and the agonists glycine in GluN1 LBD and glutamate in GluN2B LBD. Both structures are found in physiologically inactive states. These proteins revealed that the structures of NMDARs are topologically the same as that of AMPAR published in 2009.
When the AMPA receptor structure is compared with the newly resolved X-ray structures, it has been determined that the domains outside of the ion channel are much more compact in the NMDA receptor (Karakas & Furukawa, 2014; Lee et al., 2014).
Finally, in August 2014, a work has been published in Cell which inspects the 'desensitized' AMPA receptor, insensitive to the ligand molecule but closed to ion flow, by obtaining low-resolution images via cryo-electron microscopy method. Conformational changes between the apo state (in the absence of ligand) and the desensitized state of the structure suggested in this study involves very large rotational and twisted movements of the ATDs and LBDs on the ion channel (Dürr et al., 2014). In such a large conformational change, `global` motions in protein domains rather than local atomic motions appear.
In this thesis work, homology model of human GluN1-GluN2A NMDAR will be simulated with computational approaches. The available crystal structures contain a number of mutations to reduce flexibility and to improve X-ray diffraction quality such as disulfide cross-links between subunits and removal of some flexible regions in the receptor. Moreover, the
structures are crystallized in the presence of antagonists and allosteric inhibitors, and the ion channel is closed. Hence, the gating mechanism of the receptor remains still controversial.
The aim of the study is to investigate the dynamics of the apo receptor in the absence of ligand molecules, to observe the open and closed states of the ligand-bound receptor upon glycine and glutamate binding using molecular dynamics (MD) simulations and to compare the conformational differences or correlations take place in whole structure and domains including ATD, LBD and TMD in both simulations. In addition, binding regions of ligand molecules that regulate gating mechanism and also how allosteric changes at the receptor are transmitted through the ion channel in the cell membrane will be examined. Allosteric changes are the result of structural changes in a local area of the protein that alter function of the protein by spreading to the other regions. The consequences of such a study would provide information to find molecules that have a controlled effect on the function of this protein. So, this will directly assist in the design of new drug molecules to be used in the treatment of neuronal death-related diseases such as Alzheimer's and Parkinson's.
2. CHAPTER 2: MATERIALS AND METHOD
2.1. Loop Modeling
It is possible that the alignment between model and template sequences contains gaps either in the model sequence or in the template sequence. If gaps in the model, residues are omitted from the template, creating a hole in the model that must be closed. If gaps in the template, the continuous backbone is taken from the template, and missing residues are inserted. Both cases imply a conformational change of the backbone. These changes in loop conformation make predict the structure difficult. There are two main approaches to loop modeling:
Knowledge based: The loop which is inserted to the structure is searched on the database for known loops with endpoint that match the residues. The database, typically contains thousands of loops, includes loop coordinates, sequences, number of residues in loop, Cα-Cα distances and many more. When consistent loops are found, placement and positioning of these loops are done via using superposition algorithm. Then loop fits are evaluated using root mean square deviation (RMSD) or energy function.
Ab initio: If any loop is not found in database, an algorithm is used to create loops using randomly generated φ/Ψ angles. Then an energy function is used to determine the quality of a loop. This loop is minimized, using Monte Carlo (Simons et al., 1999) or molecular dynamics techniques (Fiser et al., 2000) to attain the best loop conformation.
2.1.1. ROSETTA Kinematic Closure (KIC) with Fragments
The Kinematic Closure (KIC) which is component of ROSETTA’s loop modeling package, is an algorithm to create closed loops. Kinematic Closure (KIC) with fragments is a significant method in structural biology since it is used for modeling loops such as missing loops in the crystal structure. KIC is also used to predict conformations of loops in homology modeling, predict conformational changes upon protein-protein interactions. Two main protocols of the algorithm are;
• Loop reconstruction: Ab-initio prediction of loop structure according to given amino acid sequence.
• Loop refinement: Searching low-energy conformations of constructed loops.
In the KIC with fragments protocol, φ/Ψ/ω torsion angles from sequential residues in fragments of peptide (default monomers, trimers or nonamers) are used to sample all without 6 torsional degrees of freedom. KIC solves 6 torsions analytically.
There are 2 stages, namely loop reconstruction and loop refinement, to model the loops with “Kinematic Closure with fragments” algorithm. The loop reconstruction aim is basically structure improvement by remodeling or rebuilding peptide fragments and is advantageous due to rapid procedure and tremendous number of backbone conformation generation. The very first step is to produce initial loop which consist assumption of bond lengths, angles and omega torsions. Later, by the help of Ramachandran, idealized loop φ/Ψ torsions are changed with random values which guarantees the dispose of all the information about native loop. φ/Ψ/ω torsions are modeled with the (information derived from fragment) fragment data, continued with kinematic closure of the loop. This step utilizes Rosetta low-resolution scoring function and a centroid image to produce backbone conformations of each loop within the loop definition file. Predicting low energy conformations of peptide segments according to presented structure is performed at refine step. In refinement stage, Rosetta's high-resolution scoring function Talaris (Shapovalov & Dunbrack, 2011; Song et al., 2011; Leaver-Fay et al., 2013) applied for evaluation of side-chains and backbone conformations (Mandell et al., 2009).
2.2. Molecular Docking
Docking is a computational method used to predict the preferred conformation and position of atoms in a molecule when forming a stable complex with another molecule. In molecular docking technique, there are two common approaches to dock ligand into protein. The first is geometric shape complementarity which is defined as an algorithm to match solvent-accessible surface area of macromolecule and molecular surface of the ligand according to their conformations. (Goldman et al., 2000; Meng et al., 1992; Morris et al., 1998) The second approach simulates the real docking procedure where the ligand-protein pairwise interaction energies are evaluated (MacKerell et al., 2004; Vogt & Cera, 2012).
AutoDock Tools (ADT) (Morris et al., 2009) is a suite of automated docking tools which is designed to predict how small molecules, such as substrates or drug candidates, bind to a receptor of known 3D structure. It contains two main programs: the first one; AutoGrid4 is used for pre-computation of the area of the 3D "grid" structure, i.e. the region to which the ligand is connected. The second is AutoDock4 (Morris et al., 2009), which allows the ligand molecule to be targeted to the binding site. AutoDock4 allows the most appropriate conformation of the complex formed by the protein and the ligand.
AutoGrid uses a set of AMBER force field packages to define three-dimensional structure and to calculate van der Waals and Coulomb’s interactions (Huang et al., 2010). For each atom type in the ligand molecule to be docked, energy evaluation is achieved by pre-calculating atomic affinity potentials. In the AutoGrid procedure, the protein is embedded in a three-dimensional grid and a probe atom is located at every grid point. The interaction energy of this single atom with the protein is appointed to the grid point. AutoGrid affinity grids are calculated for each atom type in the ligand molecule, typically carbon, oxygen, nitrogen and hydrogen, as well as grids of electrostatic and desolvation potentials. Then, during the course of AutoDock calculation, the energetics of a certain ligand configuration is evaluated using the values from the grids.
AutoDock’s most widely used conformational search algorithm is the Lamarckian genetic algorithm (LGA). It also includes simulated annealing and traditional genetic algorithms. AutoDock uses a semi-empirical force field to predict the free energy of binding of small molecules to macromolecules. AutoDock is run for several times to produce several docked ligand conformations. The program allows the entire ligand to be completely flexible, as well as some specific portions of the protein (Morris et al., 2009). Finally, the best conformations of the ligand in the desired binding site are obtained according to their energy scores.
2.3. Molecular Dynamics
The Molecular Dynamics (MD) simulation technique is a computational method aimed at investigating the motions of multi-particle systems over time using classical physics. MD first emerged in the 1950s and is now widely used in multi-atomic and complex systems, such as
biological structures. Since the experimental methods provide static images of the biomolecules, MD is an efficient tool to investigate the structure-function relationship of the biosystems by studying the dynamics of the system.
In molecular level, interactions on the atoms result from both interatomic bonds and their charges and positions. Basically, 5 different interactions can be mentioned about on an atom. Interatomic interaction terms can be called angle bending, bond stretching, and torsion, originating from the covalent bonds between the molecular atoms. These interactions are found only in atoms with covalent bonds between them. The atoms that are not connected to each other can also have Coulomb interaction or Lennard-Jones interaction due to their charges and the distribution of these charges. Although the Lennard-Jones interaction is between all atoms, there is no Coulomb interaction in atoms with a net charge of zero.
The potential energy function, or force field, that includes all the intra- and inter- molecular forces within the system mentioned above is used in MD simulation. This force field contains terms that describe how the energy changes as bonds are rotated and the terms that describe interaction between non-bonded parts of the system. A functional force field mainly consists of bonded and non-bonded interactions and is generally represented by the following:
!"#$%&$'() = !,$-%$./'&0+ !2%&3'&0+ !$#-,'#&
+ !&#&2#&3%3 '&$%-(.$'#&, (2.1) 9 :; = <) 2 2#&3, = − =? @+ <A 2 (&0)%, B − B? @+ C& 2 $#-,'#&, (1 + cos GH − I ) + (4K'L[ N'L :'L O@ − N'L :'L P ] ; LROSO + T'TL 4UK?:'L ; 'RO ) (2.2)
9 :; denotes the potential energy, which is a function of the positions : of N atoms. < ) and
<A are constants for bond stretching and angle bending terms, respectively. The first term in Equation 2.1 and 2.2 models the interaction between pairs of bonded atoms, modelled here by a harmonic potential that gives the increase in energy as the bond length =' deviates from the reference value =',?. The second term is a summation over all angles formed between three
atoms in the molecule, again modelled using a harmonic potential. The third term in Equation 2.2 is a torsional potential that models how the energy changes as a bond rotates. The fourth contribution is the non-bonded term. This is calculated between all pairs of atoms (W and X) that are in different molecules or that are in the same molecule but separated by at least three bonds. In a simple force field, the non-bonded term is usually modelled using a Coulomb potential term for electrostatic interactions and a Lennard-Jones potential for van der Waals interactions.
The equations of motion of particles interacting with each other within a certain time period are numerically solved and trajectories are determined. Here the trajectory represents all of the particle coordinates at a certain time interval obtained in each time step. In the Newtonian mechanics, the potential energy on each particle is calculated, and from this potential energy, the net force on the particle is found. With the help of this net force, the function that determines the motion of the particle is solved numerically using the second law of Newton.
2.3.1. Potential Energy Velocity Verlet
Throughout the simulation, the force on each atom alters whenever the position of the atom changes, or whenever the positions of other interacting atoms changes. As the number of atoms increases, the number of interactions also increases, so the calculation of the potential energy becomes challenging, namely many-body problem. A finite difference method is used to handle such a situation. The fundamental idea in this method is to break down the integration into many small stages. One of the commonly used algorithms in finite difference methods is Velocity Verlet algorithm. In velocity verlet, positions and velocities are calculated at the same time value of the time variable by solving Taylor series expansion.
Fig. 2.1 shows the operation of a typical MD simulation. As can be seen from Fig. 2.1, the most important factor that must be known before starting the simulation is the initial position of the atoms. There are several experimental (e.g. Nuclear Magnetic Resonance (NMR) and X-ray
Crystallography) and theoretical (e.g. Homology Modeling) ways of obtaining these positions. The atomic coordinates of the structures used in this work are obtained from experimental studies. Although theoretical methods are very powerful today, the effective approach is to experimentally determine the structure of the molecule of interest.
Knowing the initial positions of atoms is required to start a MD simulation. In addition, one of the important things that must be known for the simulation to run is the initial speeds of the atoms. The initial speeds of the atoms are not known. Instead, a random initial velocity is distributed to each atom according to the Maxwell-Boltzmann distribution. In the next step, the forces on each atom in the system are calculated from the first derivative of potential energy. With the help of Newton's second law, the acceleration of the atoms is calculated from the forces acting on them. Once the acceleration is known, velocities are calculated and then, the positions of the atoms after certain time interval are determined according to their velocities. During the simulation, it is possible to monitor the change of many physical properties such as pressure, temperature and the energies related to the system.
Figure 2.1. Operation steps of a typical
The most time-consuming part of this integration scheme is calculating pairwise interactions. Especially calculation of the non-bonded interactions is challenging since the number of interactions dramatically increase when all of the atom pairs are included in potential energy calculation. In order to eliminate this difficulty, certain cutoff distance, generally 12-15 Å, is used to calculate the potential energy of the system by taking into account the interactions for only the atoms within that cutoff distance. Moreover, periodic boundary conditions are generally set up in MD simulations to deal with the boundary effects. Periodic boundary conditions enable a simulation to be performed using a relatively small number of particles in such a way that the particles experience forces as if they are in bulk fluid. For instance, in a cubic box simulation system, there are 26 imaginary neighbors around the center box in each dimension. The coordinates of the particles in the image boxes can be computed simply by adding or subtracting integral multiples of the box sides. In the case an atom leaves the center box during the simulation then it is replaced by an image atom that enters from the opposite side. Thus, the number of atoms within the central box remains constant.
2.4. MD Software
NAMD is a parallel Molecular Dynamics software designed for the high-performance simulation of biomolecular systems using force fields (Phillips et al., 2005). There are numerous empirical force fields designed for the simulations in various computational areas. Some of them, such as CHARMM, AMBER and GROMOS, have been intended specifically for the simulations of biomolecular systems. Either CHARMM or AMBER force fields can be used for parameterizations within NAMD.
Both CHARMM and AMBER are empirical, all-atom force fields that support proteins, nucleic acids, lipids and carbohydrates (Kukol, 2015). Although the general form of potential energy functions in both force fields are similar, significant philosophical and parameter optimization distinctions exist due to the additional improper (Equation 2.3) and Urey-Bradley (Equation 2.4) terms in CHARMM (Leach, 2001). Improper torsion term is basically calculated based on four atoms not successively bonded and used to select the correct geometry or chirality of atoms. Urey-Bradley is a cross-term accounting for angle bending using 1,3 nonbonded interactions and introduces a virtual bond between atoms 1 and 3. It is added into CHARMM
force field in order to apply a harmonic restraint on the distance between atoms 1,3 with respect to each other (Leach, 2001).
!'Y"-#"%- = <Z
2 ([ − [?)@ (2.3)
!]-%^_`-(3)%^ = <a
2 (b − b?)@ (2.4)
2.5. MD Trajectory Analysis Tools
2.5.1. Root Mean Square Deviation (RMSD)
The root-mean square deviation (RMSD) is a method that allows quantifying the average structural displacement of the protein atoms with respect to the selected reference (starting) structure. Often, instead of all atoms in RMSD calculations, only Cα atoms or backbone atoms (N, Cα, O) are involved. The RMSD is calculated according to the Equation 2.5:
cdef = (:' gO − :' g@ )@
;hijkl 'RO
m($#Y, (2.5)
where Natomsis the number of atoms whose positions are being compared and ri(t) is the
position of atom i at time t after superimposing on the reference frame. The calculation is repeated for every frame throughout the simulation trajectory.
2.5.2. Root Mean Square Fluctuation (RMSF)
Root mean square fluctuation (RMSF) is a method that gives information about the local conformational changes in the protein structure throughout the simulation trajectory. RMSF is measured according to the Equation 2.6:
cdeu = < (:' gL − :'
-%w)@ > y
$zRO
{ (2.6)
where T is the duration of the simulation (time steps), :'-%w is the reference frame, ri(tj) is the
coordinate of the residue i at time tj after superimposing on the reference, and the angle brackets
indicate that the average of the square distance is taken over the selection of atoms in the residue.
2.5.3. Area Per Lipid (APL)
GridMAT-MD (Allen et al., 2009) is a simple program, designed to analyze two important parameters in simulations of lipid bilayers; area per lipid headgroup (APL) and bilayer thickness. The program is particularly useful in the case of an embedded membrane protein, as the program can calculate the APL, while still compensating for the lateral area occupied by the protein at the intersection with the membrane interface.
2.5.4. Principal Component Analysis (PCA)
Molecular dynamic simulations can produce a huge amount of data which must be processed and analyzed. It is crucial to select significant conformations from among smaller data that has the representative set of conformations for further analysis. This can be achieved using cluster analysis which classifies similar conformations together.
A principal component is basically the linear combination of the variables. Principle component analysis (PCA) is applied to the simulation trajectories in order to reduce dimensionality of the system and to acquire collective results from the simulation. The first
step in PCA is the superimposition of each conformation in the trajectory into a reference structure. The second step is to construct variance-covariance matrix by calculating the deviations of positions from the average structure. For a system consisting of N atoms, the dimension of the matrix is 3Nx3N. In the third step, the eigenvalues and the eigenvectors are obtained by matrix diagonalization where 3N eigenvalues are yielded. The eigenvectors represent the intrinsic collective motions of the protein and the corresponding eigenvalues, after removing 6 zero eigenvalues (3 for rotational and 3 for translational motions), represent the magnitudes of these motions (David & Jacobs, 2014).
PCA is performed for the structures taken from MD simulations, using the PTRAJ utility of AMBER software (Case, 2005, 2008).
The input is an n by p coordinate matrix, X, where n is the number of snapshots and p is three times the number of atoms. Each row in X represents the atom coordinates of each snapshot structure. The elements of the covariance matrix, C, is calculated from the Equation 2.7:
Cij =<xi−<xi >>. <xj−<xj >> (2.7)
where averages are over the n snapshots. The covariance matrix, C, can be decomposed as
C = P∆PT (2.8)
where the eigenvectors, P, represent the principal components (PCs) and the eigenvalues are the elements of the diagonal matrix, ∆. Each eigenvalue is directly proportional to the variance it captures in its corresponding PC.
Correlation analysis of the system is performed by the Equation 2.9:
Ö'L = ÜáàÜzà âàà äã àåä ( äãkåäÜákÜzkâkk ) ä ç( ÜáéÜzé âéé äã éåä ) ä ç (2.9)
where U is the matrix of eigenvectors, and Ω is the diagonal matrix of eigenvalues. The cross-correlations maps indicate correlation of motion between different parts of the protein.
2.6. Modeling and Simulation Setup
In this thesis study, two homology modeled structures of NMDA receptors have been used. The homology modeling of the human NMDAR GluN1-GluN2A based on the crystal structure of Xenopus laevis GluN1-GluN2B NMDAR (PDB code: 4TLM) has been carried in a separate study (Demir & Essiz, 2017). Missing loops in the crystal structure are modeled by ROSETTA (Rohl et al., 2004).
Since the initial crystal structure has agonists and allosteric inhibitors, these molecules in the model are removed in order to obtain ligand-free structure of the protein, and this model will be named as ‘Apo’ throughout the thesis. The second structure used in MD simulation is obtained by docking the agonists glycine and glutamate into the LBDs of the receptor using AutoDock and this model will be named as ‘Ligand-bound’ throughout the thesis. The docking procedure will be explained below in detail.
During the preparation of both models for MD simulations, the protonation states of histidine (HIS) and other charged residues (GLU, ASP, LYS and ARG) have been determined by PROPKA (Olsson et al., 2011; Søndergaard et al., 2011) web server by calculating the pKa values of these residues at pH 7.4. All of the disulfide bridges between the close cysteine residues recommended in the X-ray structure pdb file are applied to the system in VMD (Humphrey et al., 1996). Both models are inserted into an unequilibrated palmitoyl-oleoyl phosphatidylcholine (POPC) membrane. Then they are solvated with TIP3P water molecules and are neutralized by adding Na+ and Cl- ions into the system. At the end, a system consisting of nearly 230,000 atoms are obtained.
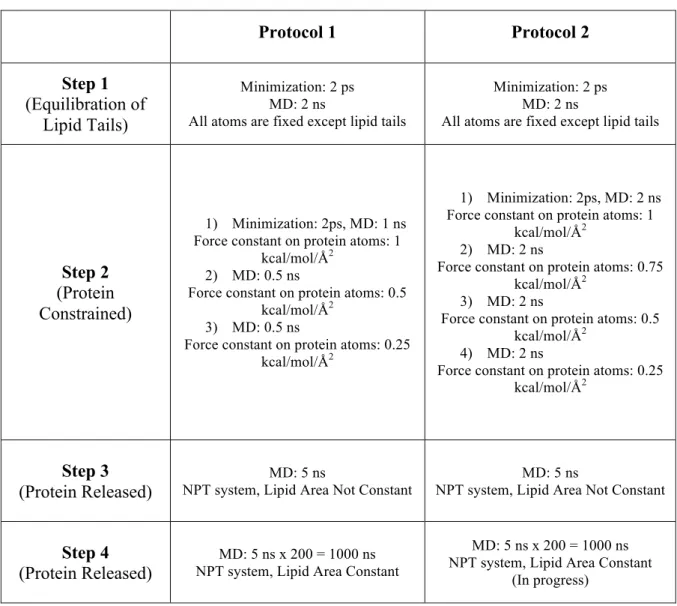
First, in order to equilibrate the POPC membrane, a simulation is performed in which all other atoms (water, ion, protein and lipid head groups) in the system are kept fixed except for lipid tails. This first step consists of 2 picoseconds (ps) (1,000 steps) minimization and 2 nanosecond (ns) (1,000,000 steps) MD runs with 1 fs time step at a constant temperature of 300 K and at constant volume (NVT). In the second step, both systems are minimized for 2 ps and simulated for 8 ns (four 2 ns simulation one after another with the spring constant 1, 0.75, 0.5 and 0.25 kcal/mol/Å2, respectively) with positional constraints implemented on protein atoms at 300 K constant temperature and 1 atm constant pressure (NPT). Furthermore, by the use of "NAMD
Tcl Forces" it is prevented the penetration of water atoms into the hydrophobic region of the membrane and the membrane-protein interface. This step is important for the equilibration of other molecules around the protein. Then, in the third step, the positional constraints on the protein atoms are completely removed and simulations are run 5 ns (NPT, lipid area not constant) with constant system pressure (1 atm) and temperature (310 K) while all system atoms are released. In the last step, the lipid area is kept constant, and 200 simulations of 5 ns (1 microsecond in total) are performed in 1 atm, 310 K (NPT).
All MD simulations are run using the CHARMM force field in NAMD with a nonbonded vdW cutoff 12 Å. Constant pressure is maintained by a Langevin piston set at 1 atm and constant temperature is maintained using a Langevin temperature piston set at 310 K in all the production runs. Particle Mesh Ewald electrostatics settings are applied to both systems. All of the production runs are performed using 2 fs time step.
Table 2.1. Protocols used in MD simulations.
Protocol 1 Protocol 2 Step 1 (Equilibration of Lipid Tails) Minimization: 2 ps MD: 2 ns
All atoms are fixed except lipid tails
Minimization: 2 ps MD: 2 ns
All atoms are fixed except lipid tails
Step 2 (Protein Constrained)
1) Minimization: 2ps, MD: 1 ns Force constant on protein atoms: 1
kcal/mol/Å2
2) MD: 0.5 ns
Force constant on protein atoms: 0.5 kcal/mol/Å2
3) MD: 0.5 ns
Force constant on protein atoms: 0.25 kcal/mol/Å2
1) Minimization: 2ps, MD: 2 ns Force constant on protein atoms: 1
kcal/mol/Å2
2) MD: 2 ns
Force constant on protein atoms: 0.75 kcal/mol/Å2
3) MD: 2 ns
Force constant on protein atoms: 0.5 kcal/mol/Å2
4) MD: 2 ns
Force constant on protein atoms: 0.25 kcal/mol/Å2
Step 3 (Protein Released)
MD: 5 ns
NPT system, Lipid Area Not Constant
MD: 5 ns
NPT system, Lipid Area Not Constant
Step 4 (Protein Released)
MD: 5 ns x 200 = 1000 ns NPT system, Lipid Area Constant
MD: 5 ns x 200 = 1000 ns NPT system, Lipid Area Constant
2.6.1. Docking
AutoDock Tools (ADT) is used to calculate the positioning of glycine and glutamate, which are the natural agonists of the receptor that is obtained from homology modeling.
First, the ligands to be positioned on the model with AutoDock4 are isolated from the crystal structure. Glycine molecules for GluN1 (1st and 2nd chains, will be named GluN11 and GluN12
in this document) and glutamate molecules for GluN2A (1st and 2nd chains, GluN2A1 and
GluN2A2) are separately saved in pdb format. The ligand binding sites of each chain in the
model and the ligands for those sites are matched according to the best conformation. In this process, the torsion numbers of each ligand are first determined, i.e. how many and which bonds in the molecule are allowed to be rotated, are given as inputs to the ADT. Thus, different conformations can be calculated for the molecule. This is done with default values for each ligand identified by the ADT. Ligands are saved in pdbqt format with this information.
During the docking process, ADT Grid Options Widget is used to determine the region to be searched where the ligands are located at the most appropriate location. This region is determined by selecting a center and then by setting a certain number of points in each direction at equal distance from each other. Based on the crystal structure, the center for each ligand is selected from the LBD regions of each chain, and a grid box dimension is determined as 50 * 50 * 50 in Å. This process is completed using AutoGrid4 via ADT.
After the preparation stage, ligands for the docking process and information on the areas where these ligands can be positioned on the macromolecule are obtained. Genetic algorithm is used as a search parameter for this positioning. With this algorithm, each ligand is evaluated 2,500,00 times for each run in the Grid box. Lamarckian genetic algorithm is used as the output. With this algorithm, the best 20 conformations are selected according to energy scores (Huey et al., 2007). AutoDock4 is run for each chain and ligand with these parameters, and the best conformation of ligands is placed on the model to be used for simulation.
3. CHAPTER 3: RESULTS AND DISCUSSION
3.1. Analysis of Two Template Structures
There are two X-ray structures available for homology modelling step. Both X-ray structures were resolved in 2014, first one was published in Science and the second in Nature, with resolutions 4 Å and 3.7 Å, respectively. The sequence identity of the human NMDA receptor and X-ray structure derived from the Xenopus laevis(Lee et al., 2014) is 92% and 81% with human GluN1 and GluN2A, respectively. The sequence identity of the human NMDA receptor and X-ray structure derived from Rattus norvegicus (Karakas & Furukawa, 2014) is about 98% for both chains.
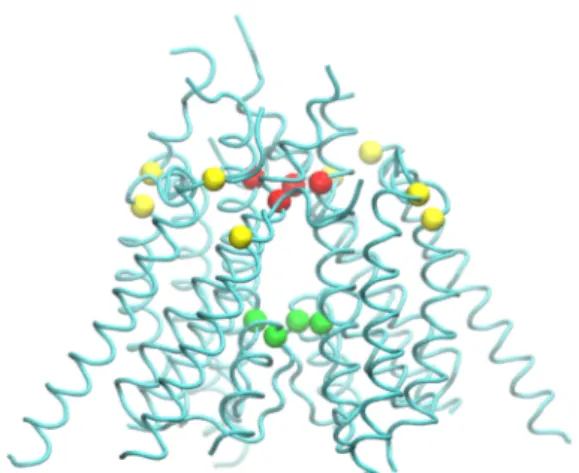
Using Rattus norvegicus NMDA structure as a template for homology modeling is thought to be more acceptable because the sequence identity with human sequence is higher in Rattus norvegicus NMDAR. Unfortunately, a number of mutations have been applied to sequences in order to crystallize these structures. These structural changes can alter the characteristics of the conformational changes driving the function of the protein. For instance, approximately 15 neutralizations and 5 CYS cross-linking mutations are added to the Rattus norvegicus structure. Four of these CYS mutations are shown in Fig. 3.1(yellow beads indicate cross link locations). These mutations connect TMD M1 and M4 helices. The CYS mutations in TMD on each subunit might be essential in terms of transmembrane helices moving together when gating. Namely, when these mutations are recovered, the structure can gain freedom between the subunits (Karakas & Furukawa, 2014; Lee et al., 2014).
There is a K216C cross-link cysteine mutation which links ATDs in the structure of Xenopus laevis (Fig. 3.2A ATD site). In the absence of this mutation, ATD fragments are observed to be opened approximately 25 degrees (Fig. 3.2 B) (Lee et al., 2014).
As a result of the above-mentioned reasons, the primary focus is the comparison and stability of these two NMDAR X-ray structures as the initial step of this study. The structures of Xenopus laevis and Rattus norvegicus are compared in Fig 3.2A. TMD part is the most challenging step of crystallization and it is obtained by homology modeling using the potassium channel as the template (Lee et al., 2014). Fig. 3.2 A reveals that the M1-M2 linker helix, which have been shown to play important role in channel closure (Lee et al., 2014), in TMD of the Rattus norvegicus structure, is not completely resolved. Additionally, some other helices are missing (red colored regions in Fig. 3.2 A). Moreover, since obtaining a stable TMD structure is challenging, the different subunits of TMD are linked by CYS cross-links as depicted above (yellow balls in Fig. 3.1). Green ball in Fig. 3.2 A shows the location of the CYS cross-link between ATD of GluN2B dimers.
The structure from Xenopus laevis seems less modified, especially for TMD segment. Still the two loop structures in GluN2B are cut off. These loop structures consist of 9 or 10 amino acids. One of them links the M1 helix to M2 helix (red colored and labeled as missing pore helix in Fig. 3.2A) and the other connects M3 helix to the LBD region (green colored and labeled as missing linker in Fig. 3.2A) (Karakas & Furukawa, 2014; Lee et al., 2014). There are also missing ATD-LBD linkers in GluN12, GluN2B1 and GluN2B2 (Fig. 3.2A).
Figure 3.1. Structure of ion channel (only TMD is shown). Red beads indicate TMD
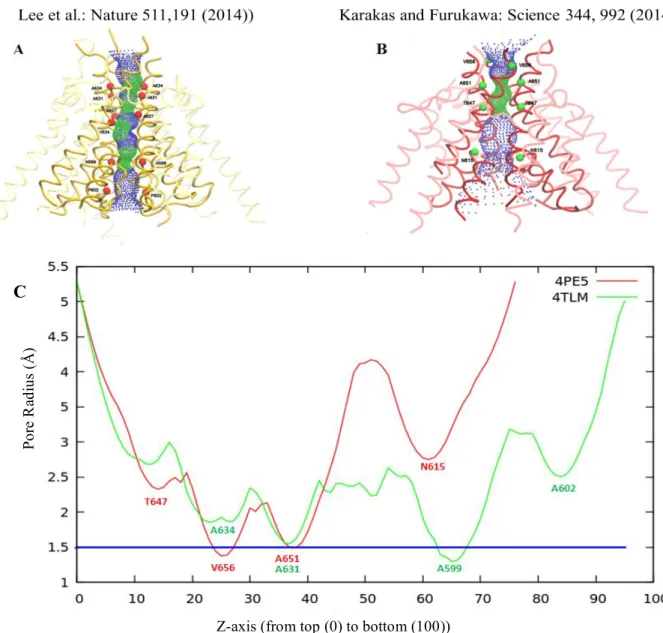
Additionally, the ion-channel radius profiles are generated using the HOLE program (Smart et al., 1996) in both structures (see Fig. 3.3C). Pore profiles along the channel of 4TLM (Xenopus laevis) and 4PE5 (Rattus norvegicus) structures are shown in Fig. 3.3A and B, respectively. The surface along the channel is also depicted using HOLE in Fig. 3.3A and B in the order of 4TLM and 4PE5. Two girdles appeared on the pore profiles of the structures. One of them, named as TMD top girdle, is observed at the top of the M3 helix near the extracellular side (between 30-40 Å in the Z axis in Fig. 3.3C). The other one, TMD bottom girdle, is observed at the lower end of the M2 helix. It is observed at 65 Å in the Z axis in Fig. 3.3C. The second girdle region in the X-ray structure of Rattus norvegicus is missing. The M2 pore lining helix in the channel has not been resolved in this structure and the TMD bottom girdle corresponds exactly to this point. Overall analysis showed that the TMD structure of Xenopus laevis is more detailed and complete compared to the structure of Rattus norvegicus.
Missing TMD segments
Figure 3.2. (A) Structural differences between the structures of 4TLM and 4PE5. (B)
Disulfide bridge mutation in the ATD and the observed increase in angle in the absence of this mutation.
B A
3.2. Loop Modeling
Homology model of the receptor has been completed by Demir and Essiz (Demir & Essiz, 2017). Two different modeling strategies were applied. The first one was modeling the protein independently by taking each individual subunit at a time, then combining these subunits to form the tetramer structure. The second one was modeling the protein as a tetramer structure from the tetramer template.
Z-axis (from top (0) to bottom (100))
Po re R ad iu s (Å ) C
Figure 3.3. Pore profiles of TMDs in structures (A) 4TLM (yellow) and (B) 4PE5 (red). The small
green dots show the narrow regions of the channel and the blue dots show the wider regions. The helices forming the ion channel are shown in bold colors. Pore lining residues are shown as red beads for 4TLM and green beads for 4PE5.
When chains are modeled individually, more accurate models in terms of structural quality can be obtained since the homology modeling is an optimization problem and when the problem becomes smaller better refined models can be obtained. However, in an intact structure, the chains in the structure are not independent from each other. Namely, when modeling the structure as a tetramer, neighboring residues in different subunits can interact in a more accurate way and they are arranged in the structure correctly during optimization.
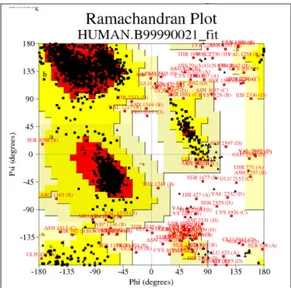
In the work of Demir and Essiz, the orientation of the side chains in tetrameric structure modeled with loops has been tested for clashing residues via using PROCHECK (Laskowski et al., 1993) program. Fig. 3.4A and B shows PROCHECK Ramachandran plot of the template and the structure obtained by modeling all chains together with loops. In the Ramachandran plots, the percentage of residues found in the allowed regions was 77 % for the model, while it was 94 % for the template structure.
Validating the template structure in addition to the model is also important since the template directly affects the accuracy of the model. In other words, if the template structure has problematic regions, those regions would be acquired from template as well. But in our case, model and template has some difference. That means model could have still been improved.
B A
Figure 3.4. Ramachandran plots. (A) The results of the template structure. (B) The results of