DOI: 10.1501/commua1-2_0000000093 ISSN 1303-6009
© 2016 Ankara University Communications Faculty of Sciences University of Ankara Series A2-A3: Physical Sciences and Engineering
POWER QUALITY ANALYSIS USING USER INTERFACE
İlhan KOŞALAY, Galbadrakh ERDENESAIKHAN
Ankara University Engineering Faculty department of Electrical and Electronic Engineering Golbasi 50.yil yerleskesi L-block #06830 Golbasi/Ankara
E-mail : [email protected]
Ankara University Engineering Faculty department of Electrical and Electronic Engineering Golbasi 50.yil yerleskesi L-block #06830 Golbasi/Ankara
E-mail : taı[email protected]
(Received: May 13, 2016; Accepted: July 22, 2016) ABSTRACT
Understanding and researching about power quality techniques are one of the most important issue in power plant sectors, costumers and has been explored by many researchers. And it becomes more important to understand the causes of electronic equipment being damaged and effected by power disturbances, for this purpose there is need for reliable techniques and algorithms that can work for power quality analysis. In this paper, the different models for Power Quality disturbances are developed using Matlab – Simulink and graphical user interface for users. These models are including three-phase sources, three-phase breaker for removing large load to simulate the voltage swell and three-phase fault and removal large load are used for simulation of voltage sag, three phase nonlinear loads are used for to simulate unbalance voltage, permanent there-phase fault for simulation model of interruption and converter with a source impedance for voltage notch system models are gave with the results of the models.
KEYWORDS: Power Quality Disturbances, Simulation Models, Matlab-Simulink, Graphical User Interface.
1. INTRODUCTION
The Power Quality requirement is also one of the most important issues for electrical utilities of consumers [1], and it becomes especially important with the introduction of sophisticated devices, whose performance is very sensitive to the quality of power supply [2]. This equipment are computers, electronic equipment, adjustable AC and DC drives, induction and synchronous motors, contactors and etc. [3]. to reduce the effects of the power quality disturbances, a system has to use some power quality mitigation devices and these devices can control the disturbances like sag, swell, harmonics, unbalance, notches
and interruption. In addition, voltage sags, voltage swell, harmonic voltage, voltage unbalance, voltage notch and voltage interruption are the most important power quality problems in the distribution system and are usually caused by fault conditions [4], switching large load, and unbalance loads by the starting of large electric motors. MATLAB – simulation and Simulink simulation models are used for studying those different power disturbances. MATLAB simulation is also commonly used for to simulate disturbance waveform of power quality event analysis. A number of papers addressed the issue of power system simulation in MATLAB/Simulink. Using the real-time workshop, the authors in [5] have demonstrated real-time simulation of power system in the Simulink environment. MATLAB graphical user interface (GUI) controlled Simulink simulation models are developed for analyzing behavior of the models and the characteristic of the wave form. In this paper, MATLAB GUI based power quality simulator code is improved.
2. THE MAIN USER INTERFACE
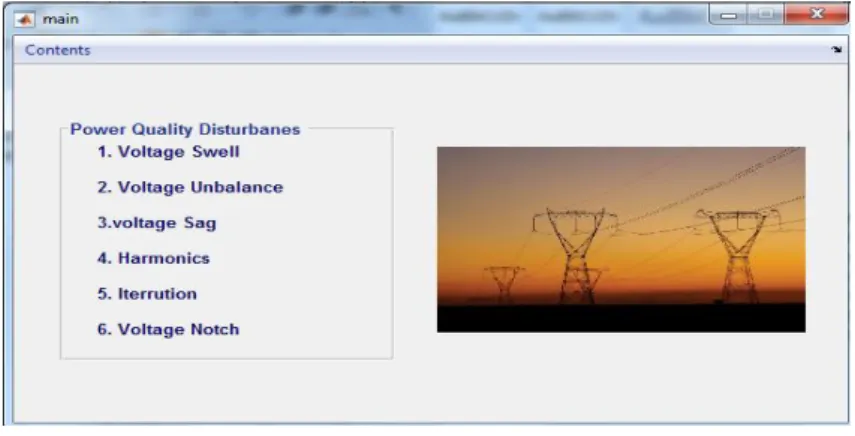
In this section of code, user can choose the model name for desired disturbance and when user clicks the right name of the disturbance, it will be opened as user interface window. Main window is shown in figure 1 below. This user interface is developed with Matlab Graphical User Interface. The sub interface for the models include a simulation models of the disturbances. They are developed with Matlab-Simulink and have the parameter boxes for controlling and changing values of the models components of the Simulink model. One graphical window is placed in every sub GUI and the graphic window will show the result of estimating the disturbances as the result of the simulation model. Working with the main window makes it easier to pass between the other user interfaces.
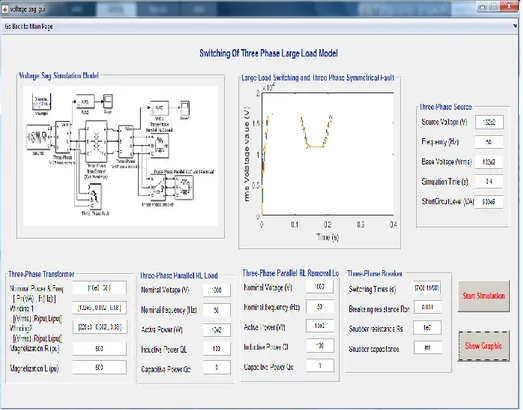
3. SWITCHING OF THREE PHASE LARGE LOAD MODEL (VOLTAGE SWELL)
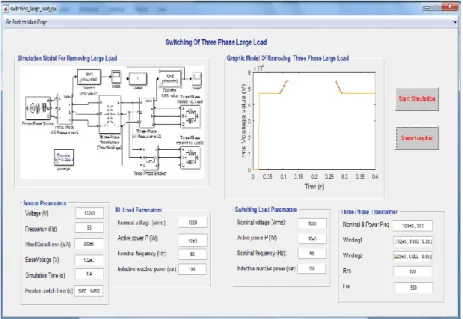
The main cause of voltage swell is removing large load using three phase breaker circuit [1]. The three phase large load shutdown model developed in Matlab simulation is shown in figure 2. Initial values of the circuit components are firstly loaded in the user interface as shown in the figure 2 and the values can be changed as desired. The large load shutdown model consists 132kV 50HZ three phase source block feeding to a 800 MVA resistive inductive load through a 132 kV / 220 kV, 100MVA star/delta transformer. A graphic shown on the user interface shows the output of the models waveform which is connected to the primary winding of the transformer in the model. The main cause of the voltage swell is removing the large load using three phase breaker circuit which is initially closed and three phase external load shutdown upon opening of the three phase breaker at 220 kV feeder line causing swell in voltage at 220 kV bus.
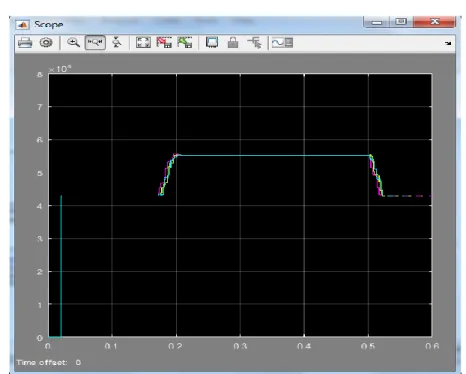
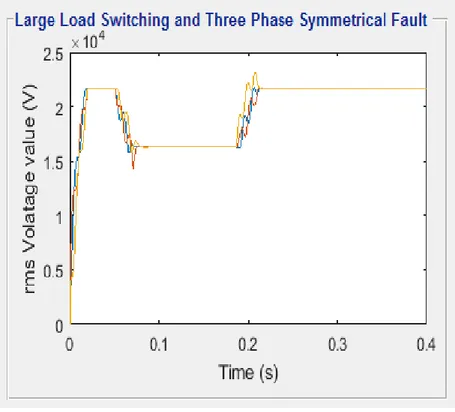
Figure 2. User interface for simulation model of Removing Large Load. The graphic output of the voltage swell is shown in figure 3, after increasing the values of removal large load and three phase parallel RL load, increasing the breaker circuits sample time some changes are shown in the amplitude of the waveform and amplitude of the voltage swells.
Figure 3. Simulation output of voltage swell due to removing large load.
4. SIMULATION MODEL FOR UNBALANCE LOAD
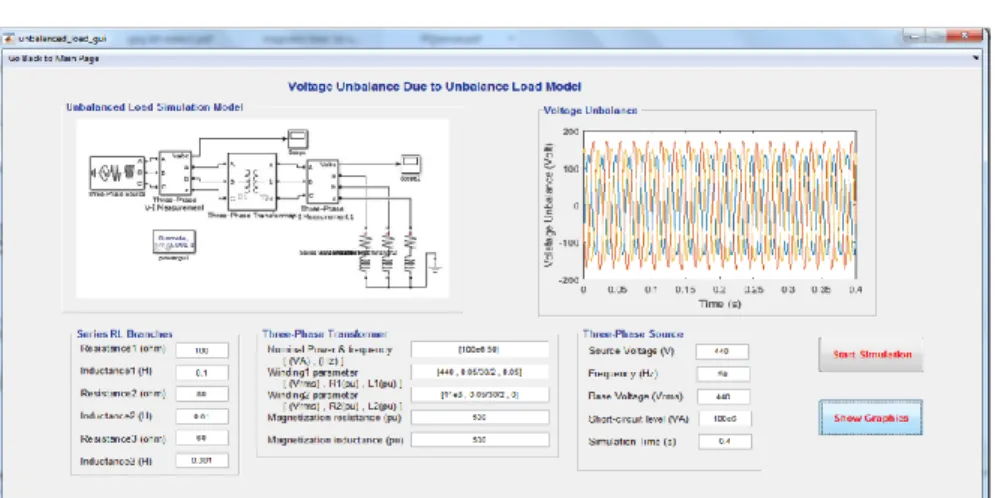
The developed unbalance load switching model in Matlab simulation and Matlab Graphical User Interface is shown in figure 4. Main cause of voltage unbalance is unbalanced load on the system. The unbalance load model consists of initially 440V, 50Hz three phase source feeding to three different resistive inductive loads. Each different unbalance series RL load branches are connected at the three feeders on load side to simulate voltage unbalance, respectively 100 ohm, 0.1H, 80 ohm 0.01H, 60 ohm 0.001H through 440V/11kV 100MVA transformer.
Figure 4. User Interface for Unbalance Load model, including Matlab simulation model and parameters control boxes.
The main causes leading to voltage unbalance are unsymmetrical distribution system and unsymmetrical loads. Figure 5 shows the condition when unsymmetrical loads are connected on three feeders which causes the unbalance in voltage. Reducing simulation sample time and simulation models frequency, it is easy to recognize the unbalance three phase voltage caused by three different unbalanced series RL branch loads.
5. SIMULATION MODEL FOR VOLTAGE SAG
A fault could be a short circuit that causes voltage sag in power systems [3]. The model consists of 132KV, 50HZ three phase source block feeding to three phase load through 1322KV/220KV delta/wye transformer. There are two initial scopes are located at 132KV and 220KV buses of transformer. The voltage sag can occur by switching the large load, three phase fault, single line to ground fault, transference of load from one source to another or starting of large induction motor. The simulation model of voltage sag due to three phase fault and large load switching during the closing of three phase breaker controlling with user interface is shown in figure 6.
Figure 6. User interface for simulation model of Voltage Sag. The simulation output of voltage sag is shown in figure 7.
Figure 7. 220 KV Bus instantaneous wave form of voltage sag
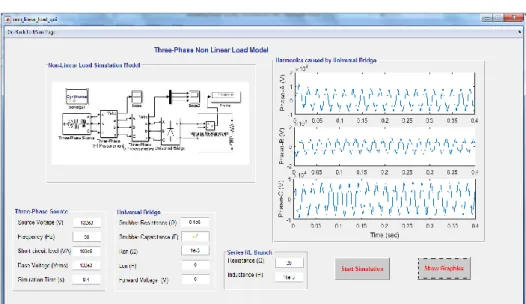
6. SIMULATION MODEL FOR THREE PHASE NON LINEAR LOAD
Nonlinear load model is developed in Matlab Simulink simulation and controlled graphical user interface is shown in figure 8. This model is used to simulate harmonics caused by universal bridge. The simulation model consists of 132KV and 50 HZ line frequency three phase source block feeding to a three phase universal bridge connected across series resistive and inductive branch. Parameter values of circuit components are shown in parameter boxes in the user interface as given in the figure 8. All the parameters are available to change any desired component values from user interface for analyzing nonlinear harmonic load model.
Figure 8. Graphical user interface for three phase nonlinear load caused by universal bridge.
Figure 9 shows harmonic wave forms caused by universal bridge connected across 10 ohm and 10mH series resistive inductive branch.
Figure 9. Three phase nonlinear load due to harmonic wave form caused by universal bridge.
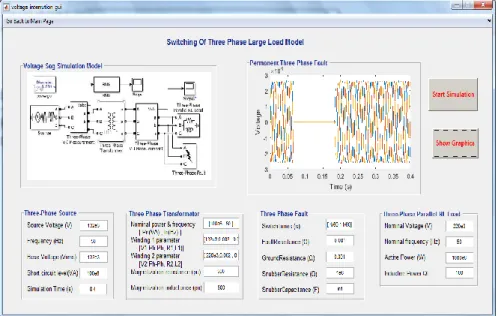
7. SIMULATION MODEL FOR PERMANENT THREE PHASE FAULT (INTERRUPTION)
Here, the disturbance type of the model is voltage interruption. The main reason of the disturbance in the model is caused by three phase fault as permanent three phase fault circuit. The permanent three phase fault model is modeled in Matlab Simulink and developed in Matlab Graphical User Interface (GUI). Control window of the simulation model is shown in figure 10. The model consists of 132KV, 50HZ three phase source feeding to 1000MW resistive inductive load through 100MVA delta/wye transformer.
Figure 10. Graphical User Interface For The Model of Voltage Interruption due to Permanent Three Phase Fault
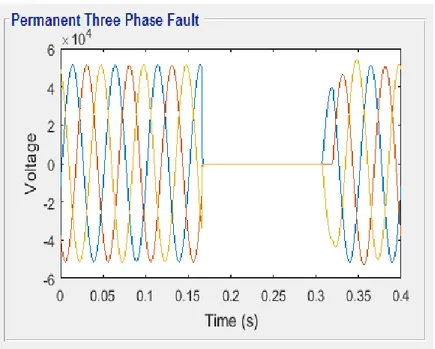
During the three phase permanent fault, the voltage in the system is zero. it refers to interruption until the fault is clear. There are the instantaneous scopes which are located at each windings of the transformer as shown in the figure 10. Figure 11 shows that the representation of the permanent three phase fault as the initial values of the components are changed as 500MW of resistive inductive load, 20 Hz line frequency. Interruption duration time is T = 0.15-0.3 sec and the simulation operating time is 0.4 sec as shown in figure 11 below.
Figure 11. 220 KV Bus Instantaneous Representation Wave form of Voltage Interruption
8. SIMULATION MODEL FOR CONVERTER (VOLTAGE NOTCH)
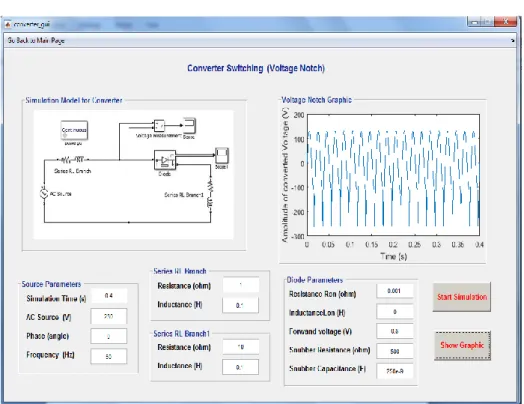
Notching disturbances are not in sinusoidal periodic waveform. This type of distortions consists of notches in the fundamental sine wave component. This is caused by the commutation of current from one phase to another during continuous operation of power electronic devices. The Matlab Simulink simulation model and the voltage notch distortion waveform of the model shown in figure 12. Initial values of the models components are shown in the parameter boxes and for analyzing the distortion any values of the components can be changed as desired values of the models components.
Figure 12. Controllable Graphical User Interface for Simulation model for Voltage Notch due to Switching Converter.
The model is used to simulate notches in the voltage caused by switching converter. The simulation model consists of 230V, 50HZ single phase source block feeding to the converter through series resistive inductive branch. The resistive inductive branch in series with voltage source consists of resistance of 10 ohm and inductance of 0.1H .
Figure 13 shows that initial values of the models components are changed for analyzing the changes in waveform and amplitude of the distortion. The initial values of the parameter boxes are changed as resistive inductance is respectively 50 ohms, 5H and 220 single phase source feeding 100-ohm resistance 0.01H series inductance branch.
Figure 13. Disturbance of Voltage Notch due to Converted Waveform.
9.CONCLUSION
In this paper, different power quality disturbances are simulated using MATLAB –SIMULINK software and developed MATLAB based graphical user interface. The simulated disturbances models are voltage swell, voltage unbalance, voltage sag, and harmonics, voltage interruption, and voltage notches. The developed graphical user interface makes the power quality analysis easy. So, to observe circuit parameters on the power quality problems could be accelerated by this graphical interface. This paper serves as the first step in easy analysis of power quality.
REFERENCES
[1] P .V.Dhote, B.T.Deshmukh, B.E.Kushare, " Generation of Power Quality Disturbances Using Matlab-Simulink, " , Computation of Power, Energy Information and Commuincation (ICCPEIC), 2015 International Conference on, (2015),0301-0 305.
[2] Mahesh Singh , Vaibhav Tiwari, "Modeling analysis and solution of Power Quality Problems" SSCET Bhila INDIA, (2013).
[3] J.Beiza, S.H.Hosseinian, B.Vahidi "Fault Detection and identification for voltage sag state estimation in power systems", Turkish Journal of Electrical Engineering & Computer Sciences Vol/18, (2010), 665-676.
[4] M.Ucar,S.Ozdemir,E.Ozdemi,"A.Unified Series parallel active filter system for non-periodic disturbances,"Turkish Journal of Electrical Engineering and Computer Sciences,Vo1.19,(2011),575-596.
[5] Karl Schoder, Amer Hasanovic, Ali Feliachi, Azra Hasanovic, "PAT : A Power Analysis Toolbox for MATLAB Simulink", IEEE Transactions on Power System Vol. 18. No.1, (2003) 42-47.