• Sonuç bulunamadı

An Anisotropic Model of Unbound Granular Material Under Repeated Loading

N/A
N/A
Protected

Academic year: 2021

Share "An Anisotropic Model of Unbound Granular Material Under Repeated Loading"

Copied!
8
0
0

Yükleniyor.... (view fulltext now)

Tam metin

(1)

AN ANISOTROPIC MODEL OF UNBOUND GRANULAR MATERIAL

UNDER REPEATED LOADING

by

Mustafa KARASAHIN*

Department of Civil Engineering, Istanbul Gelisim University, Istanbul, Turkey Original scientific paper

https://doi.org/10.2298/TSCI181021043K

The base and subbase layers of a pavement are compacted to the desired density by rollers. This cause the anisotropy in other words the layer more stiffer in the verti-cal direction than the horizontal direction. In the study inherent and stress induced anisotropy were measured by using the repeated load triaxial test equipment which is able to cycle both confining and axial pressure. The test results were then mod-elled using the stepwise regression. A new cross anisotropic model was proposed to predict the unbound stress-strain behavior. The proposed model is able to predict the axial strain more accurately than the radial strain.

Key words: unbound granular material, anisotropy, repeated loading, modelling

Introduction

Unbound granular material is used as base and subbase material in a pavement struc-ture. The base layer is the main structural layer which distributes the wheel loads. The purpose of sub-base layer is to provide a good working platform for the road construction of upper lay-ers, to distribute the wheel loads so that the subgrade layer will not deform excessively and to prevent the subgrade layer from frost action.

Casagrande and Carillo [1] may have been the first researchers to differentiate be-tween the inherent and the stress-induced anisotropy. Anisotropy is defined as the ratio of axial strain to radial strain under isotropic stress conditions [2]. Inherent anisotropy is a physical characteristic inherent in granular material and mainly occurs due to deposition/arrangement of particles [3-5] and also compaction of granular particles during rolling stage. Stress-induced anisotropy occurs during the process of straining of soil particles [6, 7]. It should be possible to measure the resilient anisotropic characteristics of a granular material in a repeated load triaxial apparatus, simply by cycling of the cell pressure. However, other test equipment such as the hollow cylinder apparatus [8] and the cubical triaxial apparatus [7, 9-11] can also be used to measure anisotropic characteristics of granular material.

Many researchers have worked on anisotropic characteristics of sand [7, 8, 10, 12]. Anisotropic resilient modulus was measured by Tutumluer and Seyhan [13]. Pavement stress-strain responses considering cross-anisotropy in base and subbase, were modelled using finite element modeling technique [14, 15]. Anisotropic properties of unbound granular materials were measured by repeated load triaxial test and the anisotropy was modelled by modified Boyce model to implement in finite element analysis [16].

(2)

Anisotropy

Granular layers in the pavement (either base or sub-base) are compacted to achieve a maximum density so that they can provide adequate support and reduced deflection. During the compaction process the layer will almost become anisotropic due to the vertical load applied to it. The layer will then be stiffer vertically than horizontally. Different forms of anisotropy exist namely inherent, stress-induced and stress-history-induced anisotropy.

Inherent anisotropy

In highway construction, granular material is generally obtained from a local quarry which satisfies the specification. It is then transported to the site and a suitable vibrating roller compacts the granular layer in order to achieve the desired density. As a consequence of the compaction effort the layer is expected to be more stiffer in the vertical direction than the hori-zontal direction. For pavement engineering purposes inherent anisotropy may be defined as the physical characteristics inherent in the granular material due to compaction and gravitational cause.

Stress induced anisotropy

Stress-induced anisotropy is defined as a physical property of a soil due only to strain associated with an applied stress [7]. An isotropic material will behave isotropic under the application of an isotropic loading. However, when the applied stress is no longer isotropic, in other words is not the same in all directions, the material will no longer strain isotropy. There-fore, new contact points occur and the stress/strain behaviors vertically and horizontally will no longer be in the same relationship to each other as before. When the stress is removed the contact points may return the original position as long as the strain is resilient.

If a granular layer in a pavement structure is considered, stress-induced anisotropy is experienced due to a resilient change in granular layer structure due to the passage of a vehicle. Stress history induced anisotropy

Traffic mainly consists of heavy vehicles that cause relatively large amounts of recov-erable and some irrecovrecov-erable (plastic) deformations. During plastic deformation some contacts between grains disappear, some particles could break, some particles slide relative to one other and some new contacts will develop. As a result of plastic strain the inherent anisotropy which existed before trafficking has changed. Therefore, the deformation characteristics of the granu-lar layer before repeated trafficking and afterwards will not be the same.

Stress-history-induced anisotropy for pavement engineering purposes can thus be de-fined as the change in inherent anisotropy caused by the repeated application of traffic loading in a granular layer.

Materials

Sand and gravel is a road construction material mostly limited to use as a capping layer. The material was obtained from a pavement trial at city of Bothkennar, Scotland and was tested dry.

Crushed limestone is an important road construction material both in Turkey and UK. The material used in the study was a dolomitic limestone supplied from Whitwell Quarry in Derbyshire, UK. It may have a self-cementing capability when it is in a partially saturated con-dition. For this reason the material was compacted in a dry concon-dition.

(3)

Sample preparation

The bottom platen of a triaxial appara-tus was placed on a smooth table and an inner membrane was stretched to fit around it. A vac-uum was applied through the mould to hold the membrane against its sides.

During the compaction a full-face 150 mm diameter circular shaped surcharge load was placed on the layer. Each layer was subjected to vibration for 15 seconds. The den-sities achieved are 16.41 kN/m3 for limestone and 21.63 kN/m3 for limestone. The low densi-ty of soft limestone is attributable to its grading. Grading curves are shown in fig. 1.

Repeated load triaxial test

In the study a repeated load triaxial ap-paratus was used. The axial and confining pres-sure are applied to the samples in a triaxial cell by hydraulic actuators. The axial load is contin-uously monitored by a load cell and similarly, the confining pressure is controlled by the out-put of a pressure sensor in the cell fluid. The equipment is illustrated in fig. 2.

The internal dimension of the cell is 300 mm diameter and 550 mm high. The sam-ple size is 150 mm diameter and 300 mm high. The confining stress is applied on the sample through silicone oil. The apparatus is able to cycle both axial and confining stress either sep-arately or simultaneously. Radial deformations were measured by hoops incorporating strain gauges. Axial deformations were measured using linear variable deformation transducers (LVDT) mounted between the two pairs of threaded rods. Details of the apparatus can be found from [18].

Sequence of testing

In order to determine the inherent anisotropy of a sample, it was first subjected to a repeated cell pressure with half sine waveform from a low stress of 25 kPa to an upper stress, increased in 25 kPa increments, ranging from 50 kPa to 225 kPa. During the axial loading ram was disconnected. The 50 cycles were applied to the sample for each stress path. During the last five cycles stresses and strains were recorded for evaluation.

In order to see the effect of resilient loading on anisotropy, resilient repeated cell pres-sure tests with constant (and non-zero) deviatoric stresses, resilient deviatoric stress tests with

0 10 20 30 40 50 60 70 80 90 100 0.01 0.1 1 10 100 Pa ss in g [ %] Particle size [mm] Sand and gravel

Limestone

Figure 1. Grading curves for sand and gravel and limestone [17] Axial load ram Hoops LVDT sample Triaxial cell Cell Pressure Axial load Silicone oil

(4)

constant cell pressure and tests with the cycling of both stresses were applied on each sample. 50 cycles of loading were applied to the sample on each stress path.

In order to see the stress-history-induced anisotropy in the sample, it was subjected to about 1% axial permanent deformation due to a repeated a deviatoric stress level of 250 kPa at a 50 kPa cell pressure. The load ram was again disconnected and the stress paths for the deter-mination of the inherent anisotropy was repeated.

Discussion of anisotropy test results

Inherent, stress-induced and stress-history-induced anisotropy will be discussed sepa-rately. For the discussion, the results obtained for a wide range of repeated cell pressures start-ing from 25 kPa and risstart-ing to 225 kPa were chosen. Limited results are given for the stress-in-duced anisotropy since, for various reasons, incomplete data was available from the tests. In fig. 3, anisotropy is defined as the ratio vertical strain/horizontal astrain. Thus a value of 1.0 indicates isotropy and a value approaching 0.0 is highly anisotropic. Peak values of anisotropy for different materials are shown in figs. 3(a) and 3(b). The anisotropy decreases as the isotropic pressure increases. (a) (b) 0.0 0.2 0.4 0.6 0.8 1.0 0 50 100 150 200 250 Iso tr opy

Cyclic cell pressure [kPa] Inherent Stress-history 0 0.2 0.4 0.6 0.8 1 1.2 0 50 100 150 200 250 Iso tr opy

Cyclic cell pressure [kPa] Inherent Stress-history

Figure 3. (a) Sand and gravel and (b) limestone anisotropy test results [17] A cross anisotropic model

For triaxial test conditions where σ1 is axial stress and σ2= σ3 are cell pressure and the

mean normal stress, p, and the deviatoric stress, q, is described:

1 2 3 3 + = p σ σ (1) 1 3 = − q σ σ (2)

Axial strain, εa = ε1, and radial strain, εr = ε2 = ε3, terms are used for triaxial test con-ditions. If a hydrostatic pressure is applied to a cylindirical granular material sample, in other words σ1 = σ2=σ3,the volumetric strain is calculated:

εv= ε1 + ε2 + ε3 (4)

If a σ1 vertical principal stress is applied to a cylindirical sample, a vertical strain, ε1, is developed in the vertical direction. Elastic modulus is then defined:

1 1 =

E σ

(5)

where E is the elastic modulus. The Poisson’ s ratio:

2 1

υ

ε (6)

where υ is the Poisson’s ratio.

To develop a new unbound granular material model, volumetric strain, εv, and shear strain, εs, equations in which K (bulk modulus) and G (shear modulus) is a function of p and q. However, the volumetric strain may change sign from positive to negative which may cause difficulty for predictions. Therefore, axial, εa, and radial, εr, strain are chosen for the model development. The reason for choosing this type of model is that it is simple for mathematically and conceptually, axial and radial strains are measured directly and also non-linearity is taken into account. The models chosen are:

a = f p q( , ) ε (7) ( , ) = s f p q ε (8)

A cross anistropic model for a cylindirical sample is:

      a r δε δε =M1r 1 2 2 1 2 1 − −        − −         a r n n n ϑ ϑ δσ δσ ϑ (9)

where Mr is the resilient modulus (change in vertical stress over change in vertical strain), n = Eh/E (Eh – the elastic modulus in radial direction, E – the elastic mod-ulus in vertical direction, n – the degree of anisotropy), δεa and δεr – are change in axial and radial strains, re-spectively, δσa and δσr – are change in axial stress and radial stress, respectively, υ1 = effect of the horizontal strain on the horizontal strain, and υ2 – the effect of the horizontal strain on the vertical strain.

Stress paths used for the model development is shown in fig. 4. Variables in the model are shown in eqs. (10)-(13). 2 1 = − p p p (10) 2 1 = − q q q (11) 1 2 m = p +2p p (12) 1 2 m = q +2q q (13)

Stepwise regression technique was chosen to determine the weight of each variable in the model. Repeated load triaxial test results were used to obtain the model and the model p q q2 qm q1 pm p1 p2

(6)

coefficients. The BMDP and SPSS software were used to determine the coefficients of each variable in the model. From stepwise regression analysis, the model of Mr, υ, n were obtained:

u m r u     =         B C p p M A p p (14) u m 1 u m 1− =              F H K u P q p D p p p υ (15) u m 2 u u m       =             N R S P q p L p p q υ (16)   =     U u p n T p (17)

where Mr is the resilient modulus, Pu – the unit pressure (1 kPa), and n – the degree of anisotropy. The new anisotropic model using eqs. (14)-(17) is:

2 2 a r 2 1 1 1 2 3      = + +       q p M n n υ υ ε (18) r 1 2 1 2 r 1 (1 ) (1 ) 3 q p nM ε =  − −υ υ − − −υ υ    (19)

The volumetric, εv, and shear, εs, strain may be written using eqs. (18) and (19):

v 1 2 1 2 r 1 (2 2 4 ) ( 1 3 )2 3   = + − − − − + −   q n p n nM ε υ υ υ υ (20) 1 2 1 r 1 ( 1 ) (1 2 ) 3 3   = − + − − −   s nM n p n q ε υ υ υ (21)

The model coefficients and regression coefficients of each coefficient are shown in tab. 1. Table 1. The model coefficients for limestone and sand and gravel

Coefficients Limestone R2 Sand and gravel R2

A 56650 0.99 42832 0.94 B 0.594 0.99 0.672 0.94 C 0.213 0.99 0.115 0.94 D 0.442 0.83 0.183 0.9 F 0.44 0.83 0.56 0.9 H 0.1 0.83 0.1 0.9 K 0.44 0.83 0.39 0.9 L 0.021 0.81 0.0064 0.8 N 0.584 0.81 0.475 0.8 R 0.084 0.81 0.41 0.8 S 0.28 0.81 0.23 0.8 T 0.039 0.91 0.039 0.99 U 0.586 0.91 0.53 0.99

(7)

Performance of the new model

The new model predictions were compared with the repeated load triaxial test results for both sand and gravel and limestone, figs. 5-8. Regression coefficients were shown on the graphics. The new model predicts the axial strain enough accurate whereas the radial strain predictions were less accurate when compared with the axial strain.

Figure 5. Axial strain predictions for

sand and gravel Figure 6. Radial strain predictions for sand and gravel

R² = 0.8196 0 50 100 150 200 250 300 350 400 450 500 0 100 200 300 400 500 Pr ed icted Measured R² = –0.968 0 50 100 150 200 250 0 50 100 150 200 250 Pr ed ic ted Measured

Figure 7. Axial strain predictions for

limestone Figure 8. Radial strain predictions for limestone

R² = 0.9882 0 100 200 300 400 500 600 700 0 100 200 300 400 500 600 700 Pr ed ic ted Measured R² = 0.8341 -150 -100 -50 0 50 100 150 200 250 -100 -50 0 50 100 150 200 250 Pr ed ic ted Measured Conclusions

Granular layers in the pavement (either base or sub-base) are compacted in vertical direction and the layer in vertical direction will be more stiffer than the horizontal direction in other words the layer is anisotropic. Different types of anisotropy exist namely inherent, stress-induced and stress-history-induced anisotropy.

In the study repeated load triaxial test equipment which able to cycle both the con-fining pressure and axial load was used to obtain inherent and stress induced anisotropy. The test results showed that if the cell pressure is high, the unbound granular material is close to isotropic behavior. However, if the cell pressure is low, the unbound granular material is more anisotropic. Using the test results with stepwise regression Mr, υ1, υ2, and n were modelled. Using Mr, υ1, υ2, and n relationships, a cross anisotropic model was proposed.

The new model is able to predict the axial strain more accurately than the radial strain. Obtained regression coefficients, R2, for the axial strain of sand and gravel and limestone are 0.8196 and 0.9882, respectively. Whereas the regression coefficients for the radial strain of sand and gravel and limestone are –0.968 and 0.8341, respectively.

Acknowledgment

The author thanks Assoc.Prof. Andrew R. Dawson for the support of the study and Jim Mooody for his help during testing.

(8)

References

[1] Casagrande, A., Carillo, N., Shear Failure of Anisotropic Materials, Harvard University, Cambridge, Massachusetts, 1944, Vol. 31 pp 74-87

[2] Biarez, J., Hicher, P.Y., Simplified Hypotheses On Mechanical Properties Equally Applicable to Sands and Clays, Proceedings, Int. Workshop on Constitutive Equations for Granular Non-Cohesive Soils, Cleveland, O., USA, 1987, pp. 19-32

[3] Arthur, J. R. F., Menzies, B. K., Inherent Anisotropy in a Sand, Geotechnique, 22 (1972), 1, pp. 115-128 [4] Ochai, H., Lade, P. V., Three Dimensional Behaviour of Sand with Anisotropic Fabric, Journal of

Geoet-echnical Engineering, ASCE, 109 (1983), 10, pp. 1313-1328

[5] Gerrard, C. M., Mulholland, P., Stress Strain and Displacement Distributions in Cross-Anisotropic and Two Layer Isotropic Elastic Systems, ARRB Proceedings, 3 (1966), 3, pp. 1123-1158

[6] Biarez, J., Wiendieck, K., La Comparasion Qualitative Entre l’anisotropie Mecanique et l’anisotropie de Structure des Millieux Pulverulents, C.R. Hebd Seance du Academie des Science, Paris, 256 (1963), pp. 1217-1220

[7] Arthur, J. R. F., et al., Induced Anisotropy in a Sand, Geotechnique, 27 (1977), 1, pp. 13-30

[8] Symes, M. J. P. R., et al., Undarined Anisotropy and Principal Stress Rotation in Saturated Sand,

Geotech-nique, 34 (1984), 1, pp. 11-27

[9] Haruyama, M., Anisotropic Deformation-Strength Characteristics of an Assembly of Spherical Particles under Three Dimensional Stresses, Soils and Foundations, 21 (1981), 4, pp. 41-55

[10] Wong, R. K. S., Arthur, J. R. F., Induced and Inherent Anisotropy in Sand, Geotechnique, 35 (1985), 4, pp. 471-481

[11] Matsuoka, H., Ishizaki, H., Deformation and Strength of Anisotropic Soil, Proceedings, 10th Int. Conf. on

Soil Mechanics and Foundation Eng., Stockholm, Sweeden, 1981, Vl. 1, pp. 699-706

[12] Morgan, J. R., Gerrard, C. M., Anisotropy and Non-Linearity in Sand Properties, Proceedings, 8th Int.

Conf. On Soil Mechanics and Foundation Eng., Moskow, 1973, Vol. 1, pp. 287-292

[13] Tutumluer, E., Seyhan, U., Laboratory Determination of Anisotropic Aggregate Resilient Moduli Using a New Innovative Test Device, Proceedings, 78th Annual Meeting of the Transportation Research Board,

National Research Council, Washington, D.C., USA, 1999, Vol. 1687, Na 1, pp. 13-21

[14] Tarefder, R. A., et al., Effects of Cross-Anisotropy and Stress Dependency of Pavement Layers on Pave-ment Responses under Dynamic Truck Loading, Journal of Rock Mechanics and Geotechnical

Engineer-ing, 8 (2016), 3, pp, 366-377

[15] Cai, Y., et al., Effect of Anisotropic Base/Interlayer on the Mechanistic Responses of Layered Pavements,

Computers and Geotechnics, 65 (2015), Apr., pp. 250-257

[16] Jing, P., et al., Effect of Anisotropy on Resilient Behaviour of a Granular Material in Low Traffic Pave-ment, Materials, 10 (2017), 12, pp, 1-16

[17] Karasahin, M., Dawson, A.R., Anisotropic Characteristics of Granular Material, Proceeding, 5th

Interna-tional Syposium on Unbound Aggregates in Roads, Nottigham, UK, 2000, pp. 139-143

[18] Karasahin, M., Resilient Behaviour of Granular Materials for Analysis of Highway Pavements, Ph. D. thesis, University of Nottingham, Nottingham, UK, 1993

Paper submitted: October 21, 2018 Paper revised: November 20, 2018 Paper accepted: January 5, 2019

© 2019 Society of Thermal Engineers of Serbia Published by the Vinča Institute of Nuclear Sciences, Belgrade, Serbia. This is an open access article distributed under the CC BY-NC-ND 4.0 terms and conditions

Şekil

Figure 2. Repeated load triaxial equipment [17]
Figure 3. (a) Sand and gravel and (b) limestone anisotropy test results [17] A cross anisotropic model
Figure 4. Stress paths in p-q space
Figure 5. Axial strain predictions for

Referanslar

Benzer Belgeler

[r]

[r]

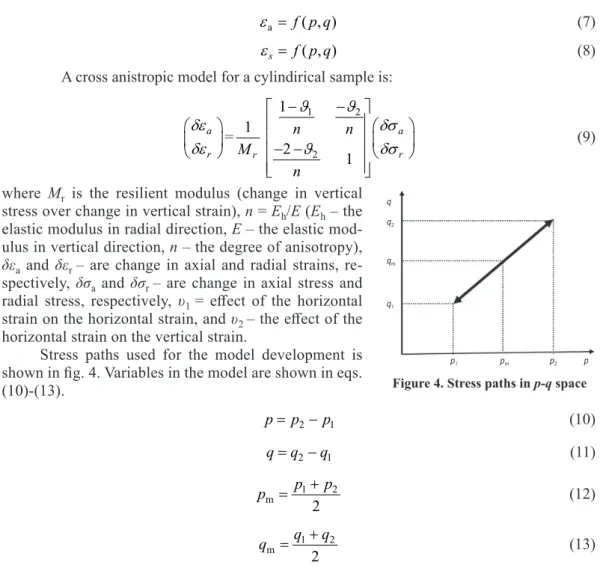
Phillip PHIRI: AN EXPERIMENTAL STUDY OF THE EFFECT OF TEMPERATURE, PRESSURE AND FLOW RATE ON MODIFIED ZADRA GOLD ELUTION PROCESS... I hereby declare that, all the information

• Operating cycle = inventory period + accounts receivable

The device consists of a compartment into which a suppository is placed and a thermostated water tank which circulates the water in this compartment.. The

In this setting, we, not only establish the subgame perfect Folk Theorem, but also prove the main result of this study, the inevitability of Nash behavior : The occurrence of any

Awaiting the Almost Inevitable 44 and constant discount factor ˆ δ ∈ (0, 1), there exists a repeated game under perfect information and stochastic discounting with a process

Tekrarlý yýkamalar sonucu deterjanlarýn pamuklu kumaþlarýn yapýsal ve boyutsal deðiþimlerine, aþýnma dayanýmlarýndaki deðiþime ve renk deðiþimine olan