TURNING POINT IN UNEMPLOYMENT
Seyfettin Gürsel
*Gökçe Uysal
∗∗and Ayşenur Acar
∗∗∗Executive Summary
Seasonally adjusted labor market data shows that non-agricultural unemployment rate increased from 11.2
percent to 11.4 percent in the period of July 2012. The slowdown in increase in non-agricultural labor force
prevents a larger increase in the non-agricultural unemployment rate. Seasonally adjusted sectoral
employment data points to employment losses in all sectors except agriculture. Employment in
manufacturing decreased by 4 thousand, while employment in construction declined by 44 thousand from
the period of June 2012 to July 2012. Service employment fell by 25 thousand. Data indicates low GDP
growth is finally taking a toll on unemployment. We observe that current GDP growth, which is lower
compared to the last year’s, has already begun to affect the labor market.
Insufficient increase in non-agricultural employment
According to the labor market statisics released by TurkStat on October 15
th(June – July – August)
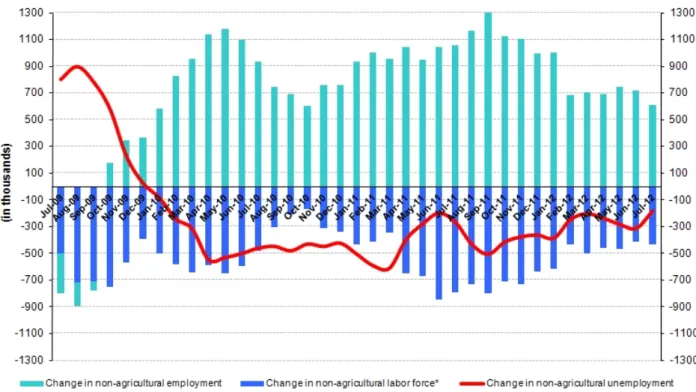
non-agricultural labor force increased by 430 thousand (2.1 percent), non-non-agricultural employment increased by
612 thousand (3.4 percent) and the number of unemployment in non-agricultural decreased by 182 thousand
on a year-on-year basis and reached 2 million 260 thousand in the period of July 2012 (Figure 1). Although
the increase in non-agricultural employment has been weak, the decrease in the number of unemployed has
been curbed by a relatively low increase in the non-agricultural labor force.
Figure 1 Year-on-year changes in non-agricultural labor force, employment and unemployment
Source: TurkStat, Betam
* Prof. Seyfettin Gürsel, Betam, Director, [email protected]
∗∗ Assoc. Prof. Gökçe Uysal, Betam, Vice Director, gokce.uysal @bahcesehir.edu.tr ∗∗∗ Ayşenur Acar, Betam, Research Assistant, [email protected]
May 15, 2012
Labor Market Outlook:
October 2012
Non-agricultural unemployment has begun to increase
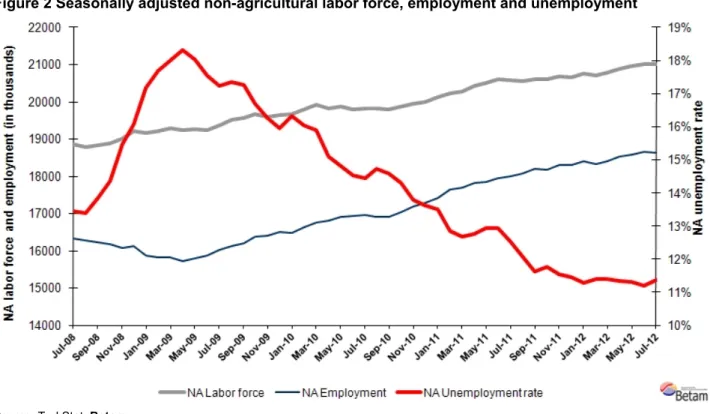
According to seasonally adjusted series, non-agricultural labor force increased only by 6 thousand from 21
million 6 thousand to 21 million 12 thousand in the period of July 2012 compared to the period of June 2012
(Figure 2, Table 1). Non-agricultural employment decreased by 29 thousand and reached 18 million 625
thousand. Consequently, the number of unemployed persons in non-agricultural sectors increased by 35
thousand and non-agricultural unemployment rate increased from 11.2 percent to 11.4 percent. Weak
increase in the non-agricultural labor force prevented a larger increase in non-agricultural unemployment.
Figure 2 Seasonally adjusted non-agricultural labor force, employment and unemployment
Source: TurkStat, Betam
According to Kariyer.net series, non-agricultural unemployment rate may increase in the
period of August 2012
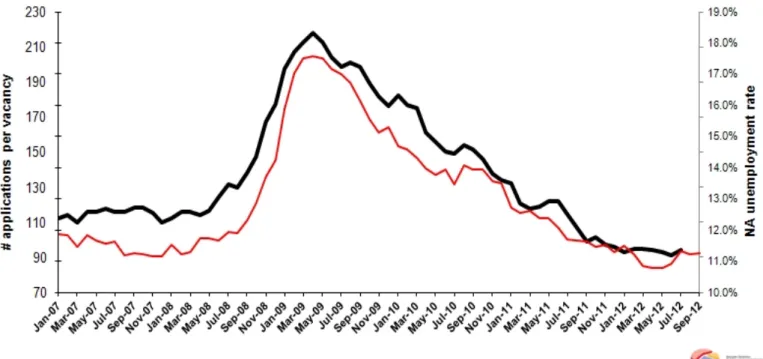
Application per vacancy calculated by using series released by Kariyer.net indicates that increase in
non-agricultural unemployment may continue in the period of August 2012 corresponding to the average of July,
August and September.
11
Betam has been calculating application per vacancy using series released by Kariyer.net for a while. Seasonal and calendar adjustment procedure is applied to application per vacancy series . A decrease in applications per vacancy may be caused by an increase in vacancies or by a decrease in the number of applications. An increase in vacancies signals economic growth while decreasing number of applications indicates a decrease in number of people looking for a job.
Figure 3 Seasonally adjusted non-agricultural unemployment rate and total vacancy cycle
Data source: Kariyer.net, TurkStat, Betam
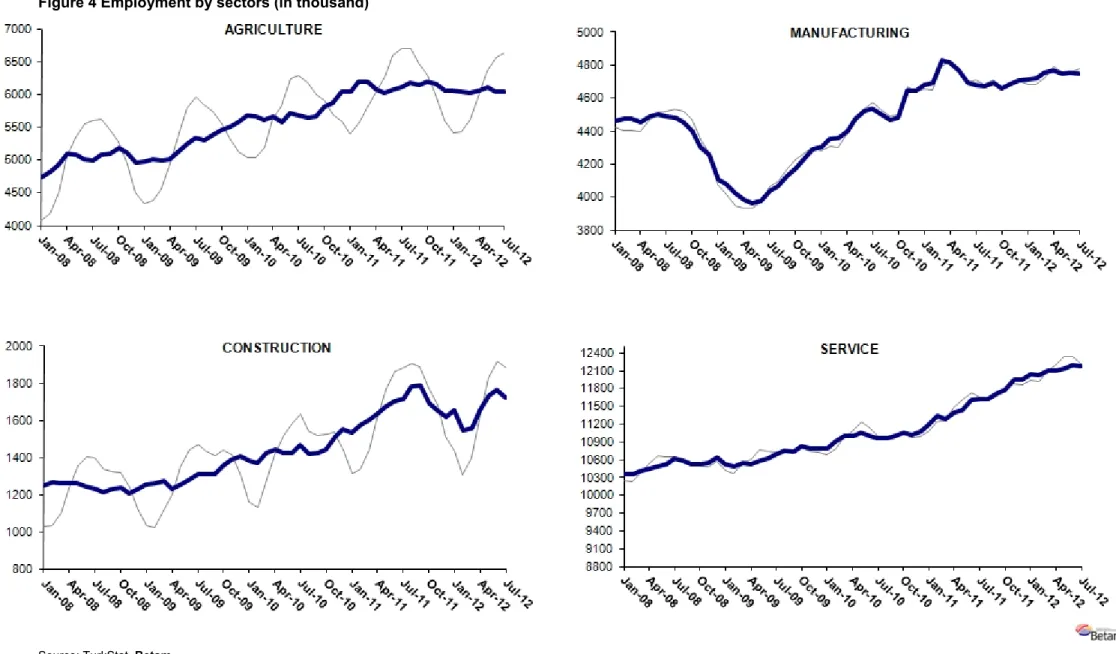
Employment losses in all sectors except agriculture
There are employment losses in all non-agricultural sectors (Table 2, Figure 4)
2. Employment in
manufacturing decreased by 4 thousand while construction employment decreased by 44 thousand. Service
employment decreased by 25 thousand. Employment loss in construction sector corresponds to 2.5 percent
although the decline in service employment with high share in the total employment may be negligible.
Stagnation in agricultural employment,which has been observed for a long time, continues in the period of
July 2012.
2 Seasonal adjustment procedure is applied to each sector of employment series separately. Hence the sum of these series may
differ from the seasonally adjusted series of total employment. The difference stems from the non-linearity of the seasonal adjustment process.
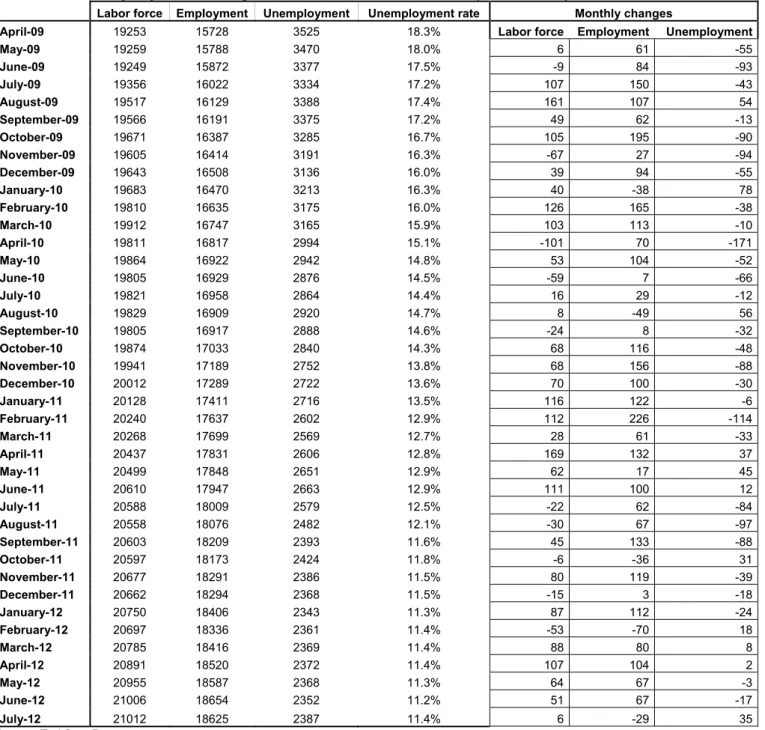
Table 1 Seasonally adjusted non-agricultural labor force indicators (in thousand)
Labor force Employment Unemployment Unemployment rate Monthly changes
April-09 19253 15728 3525 18.3% Labor force Employment Unemployment
May-09 19259 15788 3470 18.0% 6 61 -55 June-09 19249 15872 3377 17.5% -9 84 -93 July-09 19356 16022 3334 17.2% 107 150 -43 August-09 19517 16129 3388 17.4% 161 107 54 September-09 19566 16191 3375 17.2% 49 62 -13 October-09 19671 16387 3285 16.7% 105 195 -90 November-09 19605 16414 3191 16.3% -67 27 -94 December-09 19643 16508 3136 16.0% 39 94 -55 January-10 19683 16470 3213 16.3% 40 -38 78 February-10 19810 16635 3175 16.0% 126 165 -38 March-10 19912 16747 3165 15.9% 103 113 -10 April-10 19811 16817 2994 15.1% -101 70 -171 May-10 19864 16922 2942 14.8% 53 104 -52 June-10 19805 16929 2876 14.5% -59 7 -66 July-10 19821 16958 2864 14.4% 16 29 -12 August-10 19829 16909 2920 14.7% 8 -49 56 September-10 19805 16917 2888 14.6% -24 8 -32 October-10 19874 17033 2840 14.3% 68 116 -48 November-10 19941 17189 2752 13.8% 68 156 -88 December-10 20012 17289 2722 13.6% 70 100 -30 January-11 20128 17411 2716 13.5% 116 122 -6 February-11 20240 17637 2602 12.9% 112 226 -114 March-11 20268 17699 2569 12.7% 28 61 -33 April-11 20437 17831 2606 12.8% 169 132 37 May-11 20499 17848 2651 12.9% 62 17 45 June-11 20610 17947 2663 12.9% 111 100 12 July-11 20588 18009 2579 12.5% -22 62 -84 August-11 20558 18076 2482 12.1% -30 67 -97 September-11 20603 18209 2393 11.6% 45 133 -88 October-11 20597 18173 2424 11.8% -6 -36 31 November-11 20677 18291 2386 11.5% 80 119 -39 December-11 20662 18294 2368 11.5% -15 3 -18 January-12 20750 18406 2343 11.3% 87 112 -24 February-12 20697 18336 2361 11.4% -53 -70 18 March-12 20785 18416 2369 11.4% 88 80 8 April-12 20891 18520 2372 11.4% 107 104 2 May-12 20955 18587 2368 11.3% 64 67 -3 June-12 21006 18654 2352 11.2% 51 67 -17 July-12 21012 18625 2387 11.4% 6 -29 35
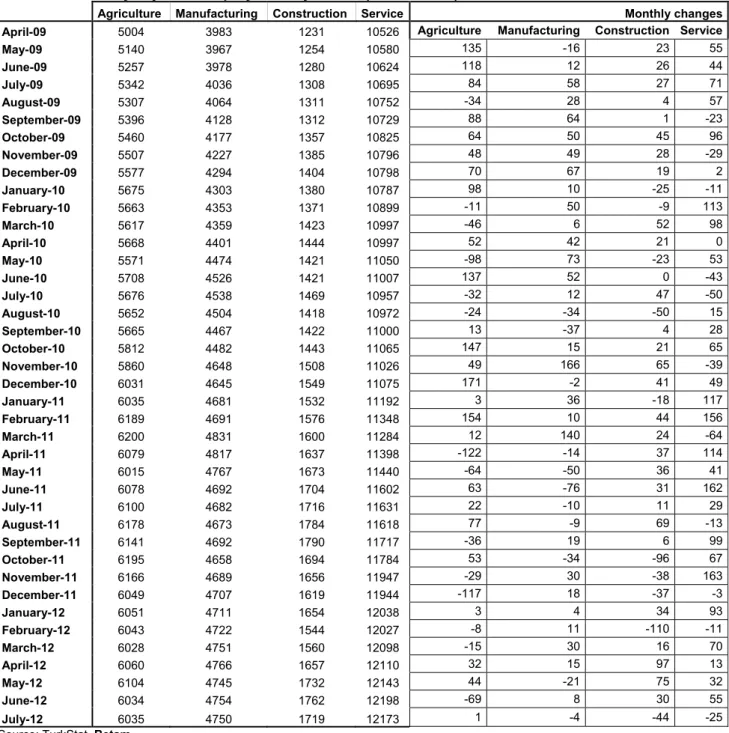
Table 2 Seasonally adjusted employment by sector (in thousand)
Agriculture Manufacturing Construction Service Monthly changes April-09 5004 3983 1231 10526 Agriculture Manufacturing Construction Service
May-09 5140 3967 1254 10580 135 -16 23 55 June-09 5257 3978 1280 10624 118 12 26 44 July-09 5342 4036 1308 10695 84 58 27 71 August-09 5307 4064 1311 10752 -34 28 4 57 September-09 5396 4128 1312 10729 88 64 1 -23 October-09 5460 4177 1357 10825 64 50 45 96 November-09 5507 4227 1385 10796 48 49 28 -29 December-09 5577 4294 1404 10798 70 67 19 2 January-10 5675 4303 1380 10787 98 10 -25 -11 February-10 5663 4353 1371 10899 -11 50 -9 113 March-10 5617 4359 1423 10997 -46 6 52 98 April-10 5668 4401 1444 10997 52 42 21 0 May-10 5571 4474 1421 11050 -98 73 -23 53 June-10 5708 4526 1421 11007 137 52 0 -43 July-10 5676 4538 1469 10957 -32 12 47 -50 August-10 5652 4504 1418 10972 -24 -34 -50 15 September-10 5665 4467 1422 11000 13 -37 4 28 October-10 5812 4482 1443 11065 147 15 21 65 November-10 5860 4648 1508 11026 49 166 65 -39 December-10 6031 4645 1549 11075 171 -2 41 49 January-11 6035 4681 1532 11192 3 36 -18 117 February-11 6189 4691 1576 11348 154 10 44 156 March-11 6200 4831 1600 11284 12 140 24 -64 April-11 6079 4817 1637 11398 -122 -14 37 114 May-11 6015 4767 1673 11440 -64 -50 36 41 June-11 6078 4692 1704 11602 63 -76 31 162 July-11 6100 4682 1716 11631 22 -10 11 29 August-11 6178 4673 1784 11618 77 -9 69 -13 September-11 6141 4692 1790 11717 -36 19 6 99 October-11 6195 4658 1694 11784 53 -34 -96 67 November-11 6166 4689 1656 11947 -29 30 -38 163 December-11 6049 4707 1619 11944 -117 18 -37 -3 January-12 6051 4711 1654 12038 3 4 34 93 February-12 6043 4722 1544 12027 -8 11 -110 -11 March-12 6028 4751 1560 12098 -15 30 16 70 April-12 6060 4766 1657 12110 32 15 97 13 May-12 6104 4745 1732 12143 44 -21 75 32 June-12 6034 4754 1762 12198 -69 8 30 55 July-12 6035 4750 1719 12173 1 -4 -44 -25
Figure 4 Employment by sectors (in thousand)
3Source: TurkStat, Betam