DECREASE IN UNEMPLOYMENT
Seyfettin Gürsel
*Gökçe Uysal
and Mine Durmaz
Abstract
Seasonally adjusted labor market data shows that compared to previous period nonagricultural unemployment rate
decreased from 12.7 to 12.5 (0.2 percentage points) in the period of December 2014. Labor market data shows
that the increase in nonagricultural employment is larger than that in nonagricultural labor force and thus,
nonagricultural unemployment decreases. Betam forecasting model based on Kariyer.net data estimates that
nonagricultural employment rate will increase slightly in the period of January 2015.
Slower increases in nonagricultural employment and labor force
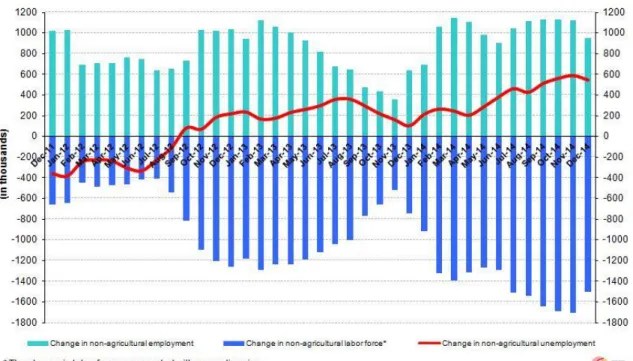
According to data released by TurkStat in the period of December 2014, nonagricultural labor force increased by 1
million 499 thousand (6.8 percent), nonagricultural employment increased by 951 thousand (4.8 percent) and
nonagricultural unemployment increased by 548 thousand compared the same period in the previous year
(Figure1).Increases in nonagricultural labor force and employment, which accelerated since second half of 2014,
slowed down in December 2014.
Figure 1 Year-on-year changes in non-agricultural labor force, employment, and unemployment
Source: TurkSTAT, Betam
Employment increased faster than labor force
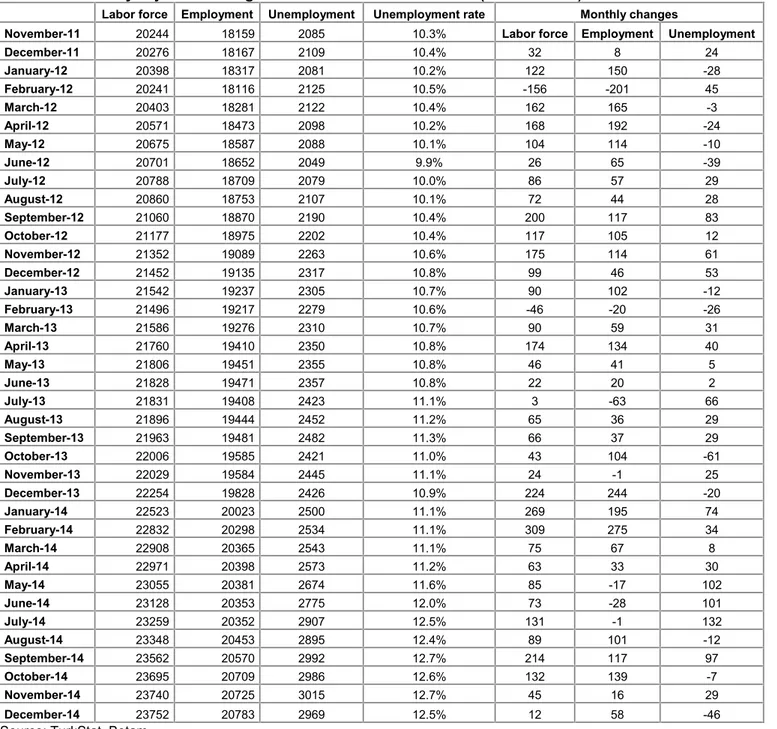
According to seasonally adjusted data thousand in the period of December 2014, nonagricultural labor force
increased by 12 thousand compared to the period of November 2014, and reached 23 million 752 thousand (Figure
2, Table 1). Nonagricultural employment increased by 58 thousand and recorded 20 million 783 thousand. Hence,
the number of persons unemployed in nonagricultural sectors increased by 46 thousand and nonagricultural
*Prof. Dr. Seyfettin Gürsel, Betam, Director,[email protected]
Yrd. Doç. Dr. Gokce Uysal, Betam, Vice Director,[email protected] Mine Durmaz, Betam, Research Assistant,[email protected]
Labor Market Outlook:
March 2015
www.betam.bahcesehir.edu.tr
2
unemployment rate in the period of December 2014 compared to the period of November 2014 decreased to 12.5
percent.
Figure 1 Seasonally adjusted non-agricultural labor force, employment, and unemployment
Source: TurkStat, Betam
Nonagricultural unemployment will increase in January 2015
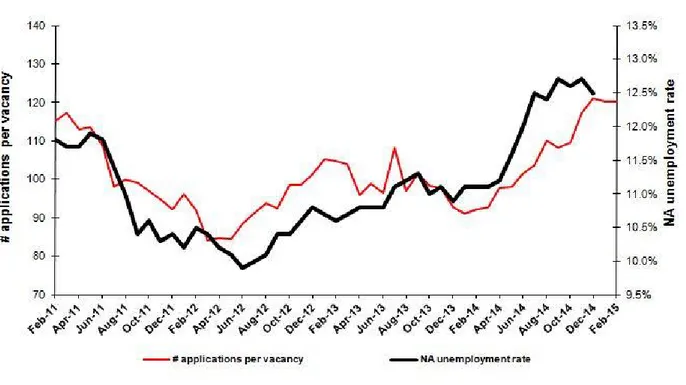
Kariyer.net's
1application per vacancy series used in the Betam forecasting model is depicted in Figure 3.
According to Kariyer.net data, applications per vacancy remained constant in the period of January 2015 (average
of December 2014, January 2015, and February 2015). Moreover, Betam's forecasting model predicts that
non-agricultural unemployment will slightly increase in the next period (January 2015).
2Figure 2 Seasonally adjusted non-agricultural unemployment rate and application per vacancy
Source: Kariyer.net, TurkStat, Betam
1 Betam has ben calculating aplication per vacancy using series released by Kariyer.net for a while. Seasonal and calendar adjustment
procedure is aplied to aplication per vacancy series. A decrease in aplications per vacancy may be caused by an increase in vacancies or by a decrease in the number of aplications. An increase in vacancies signals economic growth while decreasing number of aplications indicates a decrease in number of people loking for a job. Monthly labor market series released by TurkStat is the average of thre months. Therefore, aplication per vacancy statistics calculated using Kariyer.net series is the average of thre months as wel.
2 For detailed information on Soybilgen's forecasting model, please see Betam Research Brief 168 titled as "Kariyer.net Verisiyle Kısa Vadeli Tarım Dışı İşsizlik Tahmini"
Employment in services continues to increase
According to seasonally adjusted labor market series, employment increased in agriculture and services and
decreased in manufacturing and construction in December 2014 (Figure 4, Table2).
3Employment increased by 67
thousand and 42 thousand in services and agriculture respectively and decreased by 7 thousand in manufacturing.
Moreover, the increase in construction is limited to 1 thousand during this period. The main force behind the
decrease in unemployment is the employment expansion in services.
3Employment in each sector is seasonally adjusted separately. Hence the sum of these series may differ from the seasonally adjusted series of
total employment. The difference stems from the non-linearity of the seasonal adjustment process. .
www.betam.bahcesehir.edu.tr
4
Figure 3 Employment by sectors (in thousands)
Table 1 Seasonally adjusted non-agricultural labor force indicators (in thousands)*
Labor force Employment Unemployment Unemployment rate Monthly changes
November-11 20244 18159 2085 10.3% Labor force Employment Unemployment
December-11 20276 18167 2109 10.4% 32 8 24 January-12 20398 18317 2081 10.2% 122 150 -28 February-12 20241 18116 2125 10.5% -156 -201 45 March-12 20403 18281 2122 10.4% 162 165 -3 April-12 20571 18473 2098 10.2% 168 192 -24 May-12 20675 18587 2088 10.1% 104 114 -10 June-12 20701 18652 2049 9.9% 26 65 -39 July-12 20788 18709 2079 10.0% 86 57 29 August-12 20860 18753 2107 10.1% 72 44 28 September-12 21060 18870 2190 10.4% 200 117 83 October-12 21177 18975 2202 10.4% 117 105 12 November-12 21352 19089 2263 10.6% 175 114 61 December-12 21452 19135 2317 10.8% 99 46 53 January-13 21542 19237 2305 10.7% 90 102 -12 February-13 21496 19217 2279 10.6% -46 -20 -26 March-13 21586 19276 2310 10.7% 90 59 31 April-13 21760 19410 2350 10.8% 174 134 40 May-13 21806 19451 2355 10.8% 46 41 5 June-13 21828 19471 2357 10.8% 22 20 2 July-13 21831 19408 2423 11.1% 3 -63 66 August-13 21896 19444 2452 11.2% 65 36 29 September-13 21963 19481 2482 11.3% 66 37 29 October-13 22006 19585 2421 11.0% 43 104 -61 November-13 22029 19584 2445 11.1% 24 -1 25 December-13 22254 19828 2426 10.9% 224 244 -20 January-14 22523 20023 2500 11.1% 269 195 74 February-14 22832 20298 2534 11.1% 309 275 34 March-14 22908 20365 2543 11.1% 75 67 8 April-14 22971 20398 2573 11.2% 63 33 30 May-14 23055 20381 2674 11.6% 85 -17 102 June-14 23128 20353 2775 12.0% 73 -28 101 July-14 23259 20352 2907 12.5% 131 -1 132 August-14 23348 20453 2895 12.4% 89 101 -12 September-14 23562 20570 2992 12.7% 214 117 97 October-14 23695 20709 2986 12.6% 132 139 -7 November-14 23740 20725 3015 12.7% 45 16 29 December-14 23752 20783 2969 12.5% 12 58 -46
6
Table 2 Seasonally adjusted employment by sectors (in thousands)*
Agriculture Manufacturing Construction Service Monthly changes
November-11 5408 4870 1666 11623 Agriculture Manufacturing Construction Service
December-11 5325 4873 1633 11660 -83 3 -33 37 January-12 5330 4864 1707 11746 5 -9 74 86 February-12 5275 4808 1562 11747 -55 -56 -145 1 March-12 5221 4850 1577 11854 -54 42 15 107 April-12 5248 4930 1652 11891 27 80 75 37 May-12 5292 4908 1727 11952 44 -22 75 61 June-12 5249 4900 1749 12003 -43 -8 22 51 July-12 5260 4926 1740 12042 11 26 -9 39 August-12 5259 4892 1763 12098 -1 -34 23 56 September-12 5324 4911 1779 12180 65 19 16 82 October-12 5363 4917 1783 12276 39 6 4 96 November-12 5367 5003 1795 12290 4 86 12 14 December-12 5340 5051 1774 12310 -27 48 -21 20 January-13 5326 5073 1813 12351 -14 22 39 41 February-13 5295 5023 1803 12390 -31 -50 -10 39 March-13 5280 5083 1786 12407 -15 60 -17 17 April-13 5269 5176 1808 12427 -11 93 22 20 May-13 5207 5200 1752 12500 -62 24 -56 73 June-13 5179 5163 1786 12522 -28 -37 34 22 July-13 5195 5146 1732 12530 16 -17 -54 8 August-13 5221 5117 1751 12576 26 -29 19 46 September-13 5216 5096 1776 12609 -5 -21 25 33 October-13 5127 5090 1849 12645 -89 -6 73 36 November-13 5079 5064 1792 12729 -48 -26 -57 84 December-13 5050 5131 1892 12805 -29 67 100 76 January-14 5393 5232 1952 12839 343 101 60 34 February-14 5526 5359 2023 12916 133 127 71 77 March-14 5598 5365 1986 13014 72 6 -37 98 April-14 5563 5373 1909 13117 -35 8 -77 103 May-14 5564 5364 1860 13157 1 -9 -49 40 June-14 5489 5332 1808 13213 -75 -32 -52 56 July-14 5415 5243 1811 13298 -74 -89 3 85 August-14 5375 5257 1852 13345 -40 14 41 47 September-14 5363 5306 1871 13394 -12 49 19 49 October-14 5365 5353 1893 13464 2 47 22 70 November-14 5380 5273 1938 13514 15 -80 45 50 December-14 5422 5266 1937 13581 42 -7 -1 67