Subclinical inflammation markers
in hyperemesis gravidarum and
ketonuria: A case–control study
Ersin Çintesun, Serra Akar, Ayhan Gul, Feyza Nur Incesu Çintesun1, Gözde Sahin,
Huriye Ezveci2, Fikret Akyürek1, Çetin Çelik
Abstract:
INTRODUCTION: Subclinical inflammation markers play a significant role in hyperemesis gravidarum (HEG). Simple hematological markers such as mean platelet volume (MPV), platelet distribution width (PDW), neutrophil-to-lymphocyte ratio (NLR), red cell distribution width (RDW), plateletcrit (PCT), and platelet-to-lymphocyte ratio (PLR) have been shown to reflect inflammatory burden and disease activity in several disorders. Ketonuria is a parameter used in the diagnosis of severe HEG, but its correlation with disease severity remains controversial. The relationship of subclinical inflammation markers with degree of ketonuria has not been examined previously. In this study, we aimed to determine the diagnostic value of these subclinical inflammation markers and the relationship between these markers and grade of ketonuria in patients with HEG.
MATERIALS AND METHODS: A total of 94 pregnant women with a diagnosis of HEG and 100 gestational age-matched healthy pregnant women were enrolled in this retrospective study. MPV, PDW, NLR, PLR, PCT, and ketonuria were calculated and analyzed from complete blood cell counts and total urine analyses.
RESULTS: Lymphocyte count was significantly higher in the control group (P < 0,001); NLR and PLR values were significantly higher in the HEG group (P < 0,001). Among inflammation markers, RDW increased significantly (P = 0,008) with an increase in ketonuria in patients with HEG. A statistically significant correlation was found between white blood cell (WBC) and NLR, PLR, PCT. A moderate uphill relationship was observed between NLR and WBC and a weak uphill linear relationship was observed between WBC and PLR and between WBC and PCT
CONCLUSIONS: PLR and NLR can be considered effective markers to aid in the diagnosis of HEG. No marker was found to correlate with ketonuria grade except RDW, although the relationship of the severity of ketonuria with severity of disease is controversial. RDW increases as the degree of ketonuria increases.
Key words:
Hyperemesis gravidarum, ketonuria, subclinical inflammation
Introduction
N
ausea with or without vomiting isa common symptom in pregnancy. If the symptoms are mild, nausea in the first trimester can be considered part of
normal physiological changes in pregnancy.[1]
Hyperemesis gravidarum (HEG), which is
a severe form of nausea and vomiting in pregnancy, can cause electrolyte, fluid and acid‑base imbalance, nutrition deficiency, and loss of >5% of prepregnancy body
weight.[2] The incidence of women with
severe symptoms varies from 0.3%–3%
of pregnancies.[3] The pathophysiological
basis of HEG is controversial and a number of theories such as psychological factors, hormonal changes, abnormal gastric motility,
Address for correspondence: Dr. Ersin Çintesun, Department of Obstetrics and Gynecology, Faculty of Medicine, Selçuk University, Selcuklu, Konya, 42075, Turkey. E-mail: ersincintesun@ gmail.com Submission: 13-11-2018 Accepted: 01-03-2019 Departments of Obstetrics
and Gynecology and
2Biochemistry, Faculty
of Medicine, Selçuk University, 1Department
of Obstetrics and Gynecology, Konya Training and Research Hospital, Selçuklu, Konya, Turkey
Original Article
Access this article online
Quick Response Code:
Website:
www.jlponline.org
DOI:
10.4103/JLP.JLP_151_18
How to cite this article: Çintesun E, Akar S, Gul A, Çintesun FN, Sahin G, Ezveci H, et al. Subclinical inflammation markers in hyperemesis gravidarum and ketonuria: A case–control study. J Lab Physicians 2019;11:149-53.
This is an open access journal, and articles are distributed under the terms of the Creative Commons Attribution‑NonCommercial‑ShareAlike 4.0 License, which allows others to remix, tweak, and build upon the work non‑commercially, as long as appropriate credit is given and the new creations are licensed under the identical terms. For reprints contact: [email protected]
Helicobacter pylori infection, hepatic dysfunction, and genetic
predisposition among others have been proposed.[4,5]
The role of inflammation in the pathogenesis of HEG cannot be adequately elucidated with the current data. Significant relationships between inflammation
markers and HEG have been reported.[6‑8] In addition,
the major pro‑inflammatory cytokines (tumor necrosis factor‑alpha, interleukin‑6, etc.) were found to be elevated
in HEG patients.[6] Simple hematological markers such
as mean platelet volume (MPV), platelet distribution width (PDW), neutrophil‑to‑lymphocyte ratio (NLR), red cell distribution width (RDW), plateletcrit (PCT), and platelet‑to‑lymphocyte ratio (PLR) have been shown to reflect inflammatory burden, and disease activity in several
disorders.[9‑11] Several studies evaluating the significance of
inflammation markers in HEG have been presented.[12,13]
However, the results are conflicting and the relationship between the severity of ketonuria and subclinical inflammation has not been examined. In this study, we aimed to investigate the diagnostic value of inflammation markers and the relationship between ketonuria severity and inflammation markers in HEG patients.
Materials and Methods
This retrospective case–control study included 94 pregnant women with a diagnosis of HEG and 100 gestational age‑matched healthy pregnant women. The inclusion criteria for HEG patients were as follows: persistent nausea and vomiting, loss of >5% of prepregnancy body weight, the presence of at least one positive ketonuria test in a random urine specimen, fetal heartbeat positivity at 6–13 weeks gestation, and singleton pregnancy. The exclusion criteria for HEG patients were as follows: a history of ovulation induction, eating disorders, multiple gestations, cigarette smoking, gastrointestinal disorders, thyroid disorders, or urinary tract infections. The study was approved by the Selcuk University Ethics Committee and was conducted in accordance with the guidelines of the Helsinki Declaration.
White blood cell (WBC) count, neutrophil count (NEU), lymphocyte count (LYM), hemoglobin (Hb), platelet count (Plt), MPV, PDW, PCT, and RDW were all collected from patients’ files. The NLR and PLR were calculated by obtaining the ratios of absolute neutrophil count to absolute lymphocyte count and absolute platelet count to absolute lymphocyte count, respectively. The ketonuria grades were also collected from patients’ files. In HEG patients, ketonuria was graded as 1+, 2+, and 3+.
Statistical analysis
Statistical Package for the Social Sciences (Version 22, SPSS
Inc., Chicago, IL, USA) was used to analyze the data. Kolmogorov–Smirnov test, Shapiro–Wilk test, and histograms were used to evaluate the distribution of normality. HEG and control patients’ values were compared using Student’s t‑test and Mann–Whitney U test according to the normal distribution. Data were expressed as mean (min‑max) or median (min‑max). One‑way ANOVA and linearity test were used to test for the correlation between ketonuria degree and inflammation markers. Receiver operating characteristic (ROC) curve analysis was used to identify the optimal cut‑off values of NLR and PLR for diagnosing HEG with maximum sensitivity and specificity. Spearman correlation analysis was used for the evaluation of a possible correlation between distinct variables. P < 0.05 was considered to be statistically significant.
Results
A total of 194 patients were enrolled in the study. No statistically significant differences were observed in age, gravidity, and parity between the two groups. Other inflammation markers except for LYM, NLR, and PLR values were similar in both groups. LYM was significantly higher in the control group (P < 0.001); NLR and PLR were significantly higher in the HEG group (P < 0.001). Demographic features and values of subclinical inflammation markers in the study and control groups are summarized in Table 1.
When values of inflammation markers were analyzed according to the degree of ketonuria in the HEG group,
Table 1: Comparison of demographic features, subclinical inflammation marker values between HEG patients and controls
Hyperemesis
group (n=94) Control group (n=100) P
Age 26 (17−40) 27 (18−41) 0.248** Gravidity^ 2 (1−6) 2 (1−7) 0.955** Parity^ 0 (0−4) 1 (0−4) >0.9** Hb (g/dL) 12.4 (9−16.7) 12.1 (8.4−15.0) 0.093* Hematocrit (%) 36.7 (26.9−49.4) 36.5 (25.9−43.7) 0.466** WBC (K/uL) 9.69 (4.09−19.7) 9.83 (3.66−19.6) 0.695** NEU (×103/uL) 7.38 (2.34−17.7) 6.82 (2.02−17.05) 0.141* LYM (×103/uL) 1.71 (0.46−3.02) 2.19 (1.03−3.95) <0.001* PLT (×103/uL) 250 (135−417) 254 (142−433) 0.703** PCT (%) 0.193 (0.09−0.35) 0.20 (0.13−0.31) 0.296* PDW (%) 17.7 (16.1−21.0) 17.45 (15.4−21.6) 0.09** MPV (fL) 7.7 (5.2−11.2) 7.99 (5.7−11.7) 0.176* RDW (%) 16.27 (7.67−23.5) 15.83 (12.1−29.5) 0.223** NLR 5.35 (1−27) 3.41 (1−13) <0.001** PLR 170 (56−570) 123 (54−243) <0.001**
^Values are given as median (minimum−maximum); others given as mean (minimum−maximum), *Independent simple t-test, **Mann–Whitney U-test. Values in bold represent statistically significant outcomes. MPV = Mean platelet volume, PDW = Platelet distribution width, NLR = Neutrophil-to-lymphocyte ratio, RDW = Red cell distribution width, PCT = Plateletcrit,
PLR = Platelet-to-lymphocyte ratio, Hb = Hemoglobin, NEU = Neutrophil count, LYM = Lymphocyte count, PLT = Platelet count, WBC = White blood cell
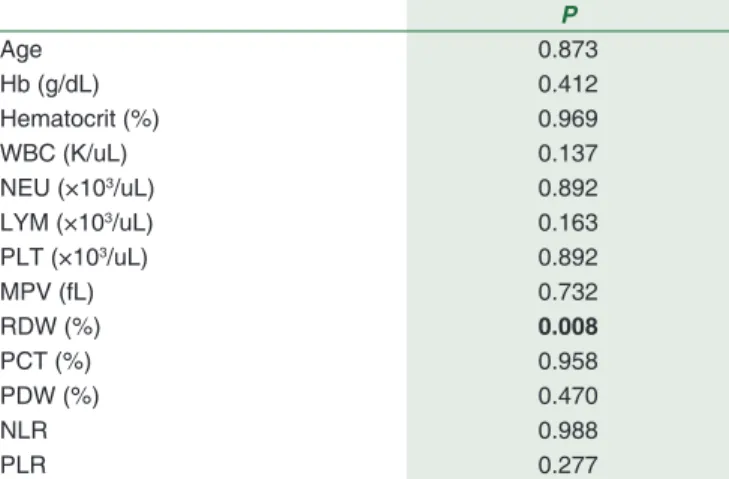
RDW was noted to increase significantly with an increase in the severity of ketonuria (P = 0.008). In addition, as the degree of ketonuria increased, PDW increased, WBC and NEU decreased, but these changes were not statistically significant. The changes in the values of inflammation markers and the variation of RDW with a degree of ketonuria in HEG patients are presented in Table 2 and Figure 1, respectively.
ROC curve analysis suggested that the optimum NLR cutoff point for diagnosis of HEG was 4.11; the sensitivity, specificity, accuracy, positive predictive value (PPV), and negative predictive value (NPV) were 52.1%, 77%, 64.94%, 66.05%, and 63.11%, respectively (AUC: 0.656). The optimum PLR cutoff point for diagnosis of HEG was 149.96; sensitivity, specificity, accuracy, PPV, and NPV were 52.1%, 77%, 64.94%, 66.05%, and 63.11%, respectively (AUC: 0.671). ROC chart for NLR and PLR is shown in Figure 2.
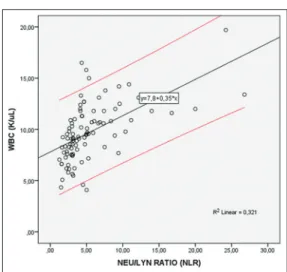
In the Spearman analysis of the correlation between inflammation markers and WBC, which is also an inflammation marker; a statistically significant correlation was found between WBC and NLR, PLR, PCT. A moderate uphill (positive) relationship was observed between NLR and WBC and a weak uphill (positive) linear relationship was observed between WBC and PLR and between WBC and PCT [Table 3 and Figure 3].
Discussion
HEG is a severe form of nausea and vomiting in pregnancy, consequently resulting in weight loss, ketonuria, and
fluid‑electrolyte and acid–base imbalance.[2] HEG may
be so severe that it necessitates hospitalization and may even progress fatally to central pontine myelinolysis and
Wernicke’s encephalopathy.[14] Therefore, early diagnosis
and treatment of severe HEG is crucial for maternal and fetal well‑being.
Figure 1: Linear variation charts of RDW. RDW: Red cell distribution width
Although the link between HEG development and inflammation is not fully understood, studies on inflammation markers in HEG patients suggested strong
Table 2: Change of inflammation marker values according to the degree of ketonuria in hyperemesis gravidarum group P Age 0.873 Hb (g/dL) 0.412 Hematocrit (%) 0.969 WBC (K/uL) 0.137 NEU (×103/uL) 0.892 LYM (×103/uL) 0.163 PLT (×103/uL) 0.892 MPV (fL) 0.732 RDW (%) 0.008 PCT (%) 0.958 PDW (%) 0.470 NLR 0.988 PLR 0.277
One-way ANOVA and test of linearity were used for the analysis. Values in bold are statistically signifi cant. MPV = Mean platelet volume, PDW = Platelet distribution width, NLR = Neutrophil-to-lymphocyte ratio, RDW = Red cell distribution width, PCT = Plateletcrit, PLR = Platelet-to-lymphocyte ratio, Hb = Hemoglobin, NEU = Neutrophil count, LYM = Lymphocyte count, PLT = Platelet count, WBC = White blood cell[6-8]
Table 3: Spearman correlation coefficients between inflammation markers and white blood cell markers in hyperemesis gravidarum patients
WBC (K/uL) (r2) WBC (K/uL) (P) NLR 0.643 <0.001 PLR 0.236 0.022 MPV 0.035 0.734 PDW −0.037 0.723 RDW 0.003 0.979 PCT 0.300 0.003
Values in bold are statistically significant. MPV = Mean platelet volume, NLR = Neutrophil-to-lymphocyte ratio, RDW = Red cell distribution width, PCT = Plateletcrit, PLR = platelet-to-lymphocyte ratio, WBC = White blood cell, PDW = Platelet distribution width
Figure 2: Receiver operating characteristic curves for neutrophil‑to‑lymphocyte ratio and platelet‑to‑lymphocyte ratio for the diagnosis of hyperemesis gravidarum
associations between them.[6‑8] Investigations showed
HEG to be related to several factors including activation of inflammatory cells and immunologic responses in which neutrophils, lymphocytes, and thrombocytes participate by
releasing inflammatory cytokines.[15] According to recent
studies, systemic inflammatory markers obtained from complete blood count in peripheral blood, such as NLR, PLR, RDW, MPV, and PCT have prognostic and predictive values in various diseases including coronary artery, inflammatory, autoimmune diseases, preeclampsia, and
gynecologic or gastrointestinal malignancies.[16‑18] Several
studies evaluating the significance of inflammation
markers in HEG have been presented.[12,13] Although the
relationship between HEG and inflammation markers has been investigated previously, our study is unique due to its inclusion of the relationship between inflammation
markers and ketonuria.[12] The results pertaining to
ketonuria from this study may lead to prospective randomized trials of ketonuria in patients with HEG and provide objective discharge criteria, which are missing in the literature and clinical practice for HEG patients. In this study, our primary goal was to assess the change in systemic inflammatory markers in patients with severe HEG. In addition, we aimed to clarify the association of ketonuria grade with systemic inflammation markers. Theoretically, increased hemoconcentration due to vomiting may be expected in patients with HEG. Sari et al.[19] found that Hb and hematocrit levels did not
change in HEG patients. These findings were similar in our study. The degree of hemoconcentration might be masked by the physiological decline in hematocrit and Hb that normally occurs in pregnancy.
Lymphocyte count tends to be higher in women with
HEG.[8] However, in some studies, no change in lymphocyte
count has been shown.[13,19] In our study, the lymphocyte
count was found to be lower in the HEG group, which was consistent with other studies from the literature.
PDW, PCT, and MPV reflect the variation of platelet volume and are thought to be markers of platelet activation. PCT is calculated by multiplying platelet
count with MPV and dividing it by 10,000.[20,21] These
parameters can be measured by full blood count analyzer
at no additional cost.[22] These markers, which indicate
platelet activation, have been used to diagnose many
inflammatory diseases.[23,24] Beyazit et al.[12] found that
PDW and MPV did not differ significantly between HEG
patients and controls. Tayfur et al.[13] found that PCT
value was significantly higher in HEG patients compared to healthy pregnant controls. In our study, PDW, PCT, and MPV values were found to be similar in both groups. The RDW shows a variation in erythrocyte volume known as anisocytosis. High RDW is believed to reflect increased inflammation and oxidative stress that alter erythrocyte homeostasis, but this mechanism is not completely
understood.[25] RDW may be elevated by inflammation,
inhibiting the production of erythropoietin, and
impairing iron metabolism.[26] Beyazit et al.[12] found
no significant difference in RDW values between HEG patients and controls and we obtained similar results. NLR and PLR are also used as inflammatory markers, and they have been studied in diseases associated
with inflammation.[9,10,27] NLR and PLR were found
significantly higher in HEG patients.[12,13] In the correlation
study performed by Beyazıt et al., no correlation was
found between NLR‑PLR and WBC.[12] In our study, NLR
and PLR were significantly higher in HEG patients. In addition, there was a statistically significant correlation between NLR‑PLR and WBC.
Ketonuria is a parameter used in the diagnosis of severe HEG, but the relationship between the severity of disease and degree of ketonuria is not clear. Several studies have examined possible associations between the severity of
the disease and the degree of ketonuria.[28‑30] Severity
was determined according to readmission rate[29] and
as a hospital stay of >4 days.[28,30] Ketonuria was not
significantly associated with prolonged hospital stay.[28]
Other studies showed no significant association between the grade of ketonuria and severity of HEG in terms of
readmission.[29,30] A study comparing patients with and
without HEG reported that the level of ketonuria was higher in the hyperemesis group and longer duration of hospitalization was associated with higher ketonuria
levels.[31] In our study, the relationship between the grade
of ketonuria and inflammation markers was examined. No significant relationship was found except for the statistically significant increase in RDW with an increase in the severity of ketonuria (P = 0.008).
Limitations of this study are its retrospective design, collection of data from a single center, and the relatively small population in both groups as well as the lack of
Figure 3: The correlation between neutrophil‑to‑lymphocyte ratio and white blood cell in hyperemesis gravidarum patients. Red lines representing the 95% confidence interval
data on patients’ iron and folic acid supplementation or blood levels.
Conclusions
PLR and NLR can be considered effective markers to aid in the diagnosis of HEG. No marker was found to correlate with degree of ketonuria except RDW, although the correlation of severity of ketonuria with severity of disease remains controversial. RDW increases with the degree of ketonuria. It is unclear whether the increase in inflammation markers is the cause or consequence of HEG. A larger‑scale, prospective clinical study should be conducted to further evaluate the diagnostic and prognostic significance of these hematological markers and ketonuria in HEG patients.
Informed consent
Informed consent was obtained from all individual participants included in the study.
Financial support and sponsorship
Nil.
Conflicts of interest
There are no conflicts of interest.
References
1. Lacasse A, Rey E, Ferreira E, Morin C, Bérard A. Nausea and vomiting of pregnancy: What about quality of life? BJOG 2008;115:1484‑93.
2. Godsey RK, Newman RB. Hyperemesis gravidarum. A comparison of single and multiple admissions. J Reprod Med 1991;36:287‑90. 3. Eliakim R, Abulafia O, Sherer DM. Hyperemesis gravidarum: A
current review. American journal of perinatology. 2000;17:207‑18. 4. Buckwalter JG, Simpson SW. Psychological factors in the etiology
and treatment of severe nausea and vomiting in pregnancy. Am J Obstet Gynecol 2002;186:S210‑4.
5. Brzana RJ, Koch KL. Gastroesophageal reflux disease presenting with intractable nausea. Ann Intern Med 1997;126:704‑7. 6. Kurt RK, Güler A, Silfeler DB, Ozçil MD, Karateke A, Hakverdi AU,
et al. Relation of inflammatory markers with both presence and
severity of hyperemesis gravidarum. Ginekol Pol 2014;85:589‑93. 7. Caglayan EK, Engin‑Ustun Y, Gocmen AY, Sarı N, Seckin L,
Kara M, et al. Is there any relationship between serum sirtuin‑1 level and neutrophil‑lymphocyte ratio in hyperemesis gravidarum? J Perinat Med 2016;44:315‑20.
8. Niemeijer MN, Grooten IJ, Vos N, Bais JM, van der Post JA, Mol BW, et al. Diagnostic markers for hyperemesis gravidarum: A systematic review and metaanalysis. Am J Obstet Gynecol 2014;211:150.e1‑15.
9. Yildirim M, Turkyilmaz E, Avsar AF. Preoperative neutrophil‑to‑lymphocyte ratio has a better predictive capacity in diagnosing tubo‑ovarian abscess. Gynecol Obstet Invest 2015;80:234‑9.
10. Torun S, Tunc BD, Suvak B, Yildiz H, Tas A, Sayilir A, et al. Assessment of neutrophil‑lymphocyte ratio in ulcerative colitis: A promising marker in predicting disease severity. Clin Res Hepatol Gastroenterol 2012;36:491‑7.
11. Aktar F, Tekin R, Bektaş MS, Güneş A, Köşker M, Ertuğrul S, et al.
Diagnostic role of inflammatory markers in pediatric Brucella arthritis. Ital J Pediatr 2016;42:3.
12. Beyazit F, Öztürk FH, Pek E, Ünsal MA. Evaluation of the hematologic system as a marker of subclinical inflammation in hyperemesis gravidarum: A case control study. Ginekol Pol 2017;88:315‑9.
13. Tayfur C, Burcu DC, Gulten O, Betul D, Tugberk G, Onur O, et al. Association between platelet to lymphocyte ratio, plateletcrit and the presence and severity of hyperemesis gravidarum. J Obstet Gynaecol Res 2017;43:498‑504.
14. Netravathi M, Sinha S, Taly AB, Bindu PS, Bharath RD. Hyperemesis‑gravidarum‑induced Wernicke’s encephalopathy: Serial clinical, electrophysiological and MR imaging observations. J Neurol Sci 2009;284:214‑6.
15. Kiyokawa Y, Yoneyama Y. Relationship between adenosine and T‑helper 1/T‑helper 2 balance in hyperemesis gravidarum. Clin Chim Acta 2006;370:137‑42.
16. Ipek S, Cekic C, Alper E, Coban E, Eliacik E, Arabul M, et al. Can red cell distribution width be a marker of disease activity in ulcerative colitis? Int J Clin Exp Med 2015;8:13848‑53.
17. Viana‑Rojas JA, Rosas‑Cabral A, Prieto‑Macías J, Terrones‑Saldívar MC, Arcos‑Noguez P, Bermúdez‑Gómez J, et al. Relation of red cell distribution width and mean platelet volume with the severity of preeclampsia. Rev Med Inst Mex Seguro Soc 2017;55:176‑81. 18. Zhao T, Cui L, Li A. The significance of RDW in patients with
hepatocellular carcinoma after radical resection. Cancer Biomark 2016;16:507‑12.
19. Sari N, Ede H, Engin‑Ustun Y, Göçmen AY, Çağlayan EK. Hyperemesis gravidarum is associated with increased maternal serum ischemia‑modified albumin. J Perinat Med 2017;45:421‑5. 20. Giacomini A, Legovini P, Gessoni G, Antico F, Valverde S,
Salvadego MM, et al. Platelet count and parameters determined by the Bayer ADVIA 120 in reference subjects and patients. Clin Lab Haematol 2001;23:181‑6.
21. Adibi P, Faghih Imani E, Talaei M, Ghanei M. Population‑based platelet reference values for an Iranian population. Int J Lab Hematol 2007;29:195‑9.
22. Sandhaus LM, Meyer P. How useful are CBC and reticulocyte reports to clinicians? Am J Clin Pathol 2002;118:787‑93.
23. Bath PM, Butterworth RJ. Platelet size: Measurement, physiology and vascular disease. Blood Coagul Fibrinolysis 1996;7:157‑61. 24. Kisacik B, Tufan A, Kalyoncu U, Karadag O, Akdogan A,
Ozturk MA, et al. Mean platelet volume (MPV) as an inflammatory marker in ankylosing spondylitis and rheumatoid arthritis. Joint Bone Spine 2008;75:291‑4.
25. Wen Y. High red blood cell distribution width is closely associated with risk of carotid artery atherosclerosis in patients with hypertension. Exp Clin Cardiol 2010;15:37‑40.
26. Weiss G. Anemia of chronic disorders: New diagnostic tools and new treatment strategies. Semin Hematol 2015;52:313‑20. 27. Dolan RD, Lim J, McSorley ST, Horgan PG, McMillan DC.
The role of the systemic inflammatory response in predicting outcomes in patients with operable cancer: Systematic review and meta‑analysis. Sci Rep 2017;7:16717.
28. Tan PC, Jacob R, Quek KF, Omar SZ. Indicators of prolonged hospital stay in hyperemesis gravidarum. Int J Gynaecol Obstet 2006;93:246‑7.
29. Tan PC, Jacob R, Quek KF, Omar SZ. Readmission risk and metabolic, biochemical, haematological and clinical indicators of severity in hyperemesis gravidarum. Aust N Z J Obstet Gynaecol 2006;46:446‑50.
30. Tan PC, Tan NC, Omar SZ. Effect of high levels of human chorionic gonadotropin and estradiol on the severity of hyperemesis gravidarum. Clin Chem Lab Med 2009;47:165‑71. 31. Derbent AU, Yanik FF, Simavli S, Atasoy L, Urün E, Kuşçu UE,
et al. First trimester maternal serum PAPP‑A and free β‑HCG levels in hyperemesis gravidarum. Prenat Diagn 2011;31:450‑3.