PREDICTION OF PROGNOSIS AND CHEMOSENSITIVITY IN
BREAST CANCER
A DISSERTATION SUBMITTED TO
THE GRADUATE SCHOOL OF ENGINEERING AND SCIENCE OF BILKENT UNIVERSITY
IN PARTIAL FULFILLMENT OF THE REQUIREMENTS FOR THE DEGREE OF
DOCTOR OF PHILOSOPHY IN
MOLECULAR BIOLOGY AND GENETICS
BY
Muhammad Waqas Akbar
September 2020
ii
PREDICTION OF PROGNOSIS AND CHEMOSENSITIVITY IN BREAST CANCER
By Muhammad Waqas Akbar September 2020
We certify that we have read this dissertation and that in our opinion it is fully adequate, in scope and in quality, as a thesis for the degree of Doctor of Philosophy.
____________________ Ali Osmay Güre (Advisor)
____________________ Işik Yuluğ
__________________ Serkan İsmail Göktuna
____________________ Burçak Vural
____________________ Sreeparna Banerjee
Approved for the Graduate School of Engineering and Science:
__________________ Ezhan Karaşan
iii
ABSTRACT
PREDICTION OF PROGNOSIS AND CHEMOSENSITIVITY IN BREAST CANCER
Muhammad Waqas Akbar
Ph.D. in Molecular Biology and Genetics Supervisor: Ali Osmay Güre
September 2020
Breast cancer (BC) is responsible for the highest mortality and morbidity out of all the cancers in women which is primarily due to both inter and intra-tumoral molecular heterogeneity. This heterogeneity arises from stemness, epithelial to mesenchymal transition and the type of treatment given to patients. These three biological processes are highly related with each other. Traditional therapy when given to breast cancer patients generally results in the transition of epithelial cells to mesenchymal phenotype. Because treatment targets primarily non-stem cells, it can leave stem cells alive which can later result in a relapse of cancer. In this study we aimed to identify such markers that could classify breast cancer patients into stem/mesenchymal or non-stem/epithelial like phenotypes, to determine how generalized the above stated hypotheses are. We developed a gene list of 15 genes we term as CSC/non-CSC gene list (CNCL) which classifies tumors into stemness and/or EMT based phenotypes and can also classify tumor cells based on their relative sensitivity to treatment with traditional therapeutics such as paclitaxel and doxorubicin. When classified into stem/mesenchymal (CS/M) and non-stem/epithelial (NS/E) phenotypes, we showed that Lapatinib and Midostaurin have a specific growth inhibitory effects on NS/E cells, and CS/M cells, respectively. Surprisingly the CNCL showed prognostic significance only for patients who were treated with paclitaxel in neo-adjuvant setting, while it could not prognosticate most other BC cohorts. We argue that this is due to the dynamic plasticity of these tumors, as studied within the third aim of this thesis.
iv
Secondly, we aimed to identify chemotherapy biomarkers for paclitaxel, cisplatin and doxorubicin to stratify patients in groups that will or will not benefit from these drugs. Using biomarkers, we selected for this purpose, we performed linear regression analysis using breast cancer cell lines to generate cytotoxicity prediction models which can predict IC50 values for these drugs, based on the expression of two genes in each model. Two models were selected for doxorubicin and cisplatin, and three models were selected for paclitaxel. All models were validated both in silico and in vitro.
Thirdly, we aimed to evaluate breast cancer plasticity that occurs upon treatment or when a tumor metastasizes. We noted that some breast tumors not only switch their clinical subtype but also change their molecular subtype upon treatment or metastasis. As breast cancer patient treatment in the routine practice is routed based on breast cancer subtype, it is very important to identify the subtype switches which can be critical for changes in treatment decisions. Additionally, we also identified metastatic biomarkers using large number of cohorts.
Lastly, as CNCL genes did not show any prognostic importance in terms of both overall survival and metastasis free survival, we checked if the same is true for melanoma. We used Melanin A (MLANA) and Inhibin (INHBA) genes as the markers for invasive/proliferative, stem/non-stem and mesenchymal/epithelial phenotypes. High INHBA expression, which is epithelial, proliferative and non-stem phenotype biomarker, was associated with poor survival and high MLANA expression, which is mesenchymal, invasive and stem phenotype marker, was associated with good prognosis in melanoma patients. Therefore, these findings in melanoma supported our results in breast cancer. Keywords: Breast cancer, Stem cell, Paclitaxel, Cisplatin, Doxorubicin, Biomarker, Metastasis, Plasticity, INHBA, MLANA
v
ÖZET
Meme Kanserinde Prognoz ve Kimyasal Duyarlılık Tahmini Muhammad Waqas Akbar
Moleküler Biyoloji ve Genetik, Doktora Tez Danışmanı: Ali Osmay Güre
Eylül 2020
Meme kanseri kadınlarda görülen en yüksek hastalık ve ölüm oranına sahip kanser tipi olup, bu durumun başlıca sebepleri tümör-içi ve tümörler arası moleküler heterojenitedir. Kök hücre özellikleri, epitel-mezenkimal geçiş (EMT) ve hastalara verilen tedaviler bu heterojeniteye sebep olabilen etkenlerdir. Bu üç biyolojik süreç birbirleriyle yüksek oranda ilişkililerdir. Bilinen geleneksel tedavi yöntemleri, hastalara uygulandığında, epitelden mezenkimal fenotipe geçişe neden olmaktadır. Uygulama öncelikle kök hücre olmayan hücreleri hedef aldığından dolayı, kök hücreleri hayatta kalmakta ve daha sonrasında hastalığın nüksetmesine neden olabilmektedirler. Yukarıda verilen hipotezlerin geçerliliklerini görmek adına, bu çalışmada meme kanseri hastalarını kök hücre/mezenkimal ve kök hücre olmayan/epitel fenotipler olarak ayırabilecek belirteçlerin tanımlanmasını amaçladık. Kanser kök hücresi/ kanser kök hücresi olmayan fenotipler şeklinde tanımlanan ve 15 genden oluşan bir gen listesi oluşturulmuştur (CNCL). Bu listenin, tümörleri kök hücre ve/veya EMT özellikli fenotipler olarak sınıflandırabildiği, ve aynı zamanda tümör hücrelerini paklitaksel ve doksorubisin gibi geleneksel ilaç uygulamalarına karşı gösterdikleri göreceli hassasiyetler ölçütünde ayırt edebildiği görülmüştür. Hücre hatları kök hücre/mezenkimal (CS/M) ve kök hücre olmayan/epitel (NS/E) fenotiplere göre sınıflandırıldığında, sırasıyla Lapatinib’in NS/E hücreleri üzerinde ve Midostaurin’in CS/M hücreleri üzerinde spesifik büyüme inhibisyonu sağladıklarını bulguladık. Şaşırtıcı bir şekilde, CNCL’in prognoz ile istatistiksel olarak anlamlı ilişkisi sadece Paklitaksel temelli neo-adjuvant tedavisi alan hastalar için geçerliyken, geriye kalan birçok meme kanseri kohortu CNCL ile prognoz edilememiştir. Bu tezin üçüncü amacında
vi
da değinildiği üzere, bu durumun ilgili tümörlerin dinamik plastisitelerinden kaynaklandığına inanıyoruz.
İkincil olarak, paklitaksel, sisplatin ve doksorubisin ilaçları ile tedavi gören hastaların tedavi yanıtılarının tahmin edilmesine yarayabilecek kemoterapi biyobelirteçlerinin tespitleri hedeflenmiştir. Meme kanseri hücre hatlarında bu doğrultuda seçtiğimiz belirteçler kullanılarak, yapılan doğrusal regresyon (linear regression) analizi ile ilaçların IC50 değerlerini 2 genin ifadesine bağlı olarak tahmin edebilen bir sitotoksisite tahmin modeli oluşturulmuştur. doksorubisin ve cisplatin için 2 model, paklitaksel için ise 3 model seçilmiştir. Modellerin tamamı in siliko ve in vitro olarak doğrulanmıştır.
Üçüncü olarak meme kanseri plastisitesinin tedavi sonrası ve tümör metastazı gerçekleşmesi durumlarında değerlendirilmesi amaçlanmıştır. Tedavi ve metastaz sonrası bazı meme tümörlerinin klinik alt türlerini değiştirmelerinin yanı sıra moleküler alt türlerini de değiştirebildikleri gösterilmiştir. Rutin pratikte meme kanseri tedavisi meme kanseri alt türlerine göre yönlendirildiğinden, tedavi kararlarındaki değişiklikler için kritik öneme sahip olabilecek alt tür geçişlerinin tespiti bir hayli önem arz etmektedir. Ek olarak, yüksek sayıda hasta kohortu kullanılarak metastatik biyobelirteçler de tanımlanmıştır.
Son olarak, çalışmamızda CNCL gen listesinin genel sağkalım ve metastazsız sağkalım açısından prognoztik bir önemi olmadığı görüldüğünden, benzer bir çalışma melanom için tekrarlanmıştır. Melanin A (MLANA) ve Inhibin (INHBA) genleri invazif/proliferatif, kök hücre/kök hücre olmayan ve mezenkimal/epitel fenotipler için belirteç olarak kullanılmıştır. Melanom hastalarında epitel, proliferatif ve kök hücre olmayan fenotip biyobelirteci INHBA’nin yüksek ifadesi kötü prognoz ile ilişkili iken, mezenkimal, invazif ve kök hücre fenotipi belirteci olan MLANA’in yüksek ifadesi iyi prognoz ile ilişki göstermiştir. Bu sebepten dolayı, melanomdaki bulgularımız meme kanserinde elde ettiğimiz sonuçları desteklemektedir.
Anahtar sözcükler: Meme kanseri, Kök hücre, Paklitaksel, Sisplatin, Doksorubisin, Biyobelirteç, Metastaz, Plastisite, INHBA, MLANA
vii
Acknowledgements
All praises and thanks to Almighty Allah; the ultimate source of all knowledge to mankind and for His endless blessings for humanity
It gives me extreme pleasure to express my deepest gratitude to my indulgent mentor Assoc. Prof. Dr. Ali Osmay Güre without whose guidance and support, I couldn’t overcome all the challenges to pursue this dream. He is always generous to share his philosophy, creative ideas and reasoning with us both in and out of the lab. I am very grateful to him for his kind valuable guidance and ever willing support throughout my stay in Turkey. He always inspired me to explore critical questions and conduct quality research through thick and thin. It is an honor and privilege to be a part of his inventive team. Secondly, I owe my profound regards to Assoc. Prof. Dr. Özgür Şahin, Assoc. Prof. Ozlen Konu, Assoc. Prof. Dr. Işik Yuluğ, Assist. Prof. Serkan Ismail Göktuna, Prof. Dr. Burçak Vural and Prof. Sreeparna Banerjee for their valuable counsel and insights for the preparation of this thesis.
I would like to extend heartiest thanks to all current and previous members of AOG Lab as each one of them is very special to me. Murat İşbilen’s sincerity, Can and Seyhan Turk’s compassion, Kerem Mert Şenses’ guidance, Seçil Demirkol Canli’s kindness, Barış Küçükkaraduman’s benevolence, Abbas Güven Akçay’s perceptiveness, Alper Poyraz’s resourcefulness, Şükrü Atakan’s inquisitiveness and Ege Dedeoğlu’s liveliness was the dearest to me. I am also grateful to our relatively new group members Shila Azizolli, Marzana Ishraq, Isli Cela, Farid Ahadli and Farid Sadati for their help and support. I would like to express my profound appreciation for the trustworthiness, good will and loyality shown to me by Adem Demir. I am sincerely thankful to OŞ lab especially Unal Tokat, Pelin Ersan, Oğuzhan Tarman and Nevin Belder. I am also thankful to Murat Yaman and Seniye Targen for their help and sympathy.
Among my Pakistani peers, I am very grateful to Mr. and Mrs. Naveed Mehmood, Mr. and Mrs. Talha Masood and Muhammad Zakwan.
I gratefully acknowledge the funding received from the Scientific and Technological Research Council of Turkey (TUBITAK) under Grant 117S058 and Higher Education Commission, Pakistan.
Last but not least, I admit that I owe all my achievements to my sincere and most loving parents and my sisters, whose prayers and motivational support always remained a source of determination for me.
viii
ix
Table of Contents
1. Introduction ...1
1.1. Breast cancer and its classification ...1
1.2. Breast cancer stem cells ...1
1.2.1. Breast CSCs markers ...2
1.2.2. Cancer stem cells and epithelial to mesenchymal transition ...2
1.2.3. Role of biological pathways and associated factors in breast cancer stemness .3 1.2.4. CSCs resistance to therapy ...4
1.2.5. Presence of CSC in breast cancer cell lines ...5
1.2.6. CSCs enrichment in vitro ...5
1.3. Chemotherapy in BC ...6
1.3.1. Paclitaxel ...7
1.3.2. Doxorubicin ...8
1.3.3. Cisplatin ...9
1.4. Breast cancer plasticity ... 10
1.5. Metastatic biomarkers for BC ... 12
1.6. Role of MLANA and INHBA in Melanoma ... 15
2. Aim of the study ... 17
3. Materials... 19
3.1. General laboratory reagents ... 19
3.2. General laboratory equipment... 19
3.3. Cell culture reagents ... 20
3.4. Cell culture media and solutions ... 20
4. Methods ... 22
4.1. Cell culture conditions ... 22
4.2. Culturing cryopreserved cells ... 22
4.3. Cell culture ... 22
4.4. Cell cryopreservation ... 22
4.5. Mammosphere culture (3D cell culture)... 23
4.6. RNA extraction ... 23
4.7. DNAse treatment ... 24
x
4.9. cDNA synthesis... 24
4.10. End point polymerase chain reaction ... 25
4.11. Agarose gel electrophoresis ... 25
4.12. Quantitative Real time Polymerase Chain Reaction (qRT-PCR) ... 26
4.13. Drug cytotoxicity ... 26
4.14. siRNA Knockdown and Cell viability ... 26
4.15. In silico analyses ... 27
4.16. Statistical analysis ... 27
5. Results ... 29
5.1. Classification of breast cancer based on stemness and EMT ... 29
5.1.1. Robustness of the CSC/non-CSC gene list (CNCL) classification ... 29
5.1.2. Altered Molecular Mechanisms as indicated by differentially expressed genes between CSC and non-CSC like cell lines... 32
5.1.3. CNCL can identify stemness in silico ... 35
5.1.4. CNCL can identify EMT in silico ... 41
5.1.5. CNCL can predict drug sensitivity in silico ... 44
5.1.6. Stemness score (SS) based quantitative analyses ... 47
5.1.7. CNCL validation in vitro ... 51
5.1.8. Prognostic significance of CNCL ... 56
5.2. Chemosensitivity markers of paclitaxel, cisplatin and doxorubicin in breast cancer ... 59
5.2.1. Paclitaxel biomarkers ... 61
5.2.2. Cisplatin biomarkers ... 65
5.2.3. Doxorubicin biomarkers... 67
5.3. Breast cancer plasticity ... 71
5.3.1. PAM50 plasticity ... 71
5.4. Metastatic biomarkers ... 76
5.4.1. Prognostic importance of hematopoietic cells for metastasis ... 79
5.5. Prognostic importance of INHBA and MLANA in melanoma ... 82
6. Discussion ... 94
6.1. CNCL based classification of breast cancer into stemness and EMT subtypes ... 94
xi
6.3. Chemosensitivity markers of paclitaxel, cisplatin and doxorubicin in breast cancer
... 98
6.3.1. Paclitaxel biomarkers ... 99
6.3.2. Cisplatin Biomarkers ... 100
6.3.3. Doxorubicin Biomarkers ... 101
6.4. Biomarkers for metastasis... 102
6.4.1. Good prognostic genes ... 102
6.4.2. Bad prognostic genes ... 106
6.4.3. Prognostic importance of hematopoietic cells for metastasis ... 108
6.5. Prognostic importance of INHBA and MLANA in melanoma ... 110
7. Future Perspectives ... 112
7.1. Classification of Breast cancer based upon stemness and EMT ... 112
7.2. Chemosensitivity markers of paclitaxel, doxorubicin and cisplatin in breast cancer ... 113
7.3. Breast cancer plasticity ... 113
7.4. Biomarkers for metastasis and the role of hematopoietic cells in metastasis ... 114
7.5. Role of INHBA and MLANA in melanoma ... 115
8. References ... 116
9. Appendix ... 137
xii List of Figures
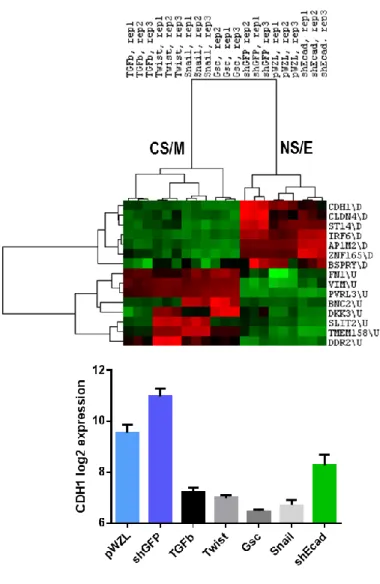
Figure 5.1: E cadherin (CDH1) expression difference between CSC and non-CSC like
clusters. ... 35
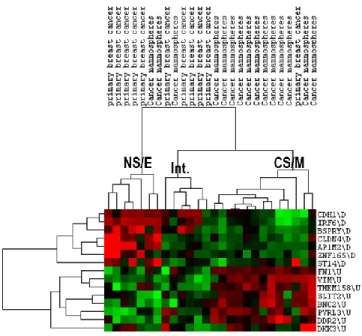
Figure 5.2: CNCL clustering in dataset GSE36643. ... 39
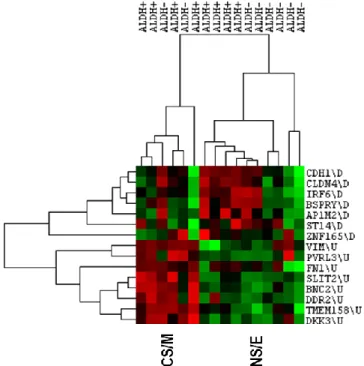
Figure 5.3. Clustering of primary breast cancer cells sorted by ALDH1 expression with CNCL. ... 41
Figure 5.4: CNCL clustering in dataset GSE9691. ... 42
Figure 5.5: CNCL clustering in dataset GSE24202. ... 43
Figure 5.6: CNCL clustering in dataset GSE7515. ... 44
Figure 5.7: CNCL clustering in GSE24460. ... 45
Figure 5.8: CNCL clustering in GSE10281. CNCL clustered the majority of pre letrozole treated samples as NS/E and post treated samples as CS/M. ... 46
Figure 5.9: Stemness score-based clustering in dataset GSE12791. ... 49
Figure 5.10: Stemness score-based clustering in dataset GSE23399. ... 49
Figure 5.11: Stemness score-based clustering in dataset GSE16179. ... 50
Figure 5.12: Delta(r) based analysis in GSE28844. ... 51
Figure 5.13: Midostaurin shows preferential cytotoxicity for CS/M cell lines and Lapatinib shows preferential cytotoxicity to NS/E cell lines. ... 53
Figure 5.14: Spheroid cytotoxicity alteration due to phenotypic switch. MDA-MB-157 showed increased sensitivity to Midostaurin and resistance to Lapatinib upon spheroid generation. ... 54
Figure 5.15: SiZEB1 and SiSNAI2 knockdown efficiency in MDA-MB-157 cell line.... 55
Figure 5.16: ZEB1 and SNAI2 knockdown resulted in increased sensitivity to Lapatinib and resistance to Midostaurin in MDA-MB-157 cell line as expected. ... 55
Figure 5.17: Survival analysis of GSE25066. ... 58
Figure 5.18: Delta (r) based distribution of breast cancer patients in molecular subtypes in GSE25066. ... 58
Figure 5.19: Paclitaxel, cisplatin and doxorubicin cytotoxicity data in vitro. ... 60
Figure 5.20: Paclitaxel, cisplatin and doxorubicin cytotoxicity data in silico. ... 61
Figure 5.21: Pearson correlation analysis between paclitaxel predicted IC50 and in vitro cytotoxicity data for selected 3 models. ... 62
Figure 5.22: Validation of 3 paclitaxel models in dataset GSE12791... 63
Figure 5.23: Validation of 3 paclitaxel models in dataset GSE23399... 64
Figure 5.24: Validation of 3 paclitaxel models in dataset GSE28784... 64
Figure 5.25: Validation of 2 cisplatin models with in vitro cisplatin cytotoxicity data. ... 66
Figure 5.26: Validation of 2 cisplatin models in dataset GSE28274. ... 66
Figure 5.27: Validation of 2 doxorubicin models with in vitro cytotoxicity data. ... 68
Figure 5.28: Validation of 2 doxorubicin models in dataset GSE13477. ... 68
Figure 5.29: Validation of 2 doxorubicin models in dataset GSE24460. ... 69
Figure 5.30: Validation of 2 doxorubicin models in dataset GSE72362. ... 70
Figure 5.31: Validation of 2 doxorubicin models in dataset GSE3929. ... 70
xiii
Figure 5.33: Prognostic evaluation of INHBA in TCGA cohort. ... 84 Figure 5.34: Prognostic evaluation of MLANA in TCGA cohort. ... 84 Figure 5.35: Prognostic evaluation of INHBA in GSE65904 cohort for distant metastasis free survival data. ... 87 Figure 5.36: Prognostic evaluation of MLANA in GSE65904 cohort for distant metastasis free survival data. ... 87 Figure 5.37: Prognostic evaluation of INHBA in GSE65904 cohort for disease specific survival data. ... 89 Figure 5.38: Prognostic evaluation of MLANA in GSE65904 cohort for disease specific survival data. ... 89 Figure 5.39: Prognostic evaluation of MLANA in GSE59455 cohort for overall survival data... 91 Figure 5.40: Prognostic evaluation of MLANA in GSE54467 cohort for overall survival data... 93
xiv List of Tables
Table 3.1: General laboratory reagents and vendors ... 19
Table 3.2: Cell culture media and reagents ... 20
Table 5.1: CSC/non-CSC gene list (CNCL) ... 29
Table 5.2: CNCL classification robustness across different datasets and platforms. N/A shows that the cell line was not present in that dataset... 30
Table 5.3: Gene sets upregulated in CSC like (CS/M) cell lines ... 33
Table 5.4: Gene sets upregulated in Non-CSC like (NS/E) cell lines. ... 34
Table 5.5: Differential expression of CD44, CD24 and ALDH in CS/M and NS/E groups ... 36
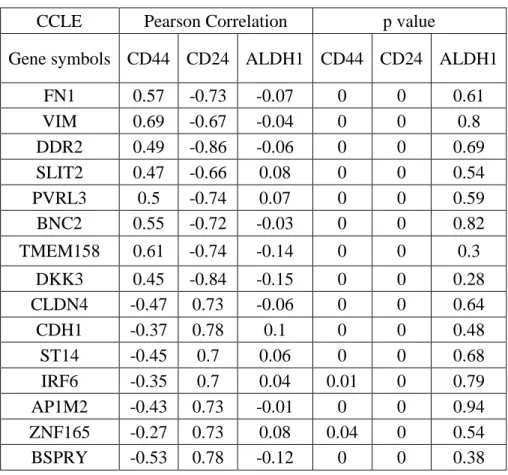
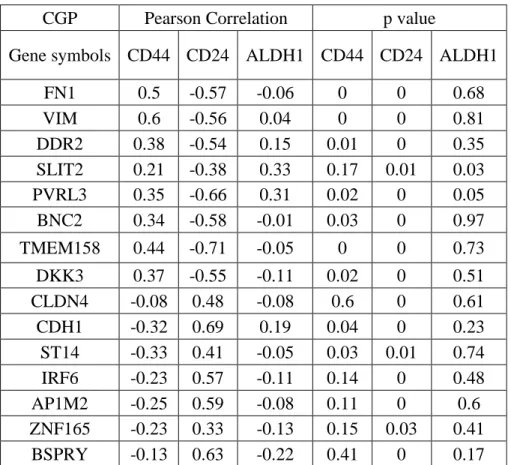
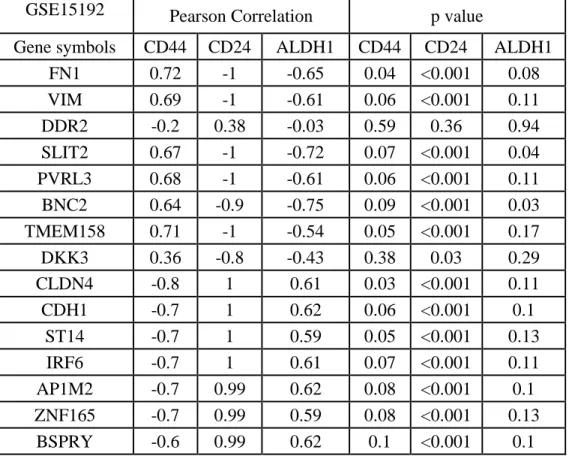
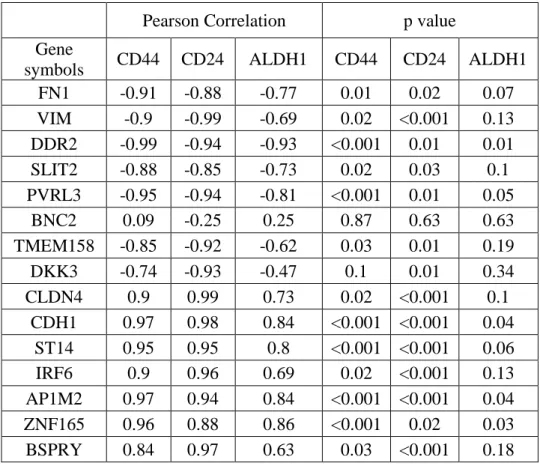
Table 5.6: CNCL genes showed a significant correlation pattern with CD44, CD24 and ALDH in CCLE and CGP datasets. ... 36
Table 5.7: CD44 and CD24 correlation with ALDH in CCLE and CGP datasets. ... 37
Table 5.8: CNCL genes correlation with CD44, CD24 and ALDH1. ... 38
Table 5.9: Pearson correlation analysis between CNCL genes and stemness genes (CD44 and CD24) ... 40
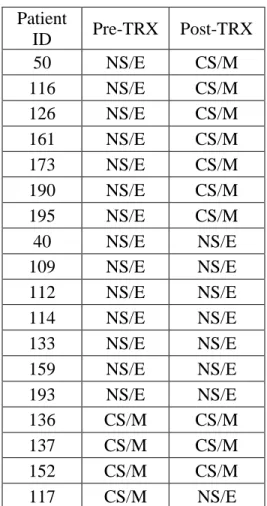
Table 5.10: Phenotype comparison of matched tumor samples pre and post treatment with letrozole... 47
Table 5.11: CNCL stemness reference matrix ... 48
Table 5.12: qPCR data was highly concordant with CCLE gene expression data... 52
Table 5.13: CNCL genes showed a strong intergenic correlation pattern as expected. .... 52
Table 5.14: Prognostic evaluation of 16 breast cancer cohorts based upon SS. ... 57
Table 5.15: Multivariate analysis of SS delta (r) with clinical parameters such as T stage, N stage and breast cancer molecular subtypes, showed SS delta (r) as a significant independent prognostic marker. ... 59
Table 5.16: Linear regression cytotoxicity models of paclitaxel. ... 62
Table 5.17: Linear regression cytotoxicity models of cisplatin. ... 65
Table 5.18: Linear regression cytotoxicity models of doxorubicin... 67
Table 5.19: Comparison of PAM50 subtyping for samples collected through fine needle aspiration and core needle biopsy (GSE32518). ... 72
Table 5.20: Comparison of PAM50 subtypes pre- and post-Letrozole therapy (GSE10281)... 73
Table 5.21: Comparison of PAM50 subtypes pre- and post-Anthracyclines and Taxanes based neoadjuvant chemotherapy (GSE28844). ... 73
Table 5.22: Comparison of PAM50 subtypes pre- and post- neoadjuvant chemotherapy (GSE32072)... 74
Table 5.23: Comparison of PAM50 subtyping for primary tissues vs. brain metastatic tissues (GSE125989). ... 74
Table 5.24: Comparison of PAM50 subtyping for primary tissues vs. metastatic tissues (GSE110590). ... 76
Table 5.25: Patient number and treatment protocols for cohorts used for metastasis biomarker analysis. ... 77
xv
Table 5.26: Hazard ratios (HR) of hematopoietic cells for metastasis free survival. Cells highlighted in green show good prognosis and red shows bad prognosis. Cells with thick borders show HR with significant Cox p value... 80 Table 5.27: Cox regression p values for Hazard ratios in Table 5.26. ... 81 Table 5.28: Cox regression analysis for INHBA, MLANA and clinical parameters. ... 83 Table 5.29: Patient distribution, median survival and Log rank p value for INHBA and MLANA classifications. ... 84 Table 5.30: Multivariate analysis for TCGA with parameters significant with univariate analysis... 85 Table 5.31: Cox regression analysis for INHBA and MLANA for GSE65904 DMFS .... 86 Table 5.32: Patient distribution, median survival and Log rank p value for INHBA and MLANA classifications in GSE65294 DMFS. ... 88 Table 5.33: Cox regression analysis for INHBA and MLANA for GSE65904 DSS ... 88 Table 5.34: Patient distribution, median survival and Log rank p value for INHBA and MLANA classifications in GSE65904 DSS. ... 90 Table 5.35: Cox regression analysis for INHBA, MLANA, BRAF mutation, NRAS mutation, and Berslow depth in dataset GSE59455. ... 90 Table 5.36: Patient distribution, median survival and Log rank p value for MLANA classifications in GSE59455 OS... 91 Table 5.37: Multivariate analysis for MLANA classification and Berslow depth in dataset GSE59455. ... 92 Table 5.38: Cox regression analysis for MLANA in GSE54467 ... 92 Table 5.39: Patient distribution, median survival and Log rank p value for MLANA classifications in GSE54467 OS. ... 93 Table 9.1: Datasets used for validation of CNCL gene list. ... 137 Table 9.2: Datasets used in prognostic evaluation for CNCL gene list ... 141
xvi Abbreviations
BC Breast Cancer
CSC Cancer Stem Cells
CNSC Cancer Non-Stem Cells
FACS Fluorescence-activated Cell Sorting
EMT Epithelial to Mesenchymal Transition
MET Mesenchymal to Epithelial Transition
LumA Luminal A
LumB Luminal B
CNCL CSC/non-CSC gene list
CS/M Cancer Stem/Mesenchymal Phenotype
NS/E Non Stem/Epithelial Phenotype
NA Not available
TNBC Triple Negative Breast Cancer
1
1. Introduction 1.1. Breast cancer and its classification
Breast cancer (BC) is one of the cancers responsible for the highest mortality and morbidity in women. According to cancer statistics 2019 in the USA only, new estimated cases for breast cancer were the highest among all cancer patients (271270 cases). Similarly, for BC, mortality was estimated to be the second highest after lung cancer in women (41760 deaths in women) (Siegel et al., 2019). BC is a heterogeneous disease and is clinically classified based upon immunohistochemistry expression of estrogen receptor (ER), Progesterone receptor (PR) and human epidermal growth factor receptor (HER2, also known as ERBB2) expression. For both ER and PR, nuclear staining positive for >1% tumor cells, is considered positive by the American Society of Clinical Oncology (ASCO) but some countries such as France recommend 10% as the cutoff for these receptors. Additionally, by recommendations of ASCO, HER2 status is confirmed via two techniques at least and for this purpose approaches like immunohistochemistry (IHC), fluorescent in situ Hybridization and chromogenic in situ hybridization is used. Immunohistochemistry is the most preferred choice worldwide and 10% staining is used as the cutoff for HER2 staining (Harbeck et al., 2019). Moreover, BC is also molecularly classified into Luminal A (LumA), Luminal B (LumB), HER2 enriched (HER2), Basal and Normal like types. This molecular classification is being widely used and is known as PAM50 (van 't Veer et al., 2002; Parker et al., 2009). Apart from these classifications, BC can also be divided into cancer stem cells (CSC) and cancer non-stem cells (CNSC) which further shows the extremely heterogeneous nature of breast cancer (Hii et al., 2020).
1.2. Breast cancer stem cells
BC is thought to develop through the random accumulation of the right combinations of mutations in breast cancer cells. However, BC research has extensively supported the cancer stem cell hypothesis indicating two different kinds of populations which are CSC and CNSC to be present in tumors (Kakarla et al., 2012). There are two proposed models through which breast cancer stem cells are generated. The first model is hierarchical cancer stem cell model which states that CSCs are generated through cancerous transformation of
2
normal breast stem cells or early progenitor cells, and after transformation, these cells differentiate into CNSCs. Additionally, CNSCs are also generated through transformation of normal differentiated breast cells. The second model states that NCSCs generate CSCs when undergoing de-differentiation (Butti et al., 2019). Breast CSCs were first reported by Al hajj et al. in 2003. The authors identified cells that were CD44+/CD24-. These cells were sorted through fluorescence-activated cell sorting (FACS) and when as low as 200 cells were injected in NOD/SCID mice, highly aggressive tumors were generated. While injections of other cells which were CD24+, did not develop any tumors even at high
numbers such as 20000 cells (Al-Hajj et al., 2003). The phenomenon of CSCs self-renewal along with the capability to differentiate, through which they generate phenotypically heterogeneous CNSCs, is known as asymmetrical division. Additionally, CSCs are considered highly important due to their significant role in malignancy, metastasis and relapse of BC (Velasco-Velázquez et al., 2012).
1.2.1. Breast CSCs markers
In breast cancer research, due to the heterogeneous nature of BC, many different markers have been used to identify and sort CSCs from CNSCs. The most accepted markers among these are CD44+/CD24- which were first described by Al-hajj et al (Al-Hajj et al., 2003). Others markers used for CSC identification include ALDH1, CD90, CD38, ABCB5, CD34, CD49f, GD2 (Chen et al., 2013a), CD133, EpCAM, PKH, CD271 and ANTXR1 (Battula et al., 2012; Vieira et al., 2012; Liu et al., 2014a; Islam et al., 2015; Zhao et al., 2017). These markers are used either individually or in combination with each other in breast cancer stem biology studies. The most important technique to sort CSCs from CNSCs is FACS. Other techniques used to characterize CSCs include RT-qPCR, IHC, and Magnetic-Activated Cell Sorting (MACS)(Islam et al., 2015).
1.2.2. Cancer stem cells and epithelial to mesenchymal transition
Epithelial to mesenchymal transition (EMT), as the name indicates, is the process through which cells with epithelial properties are transformed into mesenchymal cells. This phenomenon is of high importance as it plays a crucial part in embryogenesis and developmental biology. Additionally, the phenomenon where mesenchymal cells
3
transform into epithelial cells is termed as mesenchymal to epithelial transition (MET). Both EMT and MET play an important role in breast cancer development and metastasis. These phenotypes naturally co-exist as well in breast cancer tumors (Takebe et al., 2011). Importantly it has been reported that both CSCs and mesenchymal cancer cells generated through EMT show similar characteristics. These characteristics include the capability of tumor generation from minimal cells, resistance to chemotherapy and radiotherapy among other treatments, immunity to apoptosis, metastasis generation, migration and loss of differentiation (Floor et al., 2011). Interestingly ectopic expression of mesenchymal markers such as TWIST and SNAIL generates cells that also express stem cell markers such as CD44+/CD24-. Moreover, these cells upon proliferation generate both CSCs and CNSCs (Mani et al., 2008). Similarly, breast tumors with mesenchymal phenotype express stem cell markers as well both in mouse and human patients (Puisieux et al., 2014). Another important common mechanism expressed by both stem and mesenchymal cells is resistance to anoikis. Epithelial cells rely on interactions between cell and matrix for their survival and if these cells are grown in suspension where no anchorage is available, this results in programmed cell death termed as anoikis. To survive, these cells undergo EMT and develop a mesenchymal phenotype that is resistant to anoikis. Interestingly similar to mesenchymal cells, stem cells are also resistant to anoikis. Additionally, resistance to anoikis is necessary for metastasis (Frisch et al., 2013). These shared similarities between mesenchymal cancer cells and stem cells lead to conclusion that both processes might be induced and regulated by related biological pathways.
1.2.3. Role of biological pathways and associated factors in breast cancer stemness Various signaling pathways such as Notch, Wnt, Hedgehog (Hh) and Hippo pathways show alterations in breast CSCs and manage the survival and maintenance of these cells (Clara et al., 2019). Wnt signaling plays an important role in the development of breast tissue and its deregulation is critical for breast cancer. In basal breast cancer, Wnt signaling is associated with worse prognosis and increased Wnt activity is associated with the increased tumor-initiating capacity of CSCs (which is a hallmark of CSCs) (Chakrabarti et al., 2014). Ras/MAPK signaling is another important mechanism whose activation in CNSCs results in the transition of those cells in CSC phenotype (Morel et al., 2008). Stem
4
cell renewal pathways such as Notch signaling play an important part in stemness and breast stem cells cultured in mammosphere culture show increased Notch receptors (Farnie and Clarke, 2007). Hh signaling is responsible for cellular polarity and plays an important part in stem cell maintenance (Takebe et al., 2011). Additionally, CSCs show increased expression of HH pathway components such as PTCH1, GLI1 and GLI2 when compared with CNSCs (Kasper et al., 2009). Hippo pathway is also an important regulator of stemness as TAZ, a transducer of Hippo pathway, is essential for sustaining tumor-initiating properties of CSCs and also plays an important role in metastatic potential and chemoresistance of these cells (Cordenonsi et al., 2011; Bartucci et al., 2015).
Several important factors have previously been reported for their importance in the induction of stemness in BC. In several studies, authors treated CNSCs with factors leading to their transition in CSCs. TNFα and TGFβ treatment over prolonged time converted CNSC into CSCs through EMT. Similarly, IL6 and IL8 treatment has been previously shown to induce stemness and chemoresistance in breast cancer cells (Chen et al., 2018). Moreover in one study, the serum levels of IL8 positively correlated with metastasis in BC. In another study, CCL2 (another cytokine) was shown to induce the self-renewing capacity of CSCs but this was not accompanied by CSCs differentiation to CNSCs. And inhibition of CCL2 in CSCs significantly inhibited tumorigenesis and NOTCH1 expression(Chin and Wang, 2014).
1.2.4. CSCs resistance to therapy
Breast cancer stem cells are highly resistant to radiotherapy and are enriched after radiotherapy (Phillips et al., 2006). Lagadec et al. showed that non-tumorigenic cells upon treatment with ionizing radiation, developed a CSC phenotype with increased expression of OCT4 and SOX2 (Lagadec et al., 2012). Several studies have shown that CSCs are also resistant to traditional chemotherapies. When breast cancer is treated with these therapies, mostly CNSC cells are targeted and CSCs escape this treatment and over time, these cells ultimately lead to the relapse of tumors. Gupta et al. showed that when breast cancer cells are treated with paclitaxel over a prolonged period of time, this results in increased CSC population in surviving cells (Gupta et al., 2009b). Van Phuc et al. showed that CSC cells
5
are resistant to doxorubicin and upon downregulation of CD44, these cells become sensitive to chemotherapeutics (Van Phuc et al., 2011). Similar results have been shown for tamoxifen, fulvestrant, cisplatin, 5-fluorouracil and gemcitabine (Fillmore and Kuperwasser, 2008; Shafee et al., 2008; Wang et al., 2012; Bhat-Nakshatri et al., 2013; Samanta et al., 2014). It is important to target both CSC and CNSC populations using combination therapy so that both populations can be eliminated from tumors (Liu and Wicha, 2010). In this regard Gupta et al. have previously shown that paclitaxel is effective against CNSC and salinomycin is effective against CSC population in breast cancer cells (Gupta et al., 2009b). Additionally, other compounds that can target Notch, Wnt, Hedgehog (Hh) and Hippo pathways can be identified and used in combination with traditional therapies to eliminate breast cancer.
1.2.5. Presence of CSC in breast cancer cell lines
CSCs are not only present in breast tumors but established breast cancer cell lines show the presence of these cells. The presence of CSCs in breast cancer cell lines varies among molecular classes. Cell lines can be divided into 3 groups based upon the presence of CD44+/CD24- stem cell marker, first group resembles the luminal subtype and shows the least stem cells (e.g. MCF7), and rest two groups are basal where the first one shows basal-like morphology with reduced expression of stem cells (e.g. SUM149) while the other one has basal morphology and more than 90% of its cells are stem cells (e.g. MDA-MB-231) (Fillmore and Kuperwasser, 2008). Similarly using ALDH1 marker, CSCs can be identified in breast cancer cell lines and xenografts as well (Charafe-Jauffret et al., 2009). These studies suggest that breast cancer cell lines can be a suitable model for studying CSCs.
1.2.6. CSCs enrichment in vitro
Cancer cells who lose contact with surrounding cells or extracellular surface, undergo apoptosis known as anoikis. Resistance to this biological trait is important for the cells to achieve metastatic potential (Simpson et al., 2008). In vitro, this trait is exploited to enrich cancer cells for stemness. CSCs cells are enriched in mammosphere culture (3D cell culture). CNSCs require a support surface for their attachment and cannot survive
6
mammosphere culture as low attachment flasks are usually used for this purpose. Only CSCs can survive this culture because of their resistance to anoikis and growth in spheres. Importantly if mammospheres are cultured in normal flasks as monolayers, they give rise to both CSC and CNSC populations (Grimshaw et al., 2008; Shaw et al., 2012; Wang et al., 2014). Alternative methods to mammosphere culture in low attachment flasks are hanging drop method, rotary culture and culture on matrigel (Vinci et al., 2012). Mammosphere is a cheaper method when compared with other methods but its biggest caveat is the requirement of several growth factors and a prolonged time for establishing culture. CSCs are also grown in vivo as a small number of cells are transplanted in mice which give rise to tumors resembling original tumor tissue. Limitations of this method include a lack of cytokines and altered niche (Valent et al., 2012).
1.3. Chemotherapy in BC
BC tumors are treated with chemotherapy in two settings, neoadjuvant therapy where patients are treated with chemotherapy to decrease the size of tumor for probable surgery, and adjuvant setting where patients are treated with chemotherapy after the surgery. Early breast cancer Luminal A and B subtype tumors are treated with endocrine therapy after surgery and/or radiotherapy if the risk of recurrence is low, but if this risk is high then these patients are treated with a combination of either anthracycline and taxane or docetaxel and cyclophosphamide. In HER2 subtype of early breast cancer, patients are treated with chemotherapy (adjuvant paclitaxel and trastuzumab for 1 year) if the pathological (P) stage is 1 but if it is above 1 then those patients are treated with dual anti-HER2 therapy (trastuzumab and pertuzumab) along with a combination of either anthracycline and paclitaxel or docetaxel, and cisplatin in neoadjuvant setting. For these patients, if pCR is achieved after surgery then they are treated with anti-HER2 therapy for 1 year and if pCR is not achieved then these are treated with T-DM1. For early triple-negative breast cancer (TNBC) or Basal subtype, chemotherapy is preferred in the neoadjuvant setting with anthracycline and paclitaxel (platinum-based chemotherapy might also be added) and if after surgery pCR is not achieved then those patients are treated with capecitabine. For advanced breast cancer, Luminal A and B subtype are treated with adjuvant endocrine therapy and chemotherapy options include anthracycline, paclitaxel, vinorelbine and
7
eribulin. For HER2 subtype, first-line adjuvant treatment includes trastuzumab and pertuzumab along with chemotherapy (taxane or vinorelbine), and the second line of treatment is T-DM1. Advanced TNBC or Basal subtype is treated with nab-paclitaxel plus atezolizumab. For some patients, platinum-based therapy is also a good option (Harbeck et al., 2019). Hence paclitaxel (taxane family), cisplatin (platinum-based drug) and doxorubicin (anthracycline family) are most commonly used in breast cancer treatment, so it’s important to identify therapeutic biomarkers for these drugs.
1.3.1. Paclitaxel
Paclitaxel is an antimitotic drug being used in multiple cancer treatments such as lung cancer, prostate cancer, gastric cancer, bladder cancer as well as breast cancer. It binds to microtubules and results in their stabilization by promoting α and β subunits assembly as these are building blocks of microtubules. This stabilization of microtubule further hampers the cell’s ability to divide, halting the cell division in G2 or M phase of cell cycle leading to cell death. This drug was approved for breast cancer treatment in 1994 (Abu Samaan et al., 2019). Among breast cancer subtypes, paclitaxel is more effective on basal and ERBB2+ subtype compared to luminal and normal like cancers (Rouzier et al., 2005). Apart from the use of paclitaxel for the treatment of different intrinsic subtypes of breast cancer, paclitaxel is being used to treat metastatic breast cancer (Gradishar, 2012). Several studies have been performed to identify the probable biomarkers but none of the identified biomarkers have been applied to clinics yet. Parardiso et al. showed β–tubulin III immunohistochemical expression as a predictive biomarker for paclitaxel in a cohort of 72 patients of advanced breast cancer (Paradiso et al., 2005). Chang et al. proposed 92 gene list capable of classifying breast cancer patients into docetaxel (a derivative of paclitaxel) sensitive and resistant groups in neoadjuvant setting (Chang et al., 2003). Sun et al. showed Phosphoglycerate kinase-1 (PGK1) as a prognostic biomarker for breast cancer treatment with paclitaxel (Sun et al., 2015). Murray et al. summarized different predictive biomarkers for taxane resistance which include Multidrug Resistance Protein 1 (MDR1), P-glycoprotein (Pgp) and β-Tubulin (Murray et al., 2012). Xie et al. showed microtubule binding proteins such as MAP2, Tau, parkin and survivin as biomarkers for paclitaxel response (Xie et al., 2016). Pavlíková et al. compared MCF7 sensitive and resistant cells
8
to paclitaxel and found that HSP27 and cathepsin were upregulated in sensitive cells and TRIP6 was upregulated in resistant cells (Pavlíková et al., 2015). Xu et al. showed PDCD4 as a biomarker for both paclitaxel and cancer progression (Xu et al., 2015). Hodgkinson et al. summarized differnet paclitaxel resistant biomarkers in breast cancer cell line among which downregulated markers are cytokeratin 19, HSP27 and phosphoglycerate kinase-1, and upregulated genes included 14-3-3 epsilon, proliferating cell nuclear antigen, sorcin and stathmin (Hodgkinson et al., 2010).
1.3.2. Doxorubicin
Doxorubicin is an important anticancer drug that belongs to anthracycline class of compounds and is used against both solid and liquid tumors. Different models have been presented regarding cell death in response to treatment of doxorubicin which include formation of DNA adducts leading to increased torsional stress at active promoters, trapping topoisomerase II at breakage site, oxidative stress and ceramide overproduction (Yang et al., 2014). Several studies have been proposed to identify doxorubicin sensitivity and resistance biomarkers. AbuHammad et al. concluded that doxorubicin resistant MCF7 breast cancer cell line showed metabolizing genes such as CYP1A1 and CYP1A1 up-regulation along with drug efflux pump genes and other genes such as TOP2A and MET were downregulated (AbuHammad and Zihlif, 2013). Liang et al. showed that a circular RNA KDM4C when upregulated, decreased doxorubicin resistance and tumor progression (Liang et al., 2019). Long et al. showed that microRNA miR-193b reverses doxorubicin in breast cancer by decreasing MCL-1 expression (Long et al., 2015). Piasecka et al. reported a miRNA cluster involvement in determining TNBC cells resistance/sensitivity to doxorubicin (Piasecka et al., 2018). Sun et al. showed that miRNA-574 is responsible for doxorubicin resistance as it downregulates SMAD4 (Sun et al., 2018). Zang et al showed that Notch signaling plays an important part in cancer cells' response to drugs and downregulation of Notch-1 increased breast cancer cells sensitivity to doxorubicin (Zang et al., 2010). Similar results were shown by Kim et al. (Kim et al., 2015). Moreover, TNBC cells’ sensitivity to doxorubicin is increased if BCL-2 expression is decreased (Inao et al., 2018). Moriera et al. showed STAT3 as a potential biomarker for doxorubicin resistance in breast CSCs (Moreira et al., 2018). STAT3 importance in CSC drug resistance was also
9
reported by Cheng et al. which suggested Stat3/Oct-4/c-Myc signal circuit as liable for doxorubicin resistance (Cheng et al., 2018). Smith et al. performed antibody microarrays to determine doxorubicin resistance biomarkers and reported association of decreased expression of tyrosine phosphorylated form of ERK with doxorubicin resistance along with cyclin B1 and cytokeratin 18 (Smith et al., 2006). Munkácsy et al. reported PSMB7 as bad prognostic biomarker of breast cancer patients and its higher level were associated with doxorubicin resistance (Munkácsy et al., 2010). Loi et al. reported role of CD73 as poor prognosis biomarker of breast cancer and resistance to anthracyclines (Loi et al., 2013). Hodgkinson et al summarized several doxorubicin resistant biomarkers in breast cancer cell line among which downregulated markers alpha tropomyosin, cytokeratin 8, cytokeratin 19, peroxiredoxin 2 and septin 2, and upregulated markers included 14-3-3 sigma (stratifin), ATP synthase β, cathepsin D chain B, cyclophilin B and mitotic checkpoint protein BUB 3 (Hodgkinson et al., 2010).
Several compounds have also been reported which are synergistic to doxorubicin and enhance its activity when breast cancer cells are treated with a combination of these drugs. Li et al. showed a gamma secretase inhibitor to increase MDA-MB-231 sensitivity to doxorubicin (Li et al., 2015). Marinello et al. showed that metformin is a potential drug to prevent doxorubicin resistance in breast cancer cell lines (Marinello et al., 2019).
1.3.3. Cisplatin
Cisplatin is a chemotherapeutic drug which belongs with platinum-based compounds used in treatment of cancer. It is used in treatment of several cancers including breast cancer, bladder cancer, head and neck carcinoma, lung cancer, testicular cancer and ovarian cancer. Cisplatin induces apoptosis in cancer cells through crosslinking with purines bases on DNA, thus it causes DNA damage and hampers DNA repair. Its common side effects include kidney issues, allergic reactions, decreased immunity, gastrointestinal problems and hemorrhages (Dasari and Tchounwou, 2014). Silver et al. proposed cisplatin use in neoadjuvant setting for TNBC patients which show decreased BRCA expression (Silver et al., 2010). Byrski et al. reported high pathological response (pCR) in patients harboring BRCA1 mutations and treated with cisplatin (Byrski et al., 2010). Several studies have
10
previously reported cisplatin resistance/sensitivity biomarkers. Hodgkinson et al. summarized several cisplatin resistant biomarkers in breast cancer cell line among which downregulated markers are beta tubulin type 3, cytokeratin 17, glutathione S transferase mu 3, HSP27, isocitrate dehydrogenase, peroxiredoxin 4, ribosomal protein P0 and tropomyosim alpha, and upregulated markers included electron transfer flavoprotein beta, heterogeneous nuclear ribonucleoprotein A3, hydroxyprostaglandin dehydrogenase-15 (NAD), matrix metalloproteinase 9, peptidyl-prolyl isomerase B and proteasome beta 1 subunit (Hodgkinson et al., 2010). Xu et al. reported ER-α promoter as resistance biomarker of cisplatin in TNBC patients (Xu et al., 2018a). Pyndiah et al. reported c-MYC as promoter of cisplatin resistance in cancer cells (Pyndiah et al., 2011). Chen et al. summarized several miRNAs which play important part in imparting breast cancer cells with cisplatin resistance/sensitivity (Chen et al., 2016). Xie et al. reported mir-519d as cisplatin sensitivity regulator by down regulating MCL1 expression in breast cancer stem cells (Xie et al., 2017). Leong et al reported p63 as good prognosis biomarker in a subset of sporadic TNBC breast cancer and is responsible for cisplatin sensitivity (Leong et al., 2007). Liu et al reported collagen 1A1 as poor prognostic factor for breast cancer metastasis and its upregulation was associated with cisplatin sensitivity, emphasizing its role as a potential drug target for the patients with higher expression of this gene (Liu et al., 2018a). Zhu et al. proposed ER- α36 as cisplatin resistance biomarker and this process is mediated through nongenomic estrogen signaling in breast cancer cells (Zhu et al., 2018).
1.4. Breast cancer plasticity
Apart from EMT and stemness plasticity in breast cancer, hormone receptor biomarker based and PAM50 based subtype switching is observed.
ER, PR and Her2 IHC biomarkers play an important role in decision making for breast cancer patients’ treatment plans. Based upon the expression of these hormone receptors either endocrine or chemotherapeutic treatment strategies, are selected in clinics. ER+ and PR+ breast cancer subtypes are treated with hormonal therapy for tumors with low risk of recurrence but if the risk of recurrence is high then chemotherapy treatment is also selected. For HER2+ subtype, trastuzumab or pertuzumab along with chemotherapeutics is used to
11
treat early breast cancer patients. And TNBC patients are treated with chemotherapeutics (Harbeck et al., 2019). So, it is very important to identify breast cancer subtype specifically and treat patients with an appropriate plan. Unfortunately, the expression of these IHC is not stable in breast cancer. Almost 33% of breast cancer patients express a change in the status of IHC markers and almost one out of seven patients show a change in HER2 status (Lindstrom et al., 2012). Hirata et al. showed that breast cancer patients when treated with neoadjuvant therapy showed a significant change in IHC status. The overall change in status was determined at 16%. And patients who switched their status and no hormonal therapy was used for treatment, showed worse overall and disease frees survival (Hirata et al., 2009). Kasami et al. showed a significant difference in PR status before and after neo adjuvant chemotherapy (Kasami et al., 2008). Neubauer et al. showed significant change for all 3 IHC markers and the overall change for this study was 23% (Neubauer et al., 2008). Adams et al. showed a significant increase in HER2 IHC positivity in breast cancer patients before and after neoadjuvant chemotherapy (Adams et al., 2008). Tacca et al. showed 23% switch in hormonal receptors status in either direction before and after neoadjuvant chemotherapy (Tacca et al., 2007). Thompson et al. showed that out of 208 breast cancer patients, ER status switch was observed among 10.2% patients. And this percentage for PR was 24.8% and HER2 was 2.9% (Thompson et al., 2010). Switch in IHC status is also reported in between primary and metastatic breast cancer tissue as well. Sari et al. reported significant difference for hormone receptor between primary and metastatic tumors where the change in ER status was 36%, change in PR status was 54% and for HER2, the switch in status was 14%(Sari et al., 2011). Aurilio et al. performed a meta-analysis in which they observed 24% switch for ER status, 46% switch in PR status and for HER2 13% from negative to positive status between primary and recurrent tumor. Additionally 14% tumors showed gain of ER status, 15% showed gain of PR status and 5% showed gain of HER2 status on recurrence (Aurilio et al., 2014). A number of other studies have validated or showed the same results (Zidan et al., 2005; Broom et al., 2009; Ataseven et al., 2012; Niikura et al., 2012; Dieci et al., 2013; Kinoe et al., 2018; Yang et al., 2020). In literature previously, this switch of hormonal receptor status has been associated with administration of chemotherapy (Anand and Velayudhan, 2016; Erdem et al., 2017; Vogel et al., 2019).
12
As breast cancer is divided into 5 intrinsic molecular subtypes which are LumA, LumB, Her2, Basal and Normal. In clinics, breast cancer samples are subtyped using PAM50 test which uses the expression of 50 genes to assign each sample to its molecular class (Parker et al., 2009). As opposed to IHC subtyping plasticity, not many studies have been performed to determine if PAM50 subtyping is switched upon chemotherapy treatment or metastasis. Cejalvo et al. analyzed primary and metastatic samples to study PAM50 subtype switching in 123 patients. For these patients, metastasis was recorded for several organs including lymph node, lung, bone, skin and peritoneum among others. Basal showed the highest concordance for switching between primary and metastatic tissue as no switching was observed. HER2 and LumB showed similar switching as the rate of the switch was 23.08% and 30%. The highest switching percentage was observed for LumA at 55.32% and most of these samples switched to LumB and HER2 subtype (Cejalvo et al., 2017).
1.5. Metastatic biomarkers for BC
Breast cancer mortality rate has significantly decreased during the last 20 years. But metastatic breast cancer still holds the major responsibility for breast cancer lethality as only 5% of breast metastatic patients survive long term as this disease have a median overall survival of 20-28 months (Gobbini et al., 2018). Breast cancer metastasis takes place through several steps sequentially which include migration of tumor cells after achieving migration properties towards blood vessels, transfer of these cells to blood supply known as intravasation, survival of tumor cells in blood circulation, extravasation to a different host organ, colonization and metastatic tissue growth with the manifestation of clinical symptoms (Lambert et al., 2017). Breast cancer metastasis is detected through clinical symptoms, biopsies of metastasis, radiological examinations, imaging techniques and metastasis biomarkers (Scully et al., 2012). Breast cancer metastasis is mostly observed for lymph node, brain, lungs and bone (Lorusso and Rüegg, 2012). EMT is reported to play an important role in metastasis as mesenchymal cells show increased migration and resistance to therapy along with increased tumorigenicity (Dongre and Weinberg, 2019). EMT transcription factors (Snail1 and Twist1) overexpression not only give metastatic
13
properties to expressing cells but also help neighboring cells in achieving metastasis as well (Neelakantan et al., 2017).
In breast cancer, several metastasis biomarkers have been reported previously. Cabioglu et al. showed that CCR7 and CXCR4 are axillary lymph node metastatic biomarkers in early stage breast cancer (Cabioglu et al., 2005). Cai et al. reported TPX2, KIF2C, CDCA8, BUB1B, and CCNA2 as prognostic markers for distant metastasis in breast cancer (Cai et al., 2019b). Merdad et al. showed MMP9 can be used as a biomarker for cancer invasion and metastasis (Merdad et al., 2014). Zurita et al. proposed hypermethylated promoters of genes 14-3-3-σ and ESR1 as breast cancer metastasis biomarkers in serum (Zurita et al., 2010). Tseng et al. proposed a biomarker model to diagnose breast cancer metastasis and this model included clinical features such as TNM staging, Age, ER, PR and HER2 along with serum biomarkers (CA15-3, CEA, and sHER2). This proposed model can predict metastasis 90 days ahead of the event (Tseng et al., 2019). Fackler et al. proposed a methylation specific PCR assay for 10 genes which can be used for therapeutic and diagnostic purposes in breast cancer metastasis. Ten genes included in the assay were AKR1B1, COL6A2, GPX7, HIST1H3C, HOXB4, RASGRF2, TM6SF1, ARHGEF7, TMEFF2 and RASSF1 (Fackler et al., 2014). Chen et al. proposed 2 micro-RNAs (miRNA-10b and miRNA-373) as biomarkers for lymph node breast cancer metastasis (Chen et al., 2013b). Eichelser et al. showed increased expression of miR-17 and miR-155 in non-metastatic samples when compared with non-metastatic samples in the serum of breast cancer patients (Eichelser et al., 2013). Roth et al. showed that the expression of 10b, miR-34a, and miR-155 in the blood significantly correlated with overt metastasis (Roth et al., 2010). Thomassen et al. performed a meta-analysis for 1200 patients in total to identify potential metastatic candidate genes. PSD3, FOS, LPL, EPHX2 and DIRAS3 were proposed as metastasis suppressor genes while AURKA, RECQL4, PRMT7 and GINS2 were reported as metastasis promoter genes (Thomassen et al., 2009). Györffy et al. generated a dataset of 1079 patients by combining previously published datasets and identified a gene signature of 376 genes which can predict breast cancer recurrence (Györffy and Schäfer, 2009). Wang et al. identified 76 gene signature which could predict distant metastasis of breast cancer patients with lymph node negative status (Wang et al., 2005). Minn et al. proposed a gene signature related with lung metastasis in breast cancer
14
patients and they named this “lung metastasis gene expression signature”. This signature included genes such as SPARC, TNC, PTGS2, ANGPTL4, MMP2, FSCN1, MMP1, KRTHB1, CXCL1, EREG, ID1, LY6E and RARRES3 (Minn et al., 2007). Barraclough et al. performed a meta-analysis for breast cancer cohorts and propose dCOX2 and RPM2 as metastasis biomarkers (Bell et al., 2017). GATA3 expression was decreased in metastatic tissue in a subset of ER+ irrespective of hormonal treatment (Mehra et al., 2005). Using matched primary and metastatic tissues of 16 breast cancer patients, Iwamoto et al. showed that VEGFA and DNMT3A are overexpressed in brain metastasis when compared with primary tissues (Iwamoto et al., 2019). Vargas et al. showed in their meta-analysis that ERRα is responsible for increased bone metastasis and this expression is unique to bone metastasis and is not observed for lung metastasis (Vargas et al., 2019). Matrone et al. showed that metastatic breast cancer overexpresses tau which leads to microtubule stabilization providing further support in metastasis (Matrone et al., 2010). Han et al proposed that NM23 is responsible for decreased lymph node metastasis (Han et al., 2017). Kim et al. correlated increased PD-L1 expression with increased lymph node metastasis (Kim et al., 2017). Li et al. integrated three datasets for meta-analysis and showed that CD80 and ISG15 leads to increased breast cancer progression and metastasis in breast cancer (Li et al., 2020). Pan et al. through a meta-analysis, showed that higher expression of STAB1 is related with increased metastasis leading to worse prognosis in breast cancer (Pan et al., 2016). CXCR4 was shown to be highly associated with breast cancer metastasis and is also expressed on breast cancer stem cells (Zhang et al., 2014).
Additionally, Shriver et al. showed that loss of OBSCN gene is associated with EMT leading to increased tumorigenicity and metastasis (Shriver et al., 2015). In metastatic breast cancer, Imani et al. showed through meta-analysis that TWIST1, ZEB1, SLUG and SNAIL1 IHC expression was associated with worse prognosis (Imani et al., 2016). Chakrabarti et al. showed that ELF5 is responsible for EMT inhibition resulting in metastasis repression through decreased SNAIL2 (Chakrabarti et al., 2012). Yan et al showed that GATA3 expression results in MET leading to decreased breast cancer metastasis (Yan et al., 2010). Gjerdruma et al. showed that Axl expression is related to cancer survival and, cells who undergo EMT express increased Axil in metastasized tissue (Gjerdrum et al., 2010). DiMeo et al. showed that Wnt signaling in breast cancer, plays a
15
major role in EMT resulting in metastasis and Wnt signaling inhibition resulted in the loss of mesenchymal properties and metastasis as well (DiMeo et al., 2009). Cai et al. showed that ectopic overexpression of miR-374a promoted both EMT and metastasis in vitro and in vivo (Cai et al., 2013). Additionally, Yan et al. showed that a decrease in the number of circulating tumor cells is correlated with treatment response (Yan et al., 2017).
Although these studies show different biomarkers for breast cancer metastasis but the limitation of these studies, is the number of patients and metastatic cohorts used. Metastatic biomarkers identified through analyzing multiple cohorts and with an increased number of patients will hold higher importance and will be the most suitable candidates for further validation.
1.6. Role of MLANA and INHBA in Melanoma
Through epidemiological studies, researchers have shown a link between cutaneous melanoma and breast cancer. Carriers of BRCA gene mutations have also a high risk of melanoma and similarly, carriers of CDKNA2 gene have a higher risk of developing breast cancer (Goggins et al., 2004). Similarly, Ho et al. analyzed the Irish Cancer Registry for identifying any correlations between malignant melanoma and breast cancer. And authors found a link between both conditions suggesting that survivors of both cancers should undergo routine check-ups for the second cancer (Ho et al., 2011).
Melanoma shows various phenotypes based upon stemness, EMT and invasion/proliferation. In our previous publication, we showed that these phenotypes are relatively related to each other in melanoma cells. Additionally, using only two genes Inhibin subunit A (INHBA) and Melanin A (MLANA), melanoma cells can be classified in their corresponding classes based upon stemness, EMT and invasion/proliferation. In this study, only two genes were used as a classifier as we wanted to find minimal number of genes for classification (Senses et al., 2017). MLANA is a critical regulator of pigmentation and is previously associated with the proliferative phenotype of melanoma (Arozarena and Wellbrock, 2019). In melanoma, a large proportion of cells express MLANA which also acts as melanoma antigen for T cells. And MLANA is downregulated in hypoxic conditions (EMT rich regions) which suggests that proliferative/epithelial cells
16
express MLANA and MLANA can be used as epithelial and melanocytic marker (Widmer et al., 2013).
INHBA is overexpressed in the invasive phenotype of melanoma and is related to extra cellular microenvironment modifications, decreased proliferation and high motility(Hoek et al., 2008). INHBA knockdown in vitro was associated with decreased EMT (Sinnberg et al., 2018). So, this data shows that MLANA biomarker represents non-stem/epithelial/proliferative phenotype of melanoma and INHBA represents stem/mesenchymal/invasive phenotype. Finally, these conclusions along with similarities of breast cancer and melanoma, warrants the question if stem/non-stem and mesenchymal/epithelial markers in melanoma can be used as melanoma prognostic biomarkers.
17
2. Aim of the study
Breast cancer shows plasticity and switches among its various subtypes depending upon various factors such as treatment, metastasis and microenvironment. This plasticity has been reported to occur through EMT which in turn, has been associated with stemness. It is likely that when breast tumors are treated with traditional therapy, breast cancer stem cells are not killed; or due to EMT, mesenchymal cells are generated which are resistant to therapy. In this study, we aimed to identify a robust gene list that could classify BC samples regarding their stemness and EMT characteristics. Using this gene list, we aimed to determine whether a thus generated categorization can be applied to all BC cohorts, and whether this could be used to determine drug sensitivity and prognosis. We also aimed to generate a classification of BC based on the same gene list, but via continuous variables. We used this second approach to test if we could trace phenotype plasticity in BC, and how this related to chemosensitivity. We asked if our gene list had any prognostic importance, which could lead it to be used in the clinics.
Secondly, we aim to identify specific biomarkers for paclitaxel, cisplatin and doxorubicin sensitivity, as these drugs are routinely used to treat breast cancer patients. By identifying such biomarkers, we hypothesized that these treatments can be personalized to patients which would show a higher response to these drugs.
Thirdly, we aimed to highlight breast cancer plasticity for both IHC based (ER, PR and HER2) and PAM50 subtypes. In breast cancer, patients receive treatment based on their IHC marker expression and subtype classifications. Therefore, if subtype changes occur upon treatment or metastasis, the treatment plan should be revised according to the new subtype to better achieve the prognostic outcome. We also aimed to evaluate metastatic biomarkers in breast cancer using multiple cohorts in silico.
Lastly, as we had previously shown two markers, Inhibin (INHBA) and Melanin A (MLANA), to subtype melanoma tumors into invasive/proliferative, epithelial/mesenchymal and stem/non-stem phenotypes similar to our stem/non-stem and
18
epithelial/mesenchymal classification in breast cancer, we aimed to study the prognostic significance of INHBA and MLANA in comparison to our breast cancer gene list.
19 3. Materials 3.1. General laboratory reagents
Reagents and chemicals for general use in the laboratory, were bought from several sources as shown in Table 3.1.
Table 3.1: General laboratory reagents and vendors
Reagent / Chemical Company
Ethanol SIGMA-ALDRICH (St. Louis, MO,
USA)
Isopropanol SIGMA-ALDRICH (St. Louis, MO,
USA)
Chloroform SIGMA-ALDRICH (St. Louis, MO,
USA)
DMSO (Dimethyl sulfoxide) AppliChem (Darmstadt, Germany)
RNAse Zap Ambion (Carlsbad, CA, U.S.)
Nuclease Free Water Ambion (Carlsbad, CA, U.S.)
Qubit™ RNA BR Assay Kit Invitrogen (Carlsbad, CA, USA)
DNA-free™ Kit Invitrogen (Carlsbad, CA, USA)
RevertAid First Strand cDNA Synthesis Kit Thermo Scientific (Waltham, MA, USA)
OneTaq Quick-Load 2X Master Mix New England Biolabs (Ipswich, MA, USA)
iTaq Universal SYBR Green Supermix Bio-Rad Laboratories, Inc., (Berkeley, CA, USA)
50X TRIS acetate EDTA was prepared by dissolving 242 g of Tris Base, 57.1 ml of glacial acetic acid and 37.2 g of Tritiplex III (EDTA) in 1 liter of dd H2O.
3.2. General laboratory equipment
Thermo Scientific™ NanoDrop™ One Microvolume UV-Vis Spectrophotometer (Thermo Scientific (Waltham, MA, USA) and Qubit Fluorometer (Invitrogen, Carlsbad, CA, USA) were used to check the quality of RNA samples before and after DNAse treatment respectively. Gel electrophoresis was performed in Gel electrophoresis system (Hoefer Inc., Holliston, MA). For luminescence-based assays, Synergy HTX multi-mode reader (Biotek, VT, USA) was used.
20 3.3. Cell culture reagents
Cell culture media and reagents were procured from different sources as shown in Table 3.2.
Table 3.2: Cell culture media and reagents
Reagents Company
Dulbecco's Modified Eagle Medium (DMEM) Lonza (Basel, Switzerland) Rosswell Park Memorial Institute Medium
(RPMI) GIBCO (Carlsbad, CA, USA)
B27 spheroid media supplement Invitrogen, Carlsbad, CA, USA Epidermal Growth Factor human (EGF) SIGMA-ALDRICH (St. Louis, MO,
USA)
Fibroblast Growth Factor-Basic human (FGF) SIGMA-ALDRICH (St. Louis, MO, USA)
Heparin sodium salt SIGMA-ALDRICH (St. Louis, MO,
USA)
Trypsin-EDTA SIGMA-ALDRICH (St. Louis, MO,
USA)
Fetal Bovine Serum (FBS) GIBCO (Carlsbad, CA, USA)
L-Glutamine Lonza Group (Switzerland)
Fetal Bovine Serum (FBS) Lonza Group (Switzerland)
Penicillin –Streptomycin HyClone (Rockford, USA)
CellTiter-Glo® Luminescent Cell Viability
Assay Promega (Fitchburg, Wisconsin, USA)
TrypLE™ Select Enzyme (1X), no phenol red Life Technologies (Waltham, MA, USA)
TRIzol® Reagent Life Technologies (Waltham, MA,
USA) 3.4. Cell culture media and solutions
Breast cancer cell lines BT474, BT20, CAL51, JIMT1, MCF7, 157, MDA-MB-231, MDA-MB-453, MDA-MB-468, MDA-MB-436, ZR751, were cultured in DMEM media whereas HCC38, HCC70, HCC202, HCC1143, HCC1937, HCC1954 and T47D were cultured in RPMI media.
To prepare cell culture media for 2D cell culture, 10% FBS, 1% L-Glutamine and 1% Penicillin –Streptomycin of total media, were filtered using 0.2 µm syringe filters and added to respective medium to make complete medium.
21
To prepare cell culture media for 3D cell culture (mammosphere culture), 1% L-Glutamine and 1% Penicillin –Streptomycin of total media, were filtered using 0.2 µm syringe filters and added to respective medium in addition to 1x B27, EGF 10ng/ml, FGF 20ng/ml and heparin 2 µg/ml to make complete medium. Once prepared medium was used for 7 days after which remaining medium was discarded and new medium was prepared.
10X Phosphate buffer saline (PBS) was prepared by dissolving 80g of NaCl, 2g of KCl, 14.4g of Na2HPO4 and 2.4g of KH2PO4 in 800 ml of ddH2O. pH of the solution was
adjusted to 7.4 and volume was increased to 1 liter by adding more ddH2O. 100ml of
prepared 10X PBS was added to 900ml of ddH2O generating 1X PBS. 1X PBS was then
autoclaved and filtered before use in cell culture.
To freeze cells in liquid nitrogen, 10ml DMSO was added to 90ml FBS to generate freezing medium.
For cell cytotoxicity analysis Lapatinib was bought from CAYMAN and Midostaurin from Sigma Aldrich. Both drugs were dissolved in DMSO generating 50mM and 5mM stocks respectively.