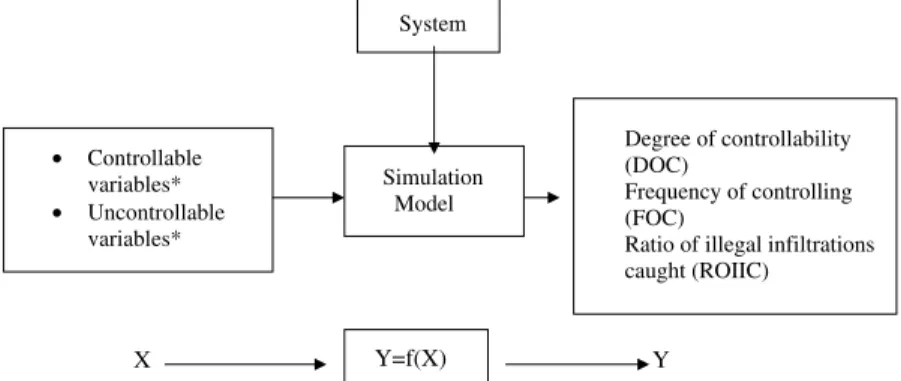
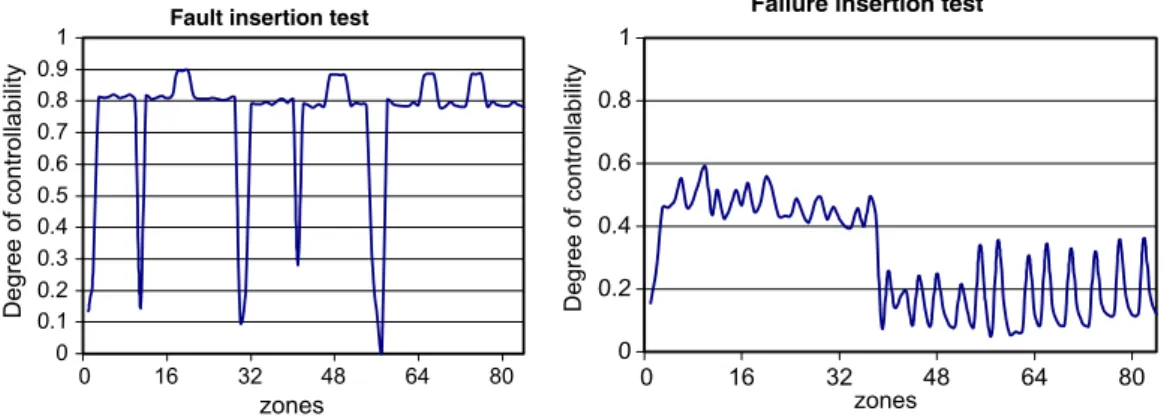
Simulation modelling and analysis of a border security system
Tam metin
Şekil


Benzer Belgeler
Without an index enhance- ment scheme, the usual rotating BEC with a vortex lattice cannot exhibit high enough index contrast to obtain photonic band gaps.. BECs are rather dilute,
This paper introduces the concept of politically motivated brand rejection (PMBR) as an emergent form of anti-consumption behavior. PMBR is the refusal to purchase and/or use a brand
Bu varsayımlar çerçevesinde Tablo 4’te kore- lasyon analiz sonuçları incelendiğinde, ekonomiklik boyutu ile kurumsal iletişim, kurumsal davranış ve algılanan kurumsal
A.g.e.. MERZ ~ FON'DA ERMEN~~ AYAKLANMALARI 809 ayaklanma ç~karmak için görevlendirilmi~tir. Adana'dan Kayseri'ye do~ru Ermeni halk~n yo~un oldu~u yerlerde, k~~k~rt~c~~
Tamir ve tevsie muhtaç olan Galatasaray m edresesi; A vcı Sultan Mehmed zamanında mü him tadilât görmüş, fakat yalnız saraya memur yetiştirm ekten iba ret
Daha önce bu görevi başarılı bir şekilde yürütmüş olan Münir Bey Haziran 1921’de Doğu Cephesi Komutanı Kazım Karabekir’in isteği ile bu defa Ankara
Akdeniz ve Güneydoğu Anadolu Bölgesi’nde bağ alanlarında salkımlarda zarar yapan türlerin elde edildiği noktalar (Mavi: Lobesia botrana , Pembe: Cryptoblabes gnidiella , Sarı:
Çal›flma kapsam›nda lomber omurga L2-L4 ve femur üst uç toplam›nda çift enerjili X-›fl›n› absorbsiyometresiyle (DXA) ölçülen KMY ve efl zamanl› olarak Dünya
