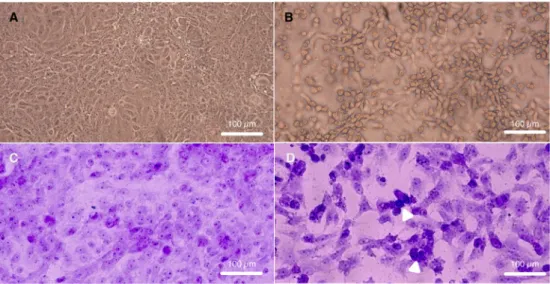
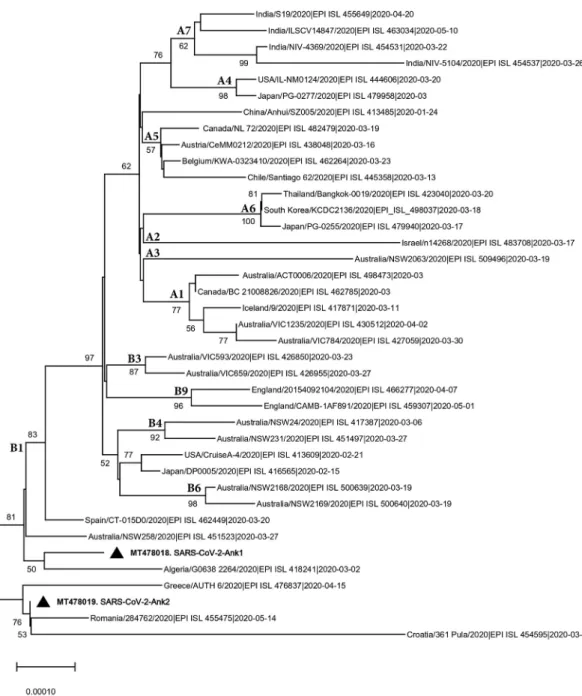
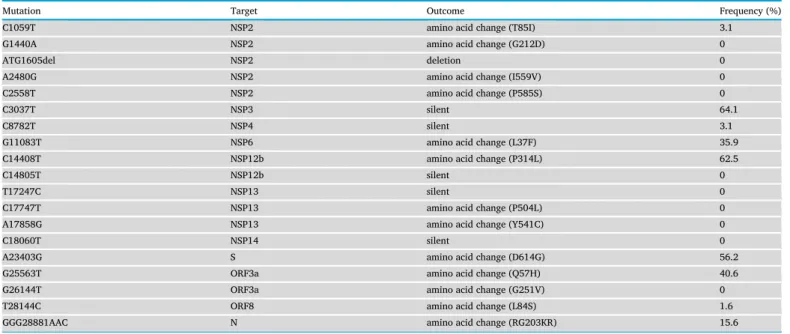
Characterization of local SARS-CoV-2 isolates and pathogenicity in IFNAR(-/-) mice
Tam metin
Şekil

Benzer Belgeler
The course of confirmed patients, patients in intensive care unit, patients intubated, patients healed, patients died, and active cases with Covid-19 infection
responses can be used for retrospective diagnosis by showing increased antibody levels in acute or convalescent periods in blood samples taken from patients with negative molecular
Basit soğuk algınlığından bronşit, pnömoni, ağır akut solunum sendromu (Severe Acute Respiratory Synd- rome; SARS)’na, koagülopati, çoklu organ yetmezliği ve ölüm
SARS-CoV-2 spike (S) glycoprotein is vital in the binding of the virus to the host cell receptor that is angiotensin converting-enzyme 2 (ACE2), membrane fusion, vaccine studies
Conclusion: Acute follicular conjunctivitis with preauricular LAP and anterior uveitis were detected and no fundus pathologies were found in detailed ophthalmic
In our study, we investigated 783 SARS-CoV-2 positive patients at a pandemic hospital in Sakarya city and ischemic stroke was detected in 26 of these cases.. Stroke frequency
İstanbul Boğazı transit gemi geçişlerinde hesaplanan sonuçlardan, Trozzi - Vaccaro yöntemiyle bulunan CO 2 değerleri, İstanbul denizyolu toplu taşımacılığından
Comparison of Clinical and Laboratory Findings and Computed Tomography Findings of SARS-CoV-2 Infected Patients Followed- up in a Tertiary University Hospital..
