http://journals.tubitak.gov.tr/agriculture/ © TÜBİTAK
doi:10.3906/tar-1303-80
Biochemical and sensory evaluations of Turkish delight (lokum) enriched with black
grape and sour cherry syrups
Ali BATU1,*, Ali ARSLAN2
1Department of Food Engineering, Faculty of Engineering, Mevlana University, Konya, Turkey 2Department of Food Engineering, Faculty of Engineering, Ardahan University, Ardahan, Turkey
1. Introduction
Turkish delight (lokum) is a sugar-based jelly-like confection containing a starch gel. The history of it dates back more than 300 years, making it one of the oldest sweets in the world (Doğan, 2008). Turkish legend has it that in his endeavors to cope with all his mistresses, the Turkish sultan Abdul Hamid I summoned all his confectionery experts and ordered them to produce a unique dessert to add to his collection of secret recipes for which he was famous. As a result of extensive research, Turkish delight was born. In 1776, Haci Bekir, a fully apprenticed confectioner, arrived in İstanbul from a small town in Anatolia (Batu and Kirmaci, 2009). Bekir set up a little shop in the center of the city and quickly won fame and fortune among the people. Fashionable ladies began to give Turkish delight to their friends in special lace handkerchiefs. ‘Lokum’ is derived from the word rahat-ulhulkum, which was used in the Ottoman language. Turkish delight had been known in Anatolia since the 15th century, but it became widespread within the borders of the Ottoman Empire (http://www. turkish-delight.com).
In former years, it was produced using a combination of honey or grape molasses and flour. In the 20th century, with the availability of sucrose and especially purified starch, both the production and taste of it has changed.
The traditional sweetening ingredients of honey and grape molasses were replaced with the newly available refined sugar (Gönül, 1985; Batu, 2006). It was introduced to the West in the 19th century. During his travels to İstanbul, an unknown British traveler became very fond of the Turkish delicacy, purchased cases of it, and shipped them to Britain under the name of Turkish delight. It reportedly first showed up in Europe at the Vienna Fair in 1837 (http:// www.turkish-delight.com). Although it is a confection made from starch and sugar nowadays, it is often flavored with rosewater, lemon, or some other fruit extraction. It has a soft, sticky consistency and is often packaged and eaten as small cubes that are dusted with icing sugar to prevent sticking (TGK, 2004). Some recipes include small nut pieces, usually pistachio, hazelnut, or walnut. Though enjoyed worldwide, Turkish delight is especially popular in Turkey, Armenia, Greece, the Balkans, and Middle Eastern cuisines. It is also popular in Romania and Russia.
The importance of black grape and sour cherry fruits for human health is due to their phenolic compounds. These compounds are well-known natural antioxidants. Antioxidant compounds of grape and sour cherry fruits also include the anthocyanins, flavonols, and phenolic substances such as malvidin and procyanidin. The concentration of total phenolics is directly proportional to
Abstract: Black grape and sour cherry are high in phenolic substances and anthocyanin compounds, which are important for human
health. Adding black grape and sour cherry fruit syrups into Turkish delight (lokum) could make the product healthier. While the highest antioxidant activity (AA) was found in the products produced with 7.5% black grape syrup (BGS) and sour cherry fruit syrup (SCS), the lowest AA was obtained from the control sample. The AA values of Turkish delight produced with BGS and SCS increased with the increased fruit concentration. Turkish delight produced with SCS had about twice as much AA than that produced with BGS. The sensory panelists’ scores showed that all the treatments were acceptable in terms of appearance, color, and aroma, but the products produced with 2.5% were evaluated as the best. In terms of overall acceptability, the 2.5% and 5.0% fruit concentrate Turkish delight samples produced approximately the same results.
Key words: Turkish delight, sour cherry, black grape, antioxidant, total phenolics
Received: 22.03.2013 Accepted: 27.02.2014 Published Online: 27.05.2014 Printed: 26.06.2014 Research Article
the antioxidant activity (Can et al., 2005; Cabaroğlu and Yılmaztekin, 2006).
Black grape concentrate contains polyphenols, iron, potassium, magnesium, organic acids, and B vitamins, as well as a high amount of resveratrol, quercetin, catechin, anthocyanins, and proanthocyanidins (Fidan and Yavaş, 1986). Black grapes are rich in terms of minerals, vitamins, and antioxidants needed for human nutrition (Cemeroğlu, 2011). Grape is a popular fruit almost everywhere. Red grape juice contains more than 500 mg/L flavonoids (Orak, 2007). In recent years, red grape juice has been recommended as a food supplement for cancer and cardiovascular patients undergoing treatments for cancer (chemotherapy). Red grape juice is particularly recommended to strengthen the immune system of the human body (Yıldız, 2007). Orak (2007) reported that grape juice delays mental and physical aging. The results of research show that black grape juice is rich in terms of polyphenol content and antioxidant activity.
Cherries are very rich in vitamins C and E and β-carotene. β-Carotene protects the cell membrane lipids from oxidative degradation by destroying free radicals. It is a powerful antioxidant compound (Serteser and Gök, 2003). A 1992 study reported total phenolics of 312 mg 100 g–1 in sour cherries (Chandra et al., 1992). Recent
studies have shown that cherries also contain the hormone melatonin (Burkhardt et al., 2001), which is effective in adjusting the biorhythm of the body. It also has a protective effect against cancer (Çam and Erdoğan, 2003).
Turkish delight has been an important traditional sweet in Turkey for many years. It also has a high energy content. When black grape syrup (BGS) and sour cherry syrup (SCS) are used in Turkish delight, it can be a pleasant and value-added way to deliver significant antioxidant activity. Production of Turkish delight with added fruit concentrate has not yet been undertaken or even studied in the published research literature. That is why this study is a new and original work. Turkish delight with fruit has been produced to provide flavor options. However, these products contain artificial flavors and colors, which some consumers consider undesirable. The objective of this study was to investigate the effects of BGS and SCS on the biochemical and sensory qualities of value-added Turkish delight. In addition, the aim was to develop a very high-quality product that is both high in energy value and good in terms of health, with good consumer acceptability.
2. Materials and methods
The Turkish delight used in the research was produced on-site at the pilot plant of Tunceli University. In Turkish delight production, a cooker boiler was used that had a double-walled oil heater and was 110 × 110 × 50 cm in size. The cooker (Keskin Machinery Company, Antalya,
Turkey) had an electrically driven adjustable-speed stirrer. The granulated sugar (factory in Erzincan, Turkey), corn starch, and citric acid (Baghdad Spices, Kahramanmaraş, Turkey) used in Turkish delight production were obtained from a supermarket in Tunceli. Tunceli city tap water was used. The black grape and sour cherry fruit concentrates (65% Brix) used in the Turkish delight production were obtained from the Dimes Food processing factory in Tokat, Turkey.
2.1. Fruit-concentrated Turkish delight
In this study, black grape and sour cherry concentrates with 65% Brix were used separately at 2.5%, 5.0%, and 7.5% (w/w) of black grape and sour cherry concentrates. Before adding raw materials into the cooker, the 3.5 kg of starch that would be used in Turkish delight production was dissolved in approximately 7–8 L of water to prepare a “starch milk”. Then the rest of the water and 20 kg of granulated sugar were poured into the cooker while stirring as the temperature was raised to 40 °C. Next, 30 g of citric acid was added and the temperature was raised to boiling. After the mixture started to boil (about 20 min), the steam fan was turned on. The fruit concentrates were added after 35 min of boiling and the mixtures was cooked for 20 min to complete the cooking. To be sure of homogeneity, 4–5 kg of product mass was removed through the drain valve and poured back into the cooker. All of the Turkish delight was poured from the bottom drain valve into wooden framed trays. The product was left sitting for 24 h at room temperature. After about 24 h, samples were manually cut by hand and then the necessary analysis was carried out.
2.2. Titratable acidity and pH
To extract the samples, 10 g of Turkish delight was mixed with 90 mL of distilled water in a beaker. The upper side of the beaker was then covered with Parafilm and left to sit for 30 min. At the end of this time, the mixture was homogenized using a homogenizer. The pH value was recorded after keeping the probes in the mixture for 15 min. The mixture was then stirred with the help of a glass stick, and then at 20 °C the pH measurement was carried out (Orion 3-Star pH meter, USA) (Cemeroğlu, 2011). At 20 °C, the total acidity of each mixture was monitored using the pH meter until pH 8.1 was reached after titration with 0.1 N NaOH. The calculation was done as % anhydrous citric acid in the sample (Altan, 2002).
2.3. Extraction of phenolic compounds
Turkish delight samples in very small sizes, weighing a total of 2 g, were put into centrifuge tubes and 20 mL of methanol-water (30:70, v/v) was added. These samples were homogenized for 1 min. The treated samples were stirred for 10 min using a mechanical shaker in an ultrasonic water bath. These samples were then centrifuged in a refrigerated centrifuge at 4 °C at 8500 rpm. After centrifugation for 20
min, the clear supernatant was collected and samples were stored in amber glass bottles at –24 °C prior to analysis (for a maximum of 4 weeks) for determination of antioxidant activity and phenolic compounds using a diphenyl picrylhydrazyl (DPPH) assay.
2.4. Total phenolic compounds
The determination of total phenolic compounds with a Folin–Ciocalteu reagent was done using the method of Singleton et al. (1999). Pure pyrocatechol (Merck) was used as the standard phenolic compound. A standard curve was created using a stock solution of 25 mg of pyrocatechol in 25 mL of distilled water. A 1-mL sample was taken and put into a 50-mL flask. The volume was brought to 46 mL by adding 1000 µL from a preprepared stock solution. Next, 1 mL of Folin–Ciocalteu reagent and, after 3 min, 3 mL of 2% Na2CO3 solution were added to the flasks. Thus, the total volume was 50 mL. The mixture was left for 2 h at room temperature in a dark place. The absorbance of the samples was then read with a spectrophotometer at 715 nm against distilled water. The control sample was prepared using distilled water. The amount of pyrocatechol was calculated corresponding to the absorbance value. Absorbance = 0.00209 × pyrocatechol + 0.00466, and the results were expressed as pyrocatechol equivalent.
2.5. Total antioxidant activity
A methanol stock solution of DPPH (24 mg/100 mL) was prepared immediately before use. The working solution was prepared by diluting the stock solution and then 150 mL of samples was put into the test tubes and DPPH solution was added to bring the solution volume to 2850 mL. The samples were left in a dark place and the reaction continued for 60 min. At the end of this period, the reading was done with a spectrophotometer (UV-1601, Shimadzu, Japan) at a wavelength of 515 nm. The antioxidant activity values of the samples of Turkish delight were expressed as % inhibition.
2.6. Color measurement
The methods described by CIE-LAB (1992) and Batu et al. (1997) were used to determine the color values of the Turkish delight. CIE L*a*b* color parameters were recorded as L* (lightness), a* (redness), and b* (yellowness) with a color difference meter (CRN300, Kangguang Instrument Co., China) using the transmission mode. Samples were put in a 5-cm3 glass cell and then color measurements were
taken. The results were expressed as follows: L*, a*, and b*, indicating lightness, redness, and yellowness, respectively.
2.7. Sensory analysis
The Turkish delight samples were evaluated by 11 panelists who were faculty members of the Tunceli University Department of Food Engineering. The 6 samples with fruit concentrate were offered to the panelists for sensory evaluation using a sensory evaluation form developed
by Kurtcan and Gönül (1987). Each sample was given a product code and the order was randomized. Samples were presented to the panelists on white plates. Panelists were informed about the types of products being tested before beginning the assessment and the panelists were trained in the use of the evaluation form specifically for Turkish delight. Panelists were asked to rate the samples for appearance, color, aroma, and overall acceptability scores on a scale of 0–5 where 0 = very poor, 1 = bad, 2 = moderate, 3 = good, 4 = very good, and 5 = excellent. Each of the 11 panelists evaluated each Turkish delight sample at least 6 times.
2.8. Statistical analysis
Physical, chemical, and sensory analysis of both plain (control) and experimental samples was carried out using analysis of variance (one-way MANOVA). The differences between groups were determined using the Duncan multiple comparison test. The statistical analysis was done using SPSS 18.0 (Norusis, 1993).
3. Results
3.1. pH and titratable acidity
The pH values of the Turkish delight produced with BGS and SCS are provided in Table 1. The results of the study show that, in terms of pH and titratable acidity (TA) values, there were significant (P < 0.05) differences between the treatments. While the pH value of the control samples was highest (4.03), the pH values of the product decreased for both the fruit concentrates. For BGS concentrations, the lowest pH value (3.53) was obtained from the product produced with 7.5% BGS. This means that the addition of SCS produced slightly more acidic Turkish delight. However, there were significant differences in the results obtained by introducing the same amount of BGS and SCS. A significant difference in pH values was found between the various concentrations of syrup from the same fruit. The pH values showed a decrease of 0.13 between 2.5% and 5.0% concentrations, and of 0.05 between 5.0% and 7.5% concentrations. In terms of Turkish delight produced with SCS, the control yielded the highest pH value (4.03) and the product with 7.5% SCS had the lowest pH value (3.39). Naturally, there is a direct correlation between the increase in concentration and the decrease in pH (Table 1).
TA values varied significantly (P < 0.05) based on the concentrations of BGS and SCS used in its production. The lowest TA values were found in the control sample. The highest value was obtained from the Turkish delight produced with 7.5% SCS. The intermediary TA values increased to 0.108 between 2.5% and 5.0%, and to 0.067 between 5.0% and 7.5%, thus indicating that TA increases with higher fruit concentrations. The pH values of Turkish delight produced with BGS and SCS concentrations ranked from lowest to highest as 7.5% < 5.0% < 2.5% <
control. As can be seen from the results, the pH values changed depending on the quantity of BGS and SCS used. Naturally, this was inversely proportional to the increase in BGS and SCS used in Turkish delight production. Therefore, when increasing the fruit concentration, the acidity values also increased while the pH value decreased, as expected. This is due to the high concentration of citric acid and TA in BGS and SCS, which is then passed into the product mass. According to these results, the pH values of Turkish delight produced with BGS and SCS will be lower due to the increased fruit concentration.
3.2. Total phenolic substance and antioxidant activity
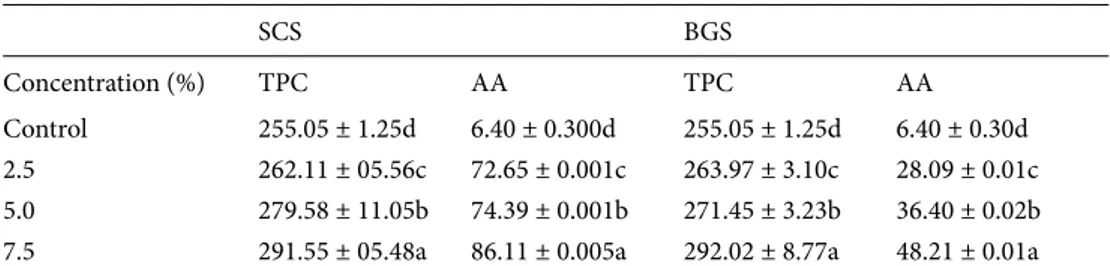
Total phenolic compound (TPC) and antioxidant activity (AA) changes in the Turkish delight produced with BGS and SCS are provided in Table 2. While the control samples produced the lowest value in terms of TPCs (255.05), the highest value (292.02) was found in samples produced with 7.5% BGS. In terms of TPCs, there was a significant difference between samples produced with BGS and SCS (Table 2). In terms of the AA, the research indicates that products produced with BGS and SCS were significantly (P < 0.05) impacted. The highest AA value for BGS Turkish delight (48.21%) came from the 7.5% treatment, while the lowest overall value (6.40%) belonged to the control treatments. AA levels were found to increase in conjunction with an elevation in the amount of fruit concentrate. Subsequently, the highest value of 86.11% belonged to the 7.5% SCS samples.
3.3. Changes in CIE-LAB color values
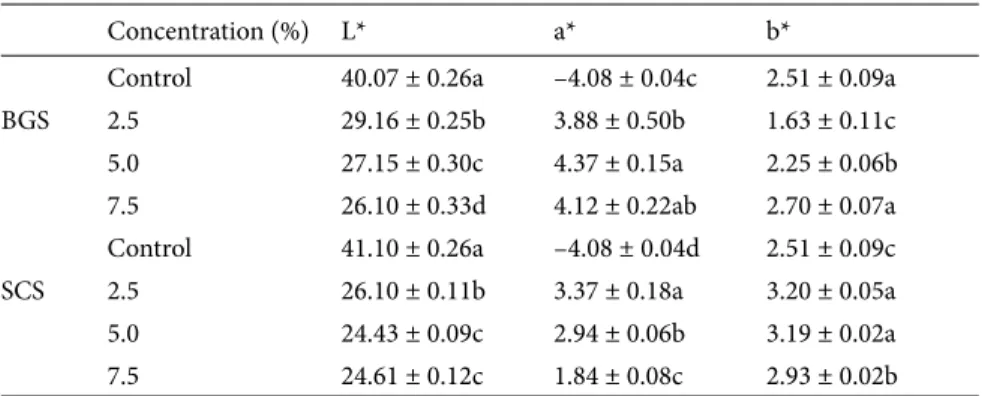
The color values of the Turkish delight produced with BGS and SCS are given in Table 3. The research shows that the differences between the L* values of the treatments were significant (P < 0.05). There was an inverse relationship between the L* values and the amount of fruit concentrate in the product mass. Subsequently, the highest L* values came from the control group (40.07). Of the samples containing fruit concentrates, the highest L* value was 26.10 and the lowest value was 24.43 in samples using the same amount of SCS. However, they seemed to be very close to each other, and there was a significant difference between the L* values of Turkish delight produced with BGS and SCS when compared to the control.
While differences in the L* values of treatments produced with additions of 5.0% and 7.5% BGS were found to be significant, the values for those produced with SCS were negligible. Not only were the colors of Turkish delight produced with SCS darker than colors of that produced with the same amount of BGS, but the L* values of Turkish delight produced with 2.5% SCS were darker than those of Turkish delight produced with 7.5% BGS (Figure). This could be due to the sour cherry fruit having more anthocyanins than the black grape concentrates. All samples indicated that the fruit concentration had a substantial effect on L* values. A significant decrease in L* asset value was observed as the percent of fruit juice concentration increased. Therefore, the effect of darkness
Table 1. The pH and TA values of lokum produced with BG and SC syrups (n = 7).
SCS BGS
Concentration (%) pH TA (%) pH TA (%)
Control 4.03 ± 0.003a 0.067 ± 0.004d 4.025 ± 0.003a 0.067 ± 0.004d
2.5 3.53 ± 0.005b 0.438 ± 0.000c 3.711 ± 0.006b 0.170 ± 0.004c
5.0 3.43 ± 0.003c 0.750 ± 0.025b 3.585 ± 0.003c 0.280 ± 0.003b
7.5 3.39 ± 0.003d 1.041 ± 0.000a 3.531 ± 0.005d 0.347 ± 0.099a
Different letters in the same columns indicate statistically significant (P < 0.05) differences between means.
Table 2. The TPC and AA values of lokum produced with BG and SC syrups (n = 7).
SCS BGS
Concentration (%) TPC AA TPC AA
Control 255.05 ± 1.25d 6.40 ± 0.300d 255.05 ± 1.25d 6.40 ± 0.30d
2.5 262.11 ± 05.56c 72.65 ± 0.001c 263.97 ± 3.10c 28.09 ± 0.01c
5.0 279.58 ± 11.05b 74.39 ± 0.001b 271.45 ± 3.23b 36.40 ± 0.02b
7.5 291.55 ± 05.48a 86.11 ± 0.005a 292.02 ± 8.77a 48.21 ± 0.01a
Different letters in the same columns indicate statistically significant (P < 0.05) differences between means. TPC: Total phenolic content (µg pyrocatechol); AA: antioxidant activity.
increases as the amount of concentrate present in Turkish delight increases.
Not enough research is available from earlier studies showing the relation between polyphenol content and the color of grape or sour cherry products. Thus, it was worth investigating what effect, if any, fruit juice concentration would have on its color. BGS and SCS in Turkish delight resulted in a darker color by decreasing the L* values, making the 2 inversely proportional. In other words, the lightness of product produced with BGS decreased by increasing the concentration of black grapes, and, therefore, the product became darker in color (Table 3). Likewise, when the concentration of sour cherry in the Turkish delight increased, the lightness decreased until a certain concentration, after which the color was fixed. Due to the increased concentration of SCS and BGS in the production of Turkish delight, if L* values were ordered numerically, the resulting sequence would correspond to 7.5% < 5.0% < 2.5% < control in terms of percentage
of fruit concentrate. The addition of both BGS and SCS, as well as a decrease in b* values, resulted in a reduction of the L* values. These factors have not previously been studied in Turkish delight production. In addition, thermal degradation of anthocyanins in product mass during cooking allows increased browning and makes the color of Turkish delight mass darker (Patras et al., 2010).
3.4. Sensory evaluation
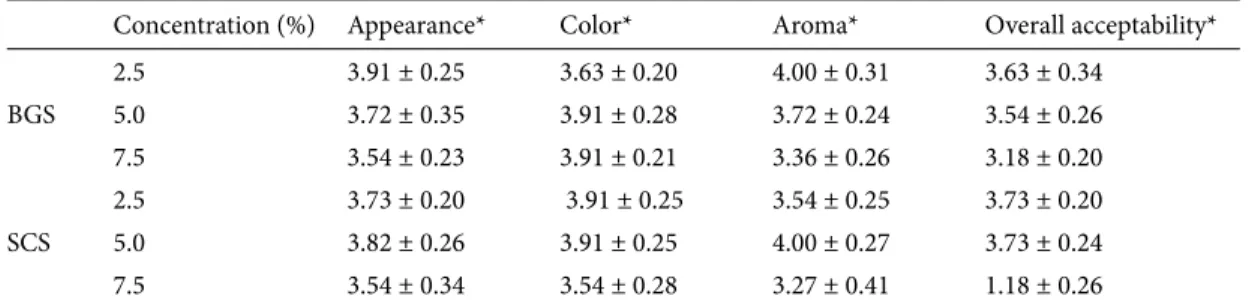
The sensory evaluation results are given in Table 4. The research shows that when evaluated collectively on appearance, color, aroma, and overall acceptability, the Turkish delight produced with 2.5% fruit concentrates scored highest, whereas the product produced with 7.5% had the lowest score. The samples were assessed by panelists at the end of a sensory evaluation. There was a downward trend in satisfaction as the fruit concentration increased. Additionally, the amount of water added in the product mass increased in parallel with the higher percentage of fruit juice concentration. This resulted in a decrease in the
Table 3. The L*a*b* values of Turkish delight produced with black grape and sour cherry
syrups (n = 7).
Concentration (%) L* a* b*
Control 40.07 ± 0.26a –4.08 ± 0.04c 2.51 ± 0.09a
BGS 2.5 29.16 ± 0.25b 3.88 ± 0.50b 1.63 ± 0.11c 5.0 27.15 ± 0.30c 4.37 ± 0.15a 2.25 ± 0.06b 7.5 26.10 ± 0.33d 4.12 ± 0.22ab 2.70 ± 0.07a Control 41.10 ± 0.26a –4.08 ± 0.04d 2.51 ± 0.09c SCS 2.5 26.10 ± 0.11b 3.37 ± 0.18a 3.20 ± 0.05a 5.0 24.43 ± 0.09c 2.94 ± 0.06b 3.19 ± 0.02a 7.5 24.61 ± 0.12c 1.84 ± 0.08c 2.93 ± 0.02b
Different letters in the same columns indicate significant (P < 0.05) differences between means.
BGS
SCS
2.5% 5.0% 7.5%
viscosity. Therefore, across all categories in this study, the firmness, chewiness, and consumer acceptability values of the products decreased as the amount of fruit concentrate (or water) was elevated. This could be due to the increased fruit concentration, which negatively impacted the sensorial qualities of the Turkish delight.
Despite this, all sensory values had relatively high scores for all the fruit concentrations. For BGS, while the samples with 2.5% concentrate had the best results in terms of appearance, flavor, and overall acceptability, the other samples produced with 5.0% and 7.5% BGS were favored in terms of color. In Turkish delight samples with SCS, the 5.0% SCS samples preformed best in terms of appearance and aroma, while the highest marks in terms of color and overall acceptability were awarded to the 2.5% SCS samples. In light of these values, it is possible to say that adding black grape or sour cherry concentrate to plain Turkish delight produces acceptable, even positive, results in the production of high-quality Turkish delight. In general, samples containing 2.5% black grape and sour cherry concentrate produced similar results, with higher scores than the other concentrations in terms of taste and overall acceptability.
4. Discussion
According to the research results, the TA ranking of the products produced with BGS and SCS was as follows: control < 2.5% < 5.0% < 7.5%. By increasing the fruit concentration in the Turkish delight mass, the acidity of the product is increased. This means that within an individual sample of Turkish delight, an increase in BGS and SCS results in a directly proportional increase in the TA values. Doyuran et al. (2004) reported that TA values changed from 0.07% to 0.08% and Dirik (2009) also reported the TA in his pomegranate Turkish delight to be 1.75%. These results are consistent with our research. Previous studies have reported the pH asset value of plain Turkish delight to be between 4.30 and 3.99 (Doyuran et al., 2004). İpek (2009) also reported it to be 4.49, while
Uslu et al. (2010) claimed that it ranged from 3.91 to 4.61. Özen (2008) produced a Turkish delight using black carrot juice concentrate with a reported pH value of 3.99 at 20 °C. In addition, Dirik’s (2009) pomegranate Turkish delight had a pH of 4.79. These results are partially in keeping with our results concerning BGS. However, the pH values obtained from Turkish delight with SCS were slightly lower than the others. This could be due to the higher acidity of sour cherries, resulting in a lower pH value. A strong inverse relationship was found between pH values and anthocyanin concentration in Turkish delight during the storage period (Özen et al., 2011).
The research results show that the ranking of both the BGS and SCS treatments in terms of TPC and AA values were control < 2.5% < 5.0% < 7.5%. The amount of TPC and AA increased in accordance with increases in the black grape and sour cherry fruit concentration. It is obvious that the AA and TPC values of Turkish delight produced with both fruit concentrates were higher than in the control. These quantities increased in proportion with increases in fruit concentrate. Black grapes are rich in terms of phenolic compounds and anthocyanins (Can et al., 2005). Similarly, sour cherries are also rich in phenolic compounds and anthocyanins (Robards et al., 1999; Blando et al., 2004). This richness in both fruits accounts for the corresponding increase in TPC and AA values of the samples tested in this study. Furthermore, the addition of black grape and sour cherry concentrates in Turkish delight results in a shorter cooking time. In order to preserve the phenolics and anthocyanins, which increase the TPC and AA values after being added to the Turkish delight solution, cooking time must be shorter. Another possible reason why the TPC and AA will not have significant increases is their dependence on the concentration values. Although Turkish delight produced from both SCS and BGS gave similar results in terms of TPC values, the product with SCS had higher AA results. If this is taken into consideration, the Turkish delight produced with SCS had about twice the amount of AA than that produced with BGS.
Table 4. Appearance, color, aroma, and overall acceptability scores of lokum produced with black grape and sour
cherry fruit syrups (n = 11).
Concentration (%) Appearance* Color* Aroma* Overall acceptability*
2.5 3.91 ± 0.25 3.63 ± 0.20 4.00 ± 0.31 3.63 ± 0.34 BGS 5.0 3.72 ± 0.35 3.91 ± 0.28 3.72 ± 0.24 3.54 ± 0.26 7.5 3.54 ± 0.23 3.91 ± 0.21 3.36 ± 0.26 3.18 ± 0.20 2.5 3.73 ± 0.20 3.91 ± 0.25 3.54 ± 0.25 3.73 ± 0.20 SCS 5.0 3.82 ± 0.26 3.91 ± 0.25 4.00 ± 0.27 3.73 ± 0.24 7.5 3.54 ± 0.34 3.54 ± 0.28 3.27 ± 0.41 1.18 ± 0.26
The color of grape juice is mainly influenced by the presence of various anthocyanins. Cyanidins are primarily responsible for magenta and crimson colors, while purple, mauve, and blue colors are due to the presence of delphinidins (Romero et al., 2008). The degradation of anthocyanins present in grape juice may undergo oxidative cleavage either as a direct reaction to ozone or as an indirect reaction caused by secondary oxidators or intermediate radicals (Tiwari et al., 2010). When sour cherry concentrate was used, the brightness (L*) decreased at first and then became fixed, meaning that it had reached the color saturation point. In addition, in terms of the color intensity of the Turkish delight, the samples with SCS reached the saturation point earlier than those with BGS. However, the L* values of samples produced with black grape and sour cherry concentrate were similar. Dirik (2009) stated that the average L* value of pomegranate Turkish delight was 79.55. It was reported that the L* value of product produced with black carrot juice concentrate at 20 °C was 26.02. Yıldız (2007) wrote that there were significant linear correlations among all CIE-LAB parameters of L*, a*, and b* values (from 0.58 to 0.93). All the CIE-LAB parameters were correlated with the total anthocyanin content. It was also reported that L* values were high in cultivars with low total anthocyanins, but the values fell rapidly as total anthocyanins increased. Therefore, L* has an inverse correlation with anthocyanins, meaning that if the L* value is higher, the anthocyanin content is lower. There was also a significant inverse correlation between a* values and the anthocyanin content of grapes, resulting in an elevated a* value while anthocyanins were low. The b* values followed the same pattern as the L* values. During the juice processing stages and, particularly during storage, the anthocyanin content decreased progressively and irreversibly, forming more stable polymeric pigments. These pigments are responsible for changing the grape juice aroma, color, and flavor. The initial increase in the lightness (L*) value is attributed to the partial precipitation of unstable suspended particles, followed by a decrease due to oxidative darkening (Corrales et al., 2009; Lianz et al., 2011).
The mean of the a* values (referring to redness) of the control samples was the lowest, with a value of –4.08. Additionally, while there was not a significant difference between 5.0% and 7.5% fruit concentrate for the BGS, the a* value was significantly lower for the 2.5% BGS Turkish delight. However, the a* values of the Turkish delight produced with 2.5% BGS were higher than those produced with 5.0% and 7.5% SCS. The samples produced with 2.5% SCS had the highest a* value at 3.37, whereas those produced with 7.5% SCS had the lowest with a value of 1.84.
The difference between the b* values from various treatments of Turkish delight produced with BGS was
significant (P < 0.05). The b* values changed in proportion to the fruit concentrate ratio. That is why the highest b* value (2.69) of the Turkish delight produced with BGS belonged to the 7.5% sample and the lowest (1.63) belonged to the Turkish delight produced with 2.5% BGS (Table 3). However, there was a statistical similarity between 7.5% BGS and the control samples. There was a significant difference (P < 0.05) between the Turkish delight samples produced with SCS. The b* values obtained from 7.5% SCS were significantly (P < 0.05) lower (2.93) when compared with 2.5% and 5.0% SCS. Besides this, a significant difference was observed between 2.5% and 5.0% in terms of b* values. The lowest value (2.51) occurred in the control group.
The a* values of Turkish delight produced with BGS were positive for each treatment, and they increased in conjunction with an elevation in the amount of fruit concentrate. Accordingly, the increase in a* value meant that there was an increase in the redness of the Turkish delight. It was obvious that b* values were also positive, and they seemed to increase in direct proportion to the concentration of black grapes and sour cherry during cooking time. The b* value (changing from blueness to redness) indicates yellowness in color. The pH decreased as the black grape and sour cherry concentrations increased, as expected. The colors cyanidin and delphinidin are located in the structure of black grapes and sour cherries. This situation is thought to cause the increase in the a* and b* values of the Turkish delight. Considering this information, it was concluded that an increase of fruit concentrate in the Turkish delight resulted in an increase in both the b* and redness values. Turkish delight produced with SCS had positive a* values during the cooking period, but a* was inversely proportional to the increase in the concentration of cherry. It was therefore concluded that a* values and redness values would decrease. The redness value of sour cherry is lower than that of black grapes. During cooking time the b* values of Turkish delight with SCS were found to be stable as the sour cherry concentration increased, and then they started to decrease again.
The color tones of cherries, grapes, plums, pomegranates, and vegetables such as red cabbage range from pink to purple according to anthocyanin group pigments. Anthocyanins are composed of phenolic substances called sugars, formed by a combination of anthocyanins (Cemeroğlu, 2011). The pH, metal ion content, processing method, and storage conditions influence the color intensity, which occurs due to anthocyanins (Shahidi and Naczk, 1995). Most of the color of anthocyanins changes depending on the degree of the pH and as such it can act as an indicator. Anthocyanins are purple-red at a low pH, whereas they appear blue-green
in color at a high pH (Saldamlı, 2007). The pH values of these Turkish delight samples were around 3.5, which is why they were in the low pH group. Thus, the color of the Turkish delight samples appeared within a range of purple-red tones. For pH differences, various plant tissues containing the same anthocyanins may be a different color. Much as when the acidity decreases the color and makes it weaker and more changeable, when the acidity is higher, the color is stabilized.
Cyanidin and peonidin are the anthocyanins present in sour cherry, whereas cyanidin and delphinidin are the anthocyanins for black grape. As the pH rises over 3, peonidin, cyanidin, and delphinidin appear blue in color (Cemeroğlu, 2011). As the SCS fruit juice concentration was increased in the production of Turkish delight, the lightness of the product decreased (making it darker). In the presence of blue media, the perception of the color red becomes difficult. As the brightness of it decreases, the blue hues overpower the red. Thus, in a direct contradiction of our expectations, the red color in the Turkish delight declined while the blue increased. For this reason, the L* values of products with SCS were lower than those with BGS. The probable reason for this anomalous result from the product with BGS is that the clarity of Turkish delight is not sufficient to be perceived as a red color. Dirik (2009) carried out a study on the production of a variety of Turkish delight products made with pomegranate juice and found the a* and b* values to be 0.11 and 7.61, respectively. Özen (2008) reported that when producing a Turkish delight with black carrot juice concentrate, the a* and b* values were 6.4 and –0.28, respectively, at 20 °C. These studies demonstrated significantly different results than our work. This is probably due to the use of different fruit and concentration ratios.
In terms of color, the Turkish delight samples with 5.0% and 7.5% fruit concentrate were seen as more desirable, but the opposite was true with regards to flavor. While the 2.5% fruit concentrate was deemed best overall, the 7.5% fruit concentrate samples scored the lowest. The sensory evaluation scores given by panelists showed that all treatments were seen as good in terms of appearance and
color, but the 5.0% and 7.5% concentrate samples were good for aroma, and the 2.5% Turkish delight was evaluated as the best overall. In terms of overall acceptability, the 2.5% and 5.0% fruit concentrates gave approximately the same results and the Turkish delight with 7.5% concentration scored lowest.
In recent years, research into the application and side effects of some drugs produced with modern medicine has generated more interest in herbal products and alternative medicine. Thus, consumers have begun to question industrially produced food products, weighing their benefits against potential risks. For a number of reasons, the use of natural substances over artificial sweeteners, colorants, etc. has become a societal expectation. It is very well known that fruit contains high levels of phenolic compounds and anthocyanins and that these compounds play an important role in the human body (radical scavenging, etc.). In addition, it was determined that adding fruit concentrate to Turkish delight caused an increase in the amounts of TPC and AA. Turkish delight is one of the most common traditional confectionery items consumed in Turkey. As phenolic substances and anthocyanins are important in terms of health, confectionary that uses these components (such as Turkish delight made with fruit concentrate) should be given preference. The cooking time must be shortened so as to not destroy the phenolics and anthocyanins. Another factor influencing the TPC and AA levels is the concentration value. Low figures here can lead to a lack of substantial increase for the TPC and AA levels. Although the products produced from both sour cherry and black grape concentrate gave similar results in terms of TPC values, Turkish delight produced with sour cherry concentrate yielded higher results in terms of AA. If this is taken into consideration, Turkish delight produced with sour cherry concentrate is about twice as high in terms of AA than Turkish delight produced with black grape.
Acknowledgments
This work is a part of the MSc thesis of Ali Arslan, which was supported by the Tunceli University Scientific Research Project Fund.
References
Altan A (2002). Laboratuar Tekniği. Ders Kitabı. Adana, Turkey: Çukurova Üniversitesi Ziraat Fakültesi (in Turkish).
Batu A (2006). Türk lokumu üretim tekniği ve kalitesi. Tekn Araşt GTED 1: 35–46 (in Turkish).
Batu A, Kirmaci B (2009). Production of Turkish delight (lokum). Food Res Int 42: 1–7.
Batu A, Thompson AK, Ghafir SAM, Rahman AN (1997). Minolta hunter renk ölçüm aletleri ile domates, elma ve muz’un renk değerlerinin karşılaştırılması. Gıda 4: 301–307 (in Turkish).
Blando F, Gerardi C, Nicoletti I (2004). Sour cherry (Prunus cerasus L.) anthocyanins as ingredients for functional foods. J Biomed Biotechnol 5: 253–258.
Burkhardt S, Tan DX, Manchester LC, Hardeland R, Reiter RJJ (2001). Detection and quantification of the antioxidant melatonin in Montmorency and Balaton tart cherry (Prunus cerasus). J Agr Food Chem 49: 4898–4902.
Cabaroğlu T, Yılmaztekin M (2006). Üzümün bileşimi ve insan sağlığı açısından önemi. In: Buldan Sempozyumu, 24–26 November 2006; Denizli, Turkey, pp. 999–1004 (in Turkish).
Çam A, Erdoğan MF (2003). Melatonin. Ankara Üniv Tıp Fak Mec 56:103–112 (in Turkish).
Can A, Özçelik B, Güneş G (2005). Meyve sebzelerin antioksidan kapasiteleri. In: GAP IV. Tarım Kongresi Bildiriler. 21–23 September 2005; Şanlıurfa, Turkey, pp. 1458–1461 (in Turkish). Cemeroğlu B (2011). Meyve ve Sebzelerin Bileşimi. Meyve ve Sebze
İşleme Teknolojisi-1. Ankara, Turkey: Nobel Yayın Dağıtım (in Turkish).
Chandra A, Nair MG, Iezzoni AF (1992). Evaluation and characterization of the anthocyanin pigments in tart cherries (Prunus cerasus L.). J Agr Food Chem 40: 969–976.
CIE-LAB (1992). Minolta Precise Colour Communication. Colour Control from Feeling to Instrumentation. Handbook. Osaka, Japan: Minolta Camera Company.
Corrales M, García AF, Butz P, Tauscher B (2009). Extraction of anthocyanins from grape skins assisted by high hydrostatic pressure. J Food Eng 90: 415–421.
Dirik A (2009). Nar ve nar suyunun lokum üretiminde kullanım olanakları. MSc, Harran University, Şanlıurfa, Turkey (in Turkish).
Doğan İS (2008). Hammadde ve sorunlarıyla Türk lokumu üretimi. Tekn Araşt GTED 1: 13–17 (in Turkish).
Doyuran SD, Gültekin M, Güven S (2004). Geleneksel gıdalardan lokum üretimi ve özellikleri. In: Geleneksel Gıdalar Sempozyumu. 23– 24 September 2004; Van, Turkey, pp. 334–342 (in Turkish). Fidan Y, Yavaş İ (1986). Üzümün insan beslenmesindeki değeri. In:
Gıda Sanayinin Sorunları ve Serbest Bölgenin Gıda Sanayine Etkileri Sempozyumu. 15–17 October 1986; Adana, Turkey, pp. 225–235 (in Turkish).
Gönül M (1985). Türk lokumu yapım tekniği üzerine araştırmalar. Ders Kitapları, 1. Baskı, Yayın No: 8. İzmir, Turkey: Ege Üniversitesi Mühendislik Fakültesi (in Turkish).
İpek D (2009). Üretim aşamaları ve farklı ambalajlama tekniklerinin lokum kalitesine etkisi. MSc, Çanakkale Onsekiz Mart University, Çanakkale, Turkey (in Turkish).
Kurtcan Ü, Gönül M (1987). Gıdaların duyusal değerlendirilmesinde puanlama metodu. Ege Üniv Müh Fak Der Seri B Gıda Müh 5: 137–146 (in Turkish).
Liang Z, Sang M, Fan P, Wu B, Wang L, Yang S, Li S (2011). CIELAB coordinates in response to berry skin anthocyanins and their composition in vitis. J Food Sci 76: 490–497.
Norusis MJ (1993). SPSS for Windows: Base System User’s Guide. Chicago, IL, USA: SPSS.
Orak HH (2007). Total antioxidant activities, phenolics, anthocyanins, polyphenoloxidase activities of selected red grape cultivars and their correlations. J Food Eng 79: 271–278. Özen G (2008). Siyah havuç suyu konsantresinin Türk lokumunda
renklendirici olarak kullanılması ve depolama stabilitesinin belirlenmesi. MSc, Selçuk University, Konya, Turkey (in Turkish).
Özen G, Akbulut M, Artık N (2011). Stability of black carrot anthocyanins in the Turkish delight (lokum) during storage. J Food Proc Eng 34: 1282–1297.
Patras A, Nigel P, Brunton NP, O’Donnell C, Tiwari BK (2010). Effect of thermal processing on anthocyanin stability in foods; mechanisms and kinetics of degradation. Trend in Food Sci Tech 21: 3–11.
Robards K, Prenzler PD, Tucker G, Swatsitang P, Glover W (1999). Phenolic compounds and their role in oxidative processes in fruits. Food Chem 66: 401–436.
Romero I, Sanchez-Ballesta MT, Escribano MI, Merodio C (2008). Individual anthocyanins and their contribution to total antioxidant capacity in response to low temperature and high CO2 in stored cardinal table grapes. Postharvest Biol Tech 49: 1–9.
Saldamlı İ (2007). Karbonhidratlar. Gıda Kimyası. Ankara, Turkey: Hacettepe Üniversitesi Yayınları.
Serteser A, Gök V (2003). Doğal antioksidanların biyoyararlılığı. In: 3. Gıda Mühendisligi Kongresi. 2–4 October 2007; Ankara, Turkey, pp. 83–98 (in Turkish).
Shahidi F, Naczk M (1995). Food Phenolics. Lancaster, PA, USA: Technomic Publishing Company.
Singleton VL, Orthofer R, Lamuela-Raventos RM (1999). Analysis of total phenols other oxidation substrates and antioxidants by means of Folin-Ciocalteu reagent. Oxidan Antioxidan 299: 152–178.
TGK (2004). Turk Gıda Kodeksi. Lokum Tebliği. Resmi Gazete. 22.05.2004–25469. Ankara, Turkey: TGK (in Turkish). Tiwari BK, Patras A, Brunton N, Cullen PJ, O’Donnell CP (2010).
Effect of ultrasound processing on anthocyanins and colour of red grape juice. Ultrason Sonochem 17: 598–604.
Uslu MK, Erbaş M, Turhan İ, Tetik N (2010). Nişasta miktarının ve coven suyu ilavesinin lokumların bazı özellikleri üzerine etkileri. Gıda 35: 331–337 (in Turkish).
Yıldız SD (2007). Enoant ve sağlık üzerine etkileri. Tekn Araşt GTED 1: 65–70 (in Turkish).