Research paper
Glucocorticoid de
ficiency causes transcriptional and post-transcriptional
reprogramming of glutamine metabolism
Meltem Weger
a,⁎
,1, Benjamin D. Weger
a,2, Benjamin Görling
b,3, Gernot Poschet
c, Melek Yildiz
d, Rüdiger Hell
c,
Burkhard Luy
b, Teoman Akcay
e, Tülay Güran
f, Thomas Dickmeis
g, Ferenc Müller
h, Nils Krone
i,j,⁎
a
Institute of Metabolism and Systems Research, College of Medical and Dental Sciences, University of Birmingham, Birmingham B15 2TT, UK
b
Institute for Organic Chemistry and Institute for Biological Interfaces 4– Magnetic Resonance, Karlsruhe Institute of Technology, Hermann-von-Helmholtz-Platz 1, 76344 Eggenstein-Leopoldshafen, Germany
c
Centre for Organismal Studies (COS), Heidelberg University, 69120 Heidelberg, Germany
dKanuni Sultan Süleyman Education and Research Hospital, Küçükçekmece, Istanbul, Turkey e
Istinye University Gaziosmanpasa Medical Park Hospital Gaziosmanpasa, Istanbul, Turkey
f
Marmara University, Department of Pediatric Endocrinology and Diabetes, Pendik, Istanbul, Turkey
g
Institute of Toxicology and Genetics, Karlsruhe Institute of Technology, Hermann-von-Helmholtz-Platz 1, 76344 Eggenstein-Leopoldshafen, Germany
h
Institute of Cancer and Genomic Sciences, College of Medical and Dental Sciences, University of Birmingham, Birmingham B15 2TT, UK.
iDepartment of Oncology & Metabolism, University of Sheffield, Sheffield S10 2TH, UK
jDepartment of Biomedical Science, The Bateson Centre, Firth Court, Western Bank, Sheffield S10 2TN, UK.
a b s t r a c t
a r t i c l e i n f o
Article history: Received 16 August 2018
Received in revised form 7 September 2018 Accepted 13 September 2018
Available online 26 September 2018
Background: Deficient glucocorticoid biosynthesis leading to adrenal insufficiency is life-threatening and is asso-ciated with significant co-morbidities. The affected pathways underlying the pathophysiology of co-morbidities due to glucocorticoid deficiency remain poorly understood and require further investigation.
Methods: To explore the pathophysiological processes related to glucocorticoid deficiency, we have performed global transcriptional, post-transcriptional and metabolic profiling of a cortisol-deficient zebrafish mutant with a disrupted ferredoxin (fdx1b) system.
Findings: fdx1b−/−mutants show pervasive reprogramming of metabolism, in particular of glutamine-dependent pathways such as glutathione metabolism, and exhibit changes of oxidative stress markers. The glucocorticoid-dependent post-transcriptional regulation of key enzymes involved in de novo purine synthesis was also affected in this mutant. Moreover, fdx1b−/−mutants exhibit crucial features of primary adrenal insufficiency, and mirror metabolic changes detected in primary adrenal insufficiency patients.
Interpretation: Our study provides a detailed map of metabolic changes induced by glucocorticoid deficiency as a consequence of a disrupted ferredoxin system in an animal model of adrenal insufficiency. This improved path-ophysiological understanding of global glucocorticoid deficiency informs on more targeted translational studies in humans suffering from conditions associated with glucocorticoid deficiency.
Fund: Marie Curie Intra-European Fellowships for Career Development, HGF-programme BIFTM, Deutsche Forschungsgemeinschaft, BBSRC.
© 2018 The Authors. Published by Elsevier B.V. This is an open access article under the CC BY license (http:// creativecommons.org/licenses/by/4.0/). Keywords: Zebrafish Ferredoxin Adrenal insufficiency Oxidative stress Purine metabolism 1. Introduction
Glucocorticoids (GCs) are crucial regulators of important physiolog-ical functions including metabolism [45]. Key steps in GC biosynthesis require mitochondrial cytochrome P450 (CYP) type 1 enzymes that are dependent on NADPH-derived electrons to catalyse their oxidative reactions [58,59]. Mitochondrial electron transfer during GC biosynthe-sis crucially relies on the iron-sulfur (Fe/S) protein ferredoxin [adrenodoxin, (FDX1)] [58,59].
Mutations in steroidogenic enzymes involved in GC biosynthesis cause a variety of inborn conditions in humans with associated
⁎ Corresponding authors.
E-mail addresses:meltem.weger@epfl.ch(M. Weger),n.krone@sheffield.ac.uk
(N. Krone).
1 Current address: Brain Mind Institute, École polytechnique fédérale de Lausanne, 1015
Lausanne, Switzerland.
2
Current address: Institute of Bioengineering, École polytechnique fédérale de Lausanne, 1015 Lausanne, Switzerland.
3
Current address: Bruker BioSpin GmbH, Silberstreifen 4, 76,287 Rheinstetten, Germany.
https://doi.org/10.1016/j.ebiom.2018.09.024
2352-3964/© 2018 The Authors. Published by Elsevier B.V. This is an open access article under the CC BY license (http://creativecommons.org/licenses/by/4.0/).
Contents lists available atScienceDirect
EBioMedicine
pathophysiology [57,58]. Individuals with impaired GC biosynthesis have either a primary adrenal defect or suffer from secondary adrenal insufficiency due to a problem in the pituitary gland. Both types of adre-nal insufficiencies are linked to impaired health status including in-creased mortality and morbidity as well as reduced quality of life in patients [5,21,57]. Current GC replacement regimens in patients strug-gle to replace GCs in a physiological manner and do not completely re-store the health status [36]. This might be part of the observed health problems in patients with adrenal insufficiency. However, only limited information is available on global metabolic changes and pathway dys-regulation in GC deficiency, which are likely to play a significant role for the observed pathophysiology and associated co-morbidity in humans. Importantly, conditions associated with isolated GC deficiency in humans are very rare. Therefore, research into the physiological role of GCs and associated disorders greatly benefits from animal in vivo models allowing for comprehensive tissue sampling or application of transgenic techniques unfeasible in humans.
The zebrafish (Danio rerio) is a well-established vertebrate model for understanding gene function in embryonic development, disease, and metabolism [35,50,67,68], including research on the endocrine system and stress [53]. Similar to humans, zebrafish are active during the day and use cortisol as their main GC [53]. A fully functional stress axis lead-ing to the release of cortisol by the interrenal gland, thefish counterpart to the mammalian adrenal gland [53], is present at four tofive days of development [32,38,76]. Several zebrafish mutants [19,23,33,60] and transgenic reporter lines [6,8,24,28–30,37,44,63,75,76] of steroid hor-mone synthesis and action have been established. They allow for com-prehensive analysis of in vivo processes and for high-throughput compound screenings to identify novel drug targets. Zebrafish possess two paralogues of the human FDX gene, fdx1 and fdx1b, with fdx1b being specifically expressed in steroidogenic tissues [33,77] and serving as the only relevant electron donor for mitochondrial steroidogenesis. We have recently established an fdx1b zebrafish mutant line (fdx1b−/−) and showed that disruption of fdx1b leads to an impaired stress response and severe global cortisol deficiency in larvae [33].
Here, we explore the in vivo metabolic consequences of GC de fi-ciency due to a disrupted mitochondrial ferredoxin system in the fdx1b−/−mutant zebrafish line. The deficiency of multiple steps of GC biosynthesis and the resulting severity of GC deficiency in the fdx1b−/−mutants make this model particularly well suited for such studies. A combination of transcriptomics and metabolic profiling in fdx1b−/−mutants revealed an extensive reprogramming of metabolic pathways, including glutamine metabolism as well as significant changes in the linked glutathione and purine biosynthesis pathways. Remarkably, we identified post-transcriptional regulation of key en-zymes underlying some of these changes. A comparison of the fdx1b−/
−mutants with a zebrafish model of secondary adrenal insufficiency
(rx3 strong) revealed both overlapping and distinct transcriptional and metabolic changes in these two models of GC deficiency. Finally, blood samples from individuals with primary adrenal insufficiency showed altered amino acid concentrations consistent with the meta-bolic alterations in our fdx1b−/−mutants, suggesting a translational rel-evance to humans with GC deficiency.
2. Materials and methods 2.1. Zebrafish husbandry
Adult zebrafish (AB wild-type strain) were raised and bred accord-ing to standard methods [79]. Embryos were obtained by natural spawning and incubated at 28.5 °C in 1× E3 medium (5 mmol/l NaCl, 0.17 mmol/l KCl, 0.33 mmol/l CaCl2, 0.33 mmol/l MgSO4). The
develop-mental stages were determined in hours post-fertilization (hpf) as pre-viously described [41]. All procedures were approved by the Home Office, United Kingdom and carried out in line with the Animals (Scien-tific Procedures) Act 1986.
2.2. Phylogenetic analysis
The protein sequences of the examined genes (Table S1) were re-trieved from ENSEMBL v84 (GRCz10) and phylogenetic analysis was carried out as previously reported [40].
2.3. Treatment and sampling
fdx1b−/−mutants were identified due to their impaired visual back-ground adaptation (VBA) at 96 hpf as previously described [33]. Larvae (96 hpf) were exposed for 24 h with 25μM Dexamethasone (DEX; Sigma-Aldrich, #D1756) in E3 medium supplemented with 0.1% DMSO. Wild-type embryos/larvae were treated with 1 mM of the gluta-minase inhibitor 6-Diazo-5-oxo-L-norleucine (DON; Sigma-Aldrich, #D2141) in E3 medium at 72 hpf and 96 hpf for 24 h and 48 h, respec-tively. For subsequent processing, larvae were either snap frozen in liq-uid nitrogen at 120 hpf for RNA extraction or fixed in 4% paraformaldehyde for whole-mount in situ hybridization.
2.4. Total RNA extraction
20 larvae were sampled and homogenized in QIAzol lysis reagent (Qiagen, # 79306) and stored overnight at−80 °C. Samples were then passed several times through a syringe (BD Microlance, 0.5 × 25 mm, #3086982), and RNA was extracted using the RNeasy Plus Universal Kit (Qiagen, #73442) according to the manufacturer's instructions. The integrity and quality of the total RNA was checked on an agarose gel and NanoDrop spectrometer (Thermo Scientific). Only RNA with A260/280 ratio≥ 2 and A260/230 ratio ≥ 1 was used for subsequent analysis.
2.5. cDNA synthesis and quantitative RT-PCR (qRT-PCR)
cDNA synthesis was carried out with 1μg RNA using the SuperScript VILO cDNA Synthesis Kit (LifeTechnologies, #11754-050). Expression levels of the examined genes were examined with Power SYBRGreen PCR Master Mix (Thermofisher, #4367659) according to the manufac-turers protocol. Primer sequences for the examined genes are listed in Table S2.
2.6. Whole-mount in situ hybridization
Both the generation of probes using gene-specific oligos summa-rized in Table S3 and whole-mount in situ hybridizations were carried out as previously described [77]. cyp17a2 expression was used to deter-mine the size of the interrenal gland using Image J software.
Research in context section
Impaired glucocorticoid biosynthesis severely impacts on human health. The pathophysiological mechanisms of altered me-tabolism due to glucocorticoid deficiency are not precisely under-stood and warrant further investigation. Such an endeavor is, however, almost impossible in humans. Here, we employed a zebrafish mutant with impaired mitochondrial glucocorticoid bio-synthesis to explore global changes in metabolites and gene ex-pression at both the transcriptional and post-transcriptional level. We have defined glucocorticoid-dependent changes in sev-eral metabolic pathways, including glutamine metabolism and linked pathways such as glutathione metabolism and de novo pu-rine synthesis. Our study will help to focus clinical studies in rare human conditions associated with glucocorticoid deficiency.
2.7. Human study
Five participants with primary adrenal insufficiency followed at the pediatric endocrinology clinic at Kanuni Sultan Süleyman Education and Research Hospital were enrolled. All patients were on regular hy-drocortisone treatment before the study. Patients were admitted to the hospital and monitored for general well-being, heart rate, blood pressure and blood sugar. Plasma samples were obtained after an over-night fast between 7 and 9 a.m. at on-treatment state. After 48 h of dis-continuation of hydrocortisone treatment plasma sampling was repeated at fasting and off-treatment state at 7–9 a.m. Plasma samples were frozen and stored at−80 °C until further analysis. Cortisol-sufficient (“On-treatment”) and cortisol-deficient (“Off-treatment”) states in patients were monitored by measuring plasma ACTH concen-trations. No adverse events related to discontinuation of treatment for 48 h in the hospital settings were observed. The study design was ap-proved by the local ethical committee (Approval number 10840098–604.01.01−E.4622). Written consent was obtained from the families of the participating patients.
2.8. Next generation sequencing (RNA-seq)
RNA of 20 larvae (120 hpf; three biological replicates) was extracted as described above. RNA integrity was checked with a 2100 Bioanalyzer (Agilent). cDNA libraries were generated using the TruSeq Stranded Total RNA Sample Prep Kit with the Ribo-Zero Gold depletion set (Illumina) following the manufacturer's protocol. The libraries were se-quenced on the Illumina Hiseq 2500 as single-end 50 base. Image anal-ysis and base calling were performed using RTA 1.18.61 and bcl2fastq 1.8.2.
2.9. Metabolic profiling 2.9.1.1H NMR spectroscopy
The metabolic study using NMR-Spectroscopy was carried out with fdx1b−/−and wild-type siblings larval extracts (25 larvae/sample; at least four biological replicates) as described in detail in [74].
2.9.2. PLC-FCS and IC-CD
Adenosine compounds, thiols and free amino acids were extracted from 30 larvae (120 hpf, infive biological replicates) with 0.3 ml of 0.1 M HCl in an ultrasonic ice-bath for 10 min. The resulting homoge-nates were centrifuged twice for 10 min at 4 °C and 16.400 g to remove cell debris. Adenosines were derivatized with chloroacetaldehyde as previously described [9] and separated by reversed phase chromatogra-phy on an Acquity BEH C18 column (150 mm × 2.1 mm, 1.7μm, Waters) connected to an Acquity H-class UPLC system. Prior separation, the col-umn was heated to 42 °C and equilibrated with 5 colcol-umn volumes of buffer A (5.7 mM TBAS, 30.5 mM KH2PO4 pH 5.8) at aflow rate of 0.45 ml m1. Separation of adenosine derivates was achieved by in-creasing the concentration of buffer B (2/3 acetonitrile in 1/3 buffer A) in buffer A as follows: 1 min 1% B, 1.6 min 2% B, 3 min 4.5% B, 3.7 min 11% B, 10 min 50% B, and return to 1% B in 2 min. The separated derivates were detected byfluorescence (Acquity FLR detector, Waters, excitation: 280 nm, emission: 410 nm, gain: 100) and quantified using ultrapure standards (Sigma). Determination of amino acid levels was done as described in Weger et al. [74]. Total glutathione was quantified by reducing disulfides with DTT followed by thiol derivatization with thefluorescent dye monobromobimane (Thiolyte, Calbiochem). For quantification of GSSG, free thiols were first blocked by NEM followed by DTT reduction and monobromobimane derivatization. GSH equiva-lents were calculated by subtracting GSSG from total glutathione levels. Derivatization was performed as described in Wirtz et al. [82]. UPLC-FLR analysis was carried out using the system described above. Separation was carried out using the above described UPLC-FLR system with a bi-nary gradient of buffer A (100 mM potassium acetate, pH 5.3) and
solvent B (acetonitrile) with the following gradient: 0 min 2.3% buffer B; 0.99 min 2.3%, 1 min 70%, 1.45 min 70%, and re-equilibration to 2.3% B in 1.05 min at aflow rate of 0.85 ml min-1. The column (Acquity BEH Shield RP18 column, 50 mm × 2.1 mm, 1.7μm, Waters) was main-tained at 45 °C and sample temperature was kept constant at 14 °C. Monobromobimane conjugates were detected by fluorescence at 480 nm after excitation at 380 nm after separation.
For absolute quantification by HPLC of amino acids in human blood samples,fluorescence derivatisation followed by separation with an Acquity H-class UPLC system (Waters) andfluorescence detection was employed. Data acquisition and processing was performed with the Em-power3 software suite (Waters). Organic acids were quantified by ion chromatography and conductivity detection after cation suppression with an ICS-3000 system (Dionex). Data acquisition and processing was performed with the Chromeleon 6.7 software (Dionex).
2.10. Data analysis
2.10.1. RNA-seq data processing and analysis
Single-end reads were mapped onto the zebrafish genome (GRCz10) using STAR 2.3.8 [17]. A custom Perl script was used to count uniquely mapped reads for each annotated gene locus (ENSEMBL v84) at both ex-onic and intrex-onic regions as described [4]. Data was analysed using DESeq2 [54]. RNA-seq raw data for the rx3 mutants was retrieved from our previous study [74] available at NCBI's Gene Expression Omnibus [20] (GSE76073) and reanalysed to assess differential gene expression between rx3 strong (lack of eyes and GC-deficient) and rx3 weak mu-tants (only lack of eyes). To assess the interaction between differential expressed genes of fdx1b−/−mutants and rx3 mutants, we applied a model to the counts of each gene: ~phenotype + mutated_gene + time + phenotype:mutated_gene (where mutated_gene is rx3 or fdx1b, phenotype is wild-type or mutant and time is the Zeitgeber time). To determine the statistical significance for the interaction term, we used a likelihood ratio test to compare the full model and a reduced model that contains all experimental factor of the full model excluding the interaction term (phenotype:mutated_gene).
Total RNA sequencing allows the quantification not only of reads mapped to exons (mRNA) but also of those mapped to introns (pre-mRNA) [4,26]. To assess changes in mRNA and pre-mRNA level between fdx1b−/−mutants and wild-type siblings, we applied the exon-intron split analysis (EISA) described in [25]. The exon/intron ratio was used as a proxy for relative mRNA half-life. Additional publicly available RNA-seq based expression data [12,18,81] were analysed using DESeq2 [54].
2.10.2. Gene set enrichment analysis
Gene sets were retrieved from GO ontology [64], KEGG based meta-bolic pathways manually redefined for zebrafish [74], Ingenuity Path-way Analysis (Qiagen) and MSigDB C2 canonical pathPath-ways [49]. We defined the gene set of ACTH targets from [84]. To perform gene set en-richment analysis for differentially expressed genes and interaction be-tween rx3 strong and fdx1b−/−mutants, we employed the camera function of the limma package [83] using linear model experimental factors detailed in RNA-seq data processing and analysis. Gene set en-richment analysis was visualized using barcode plots of the limma pack-age [83]. Briefly, t-stats from the linear model were ranked from largest to smallest (from left to right). The position of the chosen gene set are marked by vertical bars representing a barcode. The relative enrichment of the vertical bars is depicted by enrichment worm above the barcode. 2.10.3. NMR based data and metabolic profiling
Data were log transformed for HPLC based methods or a variance stabilizing transformation was applied to the data from the NMR based measurements [42]. We subsequently fit a linear model ~genotype*treatment for each metabolite (HPLC based) or each peak (NMR) (Table S4). Metabolite differences between patients under
On-and Off-treatment conditions were assessed using a linear mixed-effects model. To this end, a full model wasfitted to the data: y ~ age + treatment + (1|ID), where y is the log2 normalized serum concentra-tion with a specific age at treatment condition (On/Off). 1|ID represents a patient specific random effect on the baseline. The full model was compared to a reduced model (y ~ age + (1| ID)) using a likelihood ratio test.
2.10.4. Multiple testing
All p-values presented in this manuscript were corrected for multi-ple testing using the method of Benjamini-Hochberg [7], if applicable. 2.11. Data availability
The data generated for this publication have been deposited in NCBI's Gene Expression Omnibus [20] and are accessible through GEO Series accession number GSE107547 and are available in Table S5. Reanalysed rx3 strong data are available in Table S6.
3. Results
3.1. Disruption of ferredoxin leads to profound transcriptional alterations in several metabolic pathways
The potential dysregulation of gene expression as a consequence of GC deficiency in fdx1b−/−mutants was analysed by RNA-seq from
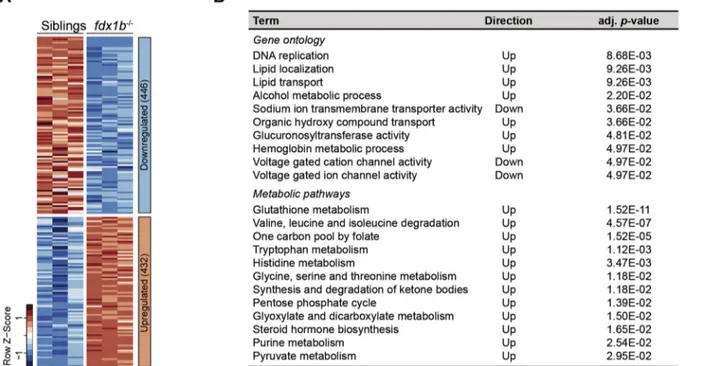
total RNA obtained from fdx1b−/−and wild-type sibling larvae at 120 hpf. The RNA-seq showed a high biological reproducibility as demon-strated by the strong correlation between biological replicates (R≥ 0.0993; Fig. S1A). Overall, the differential gene expression analysis iden-tified a down-regulation of 446 and an up-regulation of 432 genes in the fdx1b−/−larvae (adjusted p-value≤.01, |log2Fold change| ≥ 0.25;Fig. 1A and Table S5). By employing an enrichment analysis based on gene on-tology categories the most prominent functions in the fdx1b−/−gene set were identified. Down-regulated genes in fdx1b−/− larvae were
enriched in pathways for ion transport including sodium ion transmem-brane transporter activity, voltage gated cation and ion channel activity (Fig. 1B). Thesefindings appear to be consistent with the role of GCs in the osmoregulation infish larvae [71]. In contrast, we observed an en-richment of up-regulated genes in a broad range of metabolic pathways in fdx1b−/−mutants. This included pathways of lipid localization and transport, organic hydroxy compound transport as well as processes of alcohol, co-factor and haemoglobin metabolism (Fig. 1B). In addition, up-regulated genes were enriched in DNA replication and cell cycle as-sociated pathways (Fig. 1B and Table S7), supporting the observed im-portance of GCs for circadian regulation of cell proliferation in zebrafish larvae [16]. A further more specific analysis of metabolic path-ways based on KEGG annotation [74] identified an expected compensa-tory up-regulation of genes involved in steroid hormone synthesis in response to the disrupted steroidogenesis (Fig. 1B). In addition, an en-richment of pathways of energy metabolism was detected, which in-cluded the pentose phosphate cycle, pyruvate metabolism and synthesis as well as ketone degradation (Fig. 1B). Also, pathways lead-ing to the degradation of the amino acids valine, leucine, and isoleucine and the metabolism of tryptophan, histidine, glycine, serine, and threo-nine were found to be regulated. In addition, we found an up-regulation of the folate mediated one‑carbon metabolic pathway, of glyoxylate and dicarboxylate metabolism, of purine metabolism, and of glutathione metabolism (Fig. 1B). Overall, the systemic GC deficiency in fdx1b−/−mutant larvae resulted in an extensive transcriptional reprogramming of genes involved in a widespread set of metabolic pathways. In addition to anticipated pathways directly or indirectly linked to energy metabolism, also crucial biosynthetic pathways such as purine biosynthesis and the redox-buffering glutathione metabolism were affected.
3.2. fdx1b−/−larvae exhibit specific glucocorticoid-dependent metabolic alterations
An untargeted1H NMR spectroscopy analysis with aqueous larval
extracts of fdx1b−/−mutants and wild-type siblings was performed to assess if observed transcriptional changes in fdx1b−/−mutants affect metabolite concentrations. Principal component analysis (PCA) indi-cated clear differences in the metabolome between the fdx1b−/− mu-tants and their wild-type siblings (Fig. 2A). To understand the GC-dependent metabolic changes in fdx1b−/−mutants, we also analysed larvae treated with the synthetic GC dexamethasone (DEX). DEX treat-ment led to a general shift of the1H NMR spectra along principal com-ponent (PC) 1, and a closer clustering of the fdx1b−/−mutant with the control metabolome along PC2 (Fig. 2A). This suggests that GC treat-ment can rescue some of the changes observed in fdx1b−/−larvae. To identify the main metabolites altered by GC deficiency in fdx1b−/− lar-vae, we calculated the ratio of changes in mutants in the absence and presence of DEX for each NMR feature. This ratio indicates the extent of altered differences by GC treatment between fdx1b−/−larvae and wild-type siblings. The statistical significance of this ratio was deter-mined by calculating the interaction term between treatment and geno-type. Following this approach, we identified several significantly altered peaks, including those at 2.46 ppm and 1.48 ppm corresponding to glu-tamine and alanine, respectively (Fig. 2B and C). The abundance of glu-tamine increased, whereas alanine decreased in untreated fdx1b−/− larvae. The intensities of all identified peaks were different to the wild-type in untreated fdx1b−/− mutants, whereas wild-type and fdx1b−/− mutants showed similar patterns after DEX treatment (Fig. 2C), indicating GC-dependent rescue of the differences. Notably, both glutamine and alanine can serve as substrates for gluconeogenesis [10], and thus are highly relevant for endogenous glucose production. Glutamine also acts as key nitrogen source for the synthesis of biomol-ecules such as nucleotides and other amino acids [13]. Therefore, the ob-served alterations in these amino acids indicate a dysregulation of energy metabolism and synthesis of biomolecules in GC-deficient fdx1b−/−larvae and confirm the relevance of observed changes de-tected on transcriptomic level. By using targeted HPLC-based metabolic profiling, we expanded the assessment of metabolites to other amino acids and nucleotides (Table S4). This analysis confirmed the GC-dependent decrease in alanine and the increase in glutamine concentra-tions (Fig. 3A and C). In addition, histidine, which is degraded in a path-way eventually leading to the formation of glutamate, shows decreased concentrations in fdx1b−/−mutants (Fig. 3C). Expression of the genes encoding for the enzymes involved in these linked pathways broadly correlated with observed metabolite changes in fdx1b−/−mutant larvae (Fig. 3A and B).
3.3. Glutamine metabolism and linked pathways are affected in fdx1b−/− mutant larvae
Our explorative and untargeted analyses implied a key role of the metabolism of glutamine as a dysregulated pathway by GC deficiency. As glutamine and glutamate is linked with other major affected path-ways including energy metabolism as well as glutathione and purine metabolism, we focussed on the metabolism of glutamine and gluta-mate. In mammals, glutamine synthetase (GLUL) is responsible for the synthesis of glutamine from glutamate, whereas two glutaminases (GLS and GLS2) are responsible for glutaminolysis of glutamine into glu-tamate [2] (Fig. S2A). In silico, three paralogs of glutamine synthetase (Glula, Glulb, Glulc), two paralogs of glutaminase (Glsa, Glsb) and two paralogs of glutaminase 2 (Gls2a, Gls2b) as well as an additional novel Ensembl prediction termed Glsl were identified in zebrafish. The phylo-genetic analysis demonstrates clustering of the zebrafish glutamine synthetase and glutaminase proteins, except for Glsl, with their respec-tive orthologs in humans, mice and rats (Fig. S2B). Thisfinding suggests a conserved function of glutamine metabolism between vertebrates.
Only expression of the glutaminase gls2a and gls2b genes, but not of the glul genes, was significantly different between fdx1b−/−larvae and
wild-type siblings (Fig. 3D and Table S5). Since zebrafish larvae are not free feeding at the examined stage, increased glutamine concentra-tions in fdx1b−/− mutants are likely to be caused by impaired glutaminolysis due to reduced expression and function of glutaminases (gls2a and gls2b). qRT-PCR of wild-type and fdx1b−/−larvae raised in the absence or presence of DEX demonstrated a significant down-regulation of both gls2a and gls2b in fdx1b−/−larvae with an up-regulation in response to DEX treatment (Fig. 3E). Thisfinding suggests GC-dependent gene expression of the gls2a and gls2b genes. To better understand the physiological relevance of the affected glutaminase paralogs, the spatio-temporal expression of gls2a, gls2b, glsl, glsa and glsb was analysed. The reanalysis of a previously published develop-mental transcriptome data set including data from zygote stage to 120 hpf [81] showed that all glutaminases were expressed in larvae at 120 hpf with a maternal contribution mainly for glsb and gls2a (Fig. S2C). Whole-mount in situ hybridization in 120 hpf wild-type larvae showed specific gls2a expression in the liver, whereas gls2b is expressed in both liver and intestine (Fig. S2D). The other paralogs were mainly expressed in the larval brain (glsa, glsb) or in the swim bladder (glsl, glsb) (Fig. S2D). These data suggest that increased glutamine concentrations in fdx1b−/−mutant larvae is resulting from impaired glutaminolysis due to impaired GC-dependent transcription of liver and intestine spe-cific glutaminases (gls2a and gls2b).
3.4. fdx1b−/−mutants show profound changes in glutathione metabolism and markers of oxidative stress
The most enriched metabolic pathway in the fdx1b−/−mutants was glutathione metabolism (Fig. 1B; adj. p-value = 1.52E-11). Glutathione (GSH) is an antioxidant and a cellular signalling molecule, which is used by glutathione S-transferases (GSTs) to detoxify reactive oxygen species (ROS) [22]. The vast majority of GSTs were up-regulated in fdx1b−/− mutants (Fig. 4A and B) suggesting increased oxidative stress levels in fdx1b−/−larvae. On the biochemical level, increased concentrations of glutathione disulphide (GSSG) and a decrease in the GSH to GSSG ratio as marker of increased oxidative stress [22] were observed in the fdx1b−/−mutants (Fig. 4C). Thesefindings are further supported by a decrease of the antioxidant taurine and an increase of cysteine in fdx1b−/−larvae (Fig. 4C). In addition, the majority of Nrf2 (nuclear fac-tor E2-related facfac-tor 2) target genes were up-regulated in fdx1b−/− lar-vae (Fig. S3A and B). Since Nrf2 is the master regulator of genes mediating the response to oxidative stress [22], thisfinding is highly suggestive for systemically elevated oxidative stress levels in fdx1b−/− mutants. Importantly, DNA damage caused by oxidative stress has been implicated in human pathology [69]. Consistent with the detected increased levels of oxidative stress in fdx1b−/−mutants, genes impli-cated in double-strand break induced DNA repair (i.e., nonhomologous end joining and homologous recombination) are significantly up-regulated in fdx1b−/−mutants (Fig. S3C and D).
Remarkably, the increased transcript levels of the Nrf2 key target gene fth1a [11] and the antioxidant gene duox returned to wild-type levels by DEX treatment in fdx1b−/−larvae (Fig. S3E), indicating an im-portant role of GCs in the altered oxidative stress levels. However, on the biochemical level, GSH, GSSG and taurine concentrations remained significantly different between wild-type and mutant larvae after DEX treatment (Fig. 4C), indicating that GC deficiency might not be the only cause of altered oxidative stress levels in fdx1b−/−mutants. 3.5. Expression of key enzymes of de novo purine synthesis pathway is reg-ulated by glucocorticoids
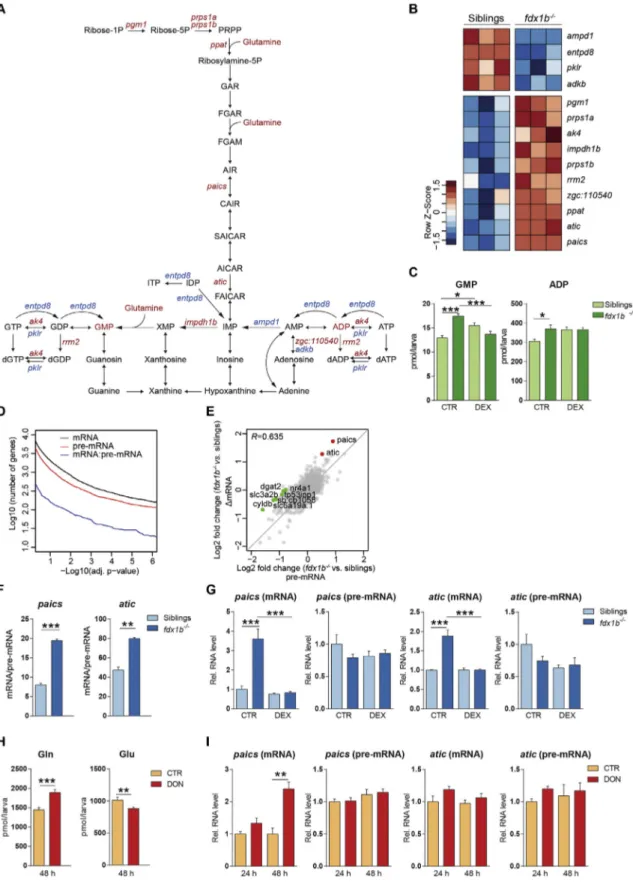
Another enriched metabolic pathway in the fdx1b−/−mutant larvae was the glutamine-dependent de novo purine synthesis pathway (Fig. 1B; adj. p-value = 2.54E-2). In fact, two enzymes of this pathway,
paics and atic (Fig. 5A and B), were among thefive most highly up-regulated genes in the transcriptome analysis (Table S5). Interestingly, the only four additional differentially expressed genes of de novo purine synthesis leading to inosine monophosphate (IMP) were all signi fi-cantly up-regulated in fdx1b−/−mutants (Fig. 5A and B). Several en-zymes of purine metabolism downstream of IMP also showed an altered mRNA abundance in fdx1b−/−mutants (Fig. 5A and B), but no clear trend for global up- or down-regulation of these genes was de-tected. However, on the biochemical level, both guanosine monophosphate (GMP) and adenosine diphosphate (ADP) concentra-tions were significantly increased in fdx1b−/−larvae (Fig. 5C).
Differ-ences between mutants and wild-type sibling larvae were decreased under DEX treatment, thus indicating the GC-dependency of these metabolites.
3.6. paics and atic are regulated by glucocorticoids in a post-transcriptional manner
The consequences of GC deficiency for altered post-transcriptional gene regulation were explored by employing an exon-intron split anal-ysis (EISA) [4,26]. Due to the generally lower read coverage of intronic reads, the number of differentially expressed genes at pre-mRNA level is slightly lower than genes at mRNA level (Fig. 5D). The correlation be-tween mRNA and pre-mRNA changes was high (Fig. 5E) indicating that differentially expressed genes in GC-deficient fdx1b−/−larvae are
pre-dominantly regulated at the transcriptional level. To identify post-transcriptionally regulated genes, we aimed to identify genes showing significantly higher changes in mRNA level (ΔmRNA) than changes in transcription (Δpre-mRNA). By following this approach, paics and atic were identified to have positive and significant ΔmRNA/Δpre-mRNA ra-tios in fdx1b−/−larvae (Fig. 5E). When using the mRNA/pre-mRNA ratio as a proxy for mRNA half-life [4], both paics and atic showed a signi fi-cantly higher mRNA stability in fdx1b−/−larvae than in wild-type sib-lings (Fig. 5F). Treatment of fdx1b−/−larvae with DEX reduced the mRNA of paics and atic back to levels observed in wild-type without changing pre-mRNA levels (Fig. 5G), indicating the increased mRNA sta-bility of paics and atic in fdx1b−/−mutants is a consequence of GC de fi-ciency. Given the importance of glutamine for de novo purine synthesis (Fig. 5A), we explored if the observed changes in glutamine metabolism with down-regulation of gls2a and gls2b in fdx1b−/−mutants are linked to the altered mRNA stability of paics and atic. Therefore, Gls was phar-macologically inhibited using 6-Diazo-5-oxo-L-norleucine (DON) in wild-type larvae to mimic the alteration in glutamine metabolism ob-served in fdx1b−/−mutants. 48 h of DON treatment significantly in-creased glutamine and dein-creased glutamate levels in wild-type larvae (Fig. 5H). Importantly, this treatment led to a selective increase in paics mRNA levels, whereas atic mRNA levels and the transcriptional rate of either gene remained unchanged (Fig. 5I).
To assess the relevance of glutamine concentrations in the observed effects, we analysed mRNA levels of paics and atic in a transgenic zebrafish model expressing an activated form of the Hippo pathway ef-fector yap1 [12]. Yap reprograms glutamine metabolism to increase nu-cleotide biosynthesis and these animals show increased GluI activity and subsequently elevated glutamine concentrations. Similar to the DON-treated larvae, only paics was differentially expressed in yap1 transgenic zebrafish (Fig. S4A). Surprisingly, despite increased gluta-mine concentrations the levels of paics mRNA were significantly lower in yap1 transgenic zebrafish than in wild-type (Fig. S4A). This observa-tion suggests that glutamine accumulaobserva-tion is not directly resulting in in-creased paics mRNA stability.
miRNAs are a prominent class of post-transcriptional regulators [34]. Therefore, we analysed differential gene expression of miRNAs between fdx1b−/−mutant and wild-type sibling larvae which we were able to detect in the total RNA-seq data set. dre-mir-2192 was the only detected miRNA, which was up-regulated in fdx1b−/−mutant larvae (adjusted p-value = .02; Fig. S4B). To test whether miRNAs affect gene expression of
Fig. 1. fdx1b−/−mutants show an extensive transcriptional reprogramming of energy and biomolecule generating metabolic pathways. (A) Heatmap of normalized mRNA expression levels of genes in fdx1b−/−mutant larvae and wild-type siblings. Red, high expression; blue, low expression. From in total 878 differentially expressed genes, 446 genes were down-regulated, and 432 genes were up-regulated in fdx1b−/−mutant larvae. (B) Gene set enrichment analysis of differentially expressed genes (fdx1b−/−vs. wild-type sibling larvae). Direction indicates whether the up- or down-regulated genes in fdx1b−/−mutants are enriched for the indicated term.
Fig. 2. Untargeted1H NMR spectroscopy analysis reveals changes in the metabolome of fdx1−/−mutant larvae. (A) Principal component analysis (PCA) score plots of the1H NMR spectra of
fdx1b−/−mutant and wild-type sibling larvae treated with dexamethasone (DEX) or vehicle as control (CTR). (B) Volcano plot represents the difference in fold change for each peak
between fdx1b−/−and wild-type sibling larvae under DEX and CTR treatment. Significant peaks are labeled. (C) Heatmap of peaks with a significant interaction. Red = high expression; blue = low expression. The assigned metabolites including glutamine and alanine are altered in fdx1b−/−mutant larvae under basal conditions, but not upon DEX treatment.
Fig. 3. fdx1b−/−mutant larvae exhibit alterations in gene expression related to alanine, aspartate and glutamate metabolism and in glutamine-family amino acids. (A) Schematic represents“alanine, aspartate and glutamate metabolism”, and glutamine-family amino acids. Altered metabolites and genes in fdx1b−/−larvae are indicated in red for up-regulation
and blue for down-regulation. (B) Heatmap showing differentially expressed genes of alanine, aspartate and glutamate metabolism in fdx1b−/−mutant larvae. (C) HPLC-based
measurements of metabolite levels of alanine (Ala), glutamine (Gln) and histidine (His) in fdx1b−/−mutant larvae and wild-type siblings in the in the absence (CTR) or presence of dexamethasone (DEX). (D) Fold change of glutamate metabolism genes of fdx1b−/−vs. wild-type sibling larvae. (E) qRT-PCR analysis of the zebrafish gls2a and gls2b in fdx1b−/−
mutant larvae and wild-type siblings (120 hpf) in the absence (CTR) or presence of dexamethasone (DEX).
Fig. 4. Dysregulations in glutathione metabolism and markers of oxidative stress in fdx1b−/−mutant larvae are only partially caused by glucocorticoid-deficiency. (A) Schematic illustrates
“glutathione metabolism”. Metabolites and genes of this pathway altered in fdx1b−/−larvae are marked in red for up-regulation and blue for down-regulation. (B) Heatmap showing
differentially expressed genes of glutathione metabolism in fdx1b−/−mutant larvae. (C) Metabolite levels of cysteine (Cys), reduced (GSH) and oxidized (GSSG) glutathione, taurine and the GSH/GSSG ratio as a measure of oxidative stress in fdx1b−/−mutant and wild-type sibling larvae in the absence (CTR) or presence of dexamethasone (DEX).
Fig. 5. Glucocorticoids regulate de novo purine synthesis at a post-transcriptional level. (A) Schematic of the“purine metabolism” pathway. Metabolites and genes of this pathway altered in fdx1b−/−mutant larvae are marked in red for up-regulation and blue for down-regulation. (B) Heatmap showing differentially expressed genes of purine metabolism in fdx1b−/− mutant larvae. (C) Metabolite levels of guanosine monophosphate (GMP) and adenosine diphosphate (ADP) in fdx1b−/−mutant and wild-type sibling larvae (120 hpf) in the absence
(CTR) or presence of dexamethasone (DEX). (D) Number of differentially expressed genes in function of the adjusted p-value grouped by the different levels at which they were assessed. mRNA (black), pre-mRNA (red), and genes that are differentially affected between mRNA and pre-mRNA (blue). (E) Comparison of pre-mRNA and mRNA expression changes in fdx1b−/− mutant larvae. R indicates Pearson correlation. Significantly deregulated genes at the level of Δexon-Δintron are labeled green. Predominantly post-transcriptional (ΔexonNΔintron) al-tered genes are shown in red. (F) mRNA half-life approximation of paics and atic in fdx1b−/−mutant and wild-type sibling larvae. (G) qRT-PCR analysis assessing mRNA and pre-mRNA levels of paics and atic in fdx1b−/−mutant and wild-type sibling larvae (120 hpf) in the absence (CTR) or presence of dexamethasone (DEX). (H, I) Glutamine (Gln) and glutamate (Glu) levels (H) and transcript levels of paics and atic (I) in wild-type larvae treated with the glutaminase inhibitor 6-Diazo-5-oxo-L-nor-Leucine (DON) or vehicle as a control (CTR).
atic and paics, we re-analysed a previously published RNA-seq data set of a murine DICER knock-out model with a liver-specific inactivation of miRNA biogenesis [18]. A small decrease in transcription and mRNA abundance of paics in DICER knock-out mice was observed (Fig. S4C), whilst atic mRNA abundance showed a stronger down-regulation. atic transcription as indicated by pre-mRNA abundance was not as strongly reduced as mRNA abundance (interaction p-value = .03; Fig. S4C), sug-gesting that atic is post-transcriptionally regulated by miRNAs. These data are consistent with a stabilization of atic mRNA due to miRNA de-pendent effects also in the zebrafish. Altogether, fdx1b−/− larvae
showed a pervasive reprogramming of purine metabolism, leading to changes of purine metabolite concentrations. In addition, we provide thefirst evidence for GC-dependent post-transcriptional regulation of key factors in purine synthesis.
3.7. fdx1b−/−mutants exhibit systemic changes distinct from a secondary adrenal insufficiency-like phenotype
To explore if metabolic changes observed in fdx1b mutant larvae are solely explained by the lack of GCs, we compared the results obtained from the fdx1−/−larvae to rx3 strong mutant larvae, another model for GC deficiency. Therefore, we reanalysed our recently published rx3 strong mutants RNA-seq data set ([74]; Fig. S5 and Table S6). fdx1b-/-mutant larvae present a phenotype similar to primary adrenal insuf fi-ciency in humans, including cortisol deficiency, down-regulation of GC-dependent marker genes, an up-regulation of the HPI axis ([33]; Fig. 6A) and interrenal hyperplasia (Fig. 6B). In contrast, the rx3 strong mutant larvae show a profoundly impaired synthesis of GCs due a re-duction in ACTH-producing corticotrope cells ([16];Fig. 6A). Indeed, ACTH target genes are mainly up-regulated in fdx1b−/−mutants (p = .008) and down-regulated in rx3 strong mutants (p = .006) (Fig. 6C). Thesefindings confirm the assumption that fdx1b mutant larvae resem-ble a primary adrenal insufficiency phenotype and that rx3 strong mu-tants can be used to model secondary adrenal insufficiency. Thus, we subsequently explored if these two zebrafish models of adrenal insuffi-ciency differ on a global gene expression level. A statistical model in-cluding an interaction term between the mutant type and the phenotype was employed to extract the differences between gene ex-pression changes in the fdx1b−/−and rx3 strong models compared to their respective controls. The next step assessed which GO term and KEGG-based metabolic gene sets were enriched in the differentially expressed genes with a significant interaction term. Pathways such as the ornithine urea cycle and branched-chain amino acids show the same changes in both mutants (see [74] for the rx3 strong and Fig. S6 for the fdx1b−/− mutants). However, several metabolic pathways showed enrichment for differences between fdx1b−/−and rx3 strong mutants (Fig. 6D and E). These pathways include sterol biosynthesis and steroid hormone biosynthesis (Fig. 6D–F). Consequent with the de-tected changes in ACTH levels, steroid hormone biosynthesis genes are up-regulated in fdx1b−/−and down-regulated in rx3 strong mutants (Fig. 6E and F).
Furthermore, glutathione metabolism was identified as a pathway with major alterations (Fig. 6D and E). Interestingly, GC-deficient fdx1b−/− mutants show an overall up-regulation (p = 1.52E-11), whereas rx3 strong mutants show no clear global up- or down-regulation of glutathione metabolism-associated genes despite having the same level of GC deficiency as the fdx1b−/−larvae. Consistent with
differential redox metabolism changes in the two mutants, Nrf2 target genes were mainly down-regulated in rx3 strong mutants (Fig. S3A and Table S6), in contrast to the fdx1b−/−situation (Fig. S3A). This fur-ther supports the conclusion reached above that the observed higher oxidative stress levels in fdx1b−/−mutants are only partially caused by the lack of GCs. Importantly, several other metabolic pathways, in-cluding tryptophan metabolism; valine, leucine and isoleucine degrada-tion; purine metabolism; alanine, aspartate and glutamate metabolism; and terpenoid backbone synthesis differ between both mutants (Fig. 6D and E). Overall, our data show profound global differences in the two types of GC deficiency models. Thus, such pathophysiological differ-ences in models of GC deficiency might most probably be caused by dys-regulation of other pathways and factors associated with the specific cause of impaired GC synthesis rather than only cortisol deficiency. 3.8. Patients with adrenal insufficiency show similar amino acid changes as fdx1b−/−zebrafish mutants
To explore if humans with primary adrenal insufficiency have simi-lar metabolic changes as observed in fdx1b−/−mutants, we performed targeted metabolic profiling of amino acids on blood samples from chil-dren with primary GC deficiency (Fig. 7A). Off treatment, patients showed changes in asparagine, lysine, phenylalanine, alanine, histidine, arginine, leucine and methionine concentrations (Fig. 7B). These data indicate that amino acid metabolism is strongly affected when GC re-placement is insufficient. Interestingly, alanine, arginine, leucine, methi-onine and phenylalanine concentrations are also lower in untreated fdx1b−/−larvae compared to DEX-treated fdx1b−/−larvae (Fig. 7C and Table S4). A smaller similarity was observed when comparing the data to rx3 strong mutants. Histidine and methionine were the only two out of the eight amino acids altered in patients, being similarly affected in rx3 strong mutants (Fig. 7C and Fig. S7). Thus overall, the metabolic profiles in patients with primary adrenal insufficiency correlate better with the metabolic profile observed in fdx1b−/−mutants than with
that of rx3 strong mutants. This further shows that there are differences between both types of GC deficiency models and that the fdx1b−/−
mu-tant recapitulates more closely metabolic changes of patients with pri-mary adrenal insufficiency.
4. Discussion
By combining transcriptomics and metabolic profiling, we detected reprogramming of metabolism, such as glutamine metabolism in GC-deficient fdx1b−/−mutant larvae. In line with this observation,
gluta-mine concentrations were increased in fdx1b−/−mutant larvae. Due to the relevance of glutamine for several linked metabolic pathways [13] which were also affected in fdx1b−/− mutants, we further characterised these pathways in the zebrafish model. Notably, we pro-vide thefirst spatio-temporal characterization of the zebrafish gluta-minase and glutamine synthetase genes at embryonic/larval stages, whereas some data on the synthetases are available in adult zebrafish [14]. Thus, our analysis provides a valuable source for future investiga-tion into the role of glutamine in cancer development and growth [2,13] using the zebrafish model [51,80]. Importantly, gls2a and gls2b were the only differentially expressed genes in glutaminolysis or syn-thesis in fdx1b−/−mutants, and were also responsive to GC treatment. Thisfinding supports the GC dependent regulation of the diurnal
Fig. 6. fdx1b−/−mutant larvae exhibit hallmarks of primary adrenal insufficiency and differ from rx3 strong mutant larvae reminiscent to secondary adrenal insufficiency. (A) Schematic
shows the different alterations in the pituitary and interrenal gland axis of fdx1b−/−and rx3 strong mutant larvae. Abbreviations: Pomca, pro-opiomelanocortin; ACTH, adrenocorticotropin; SG, steroidogenesis. (B) Whole-mount in situ hybridization of cyp17a2 to visualize the interrenal gland (arrow) in fdx1b−/−mutant larvae (n = 17) and wild-type siblings (n = 11) at 120 hpf stage. Bar plot shows the relative (rel.) changes in the diameter of the interrenal gland size. (C) Barcode plots for ACTH target genes in fdx1−/− mutant larvae (left) and rx3 strong mutant larvae (right). The two mutant types show opposing directions in the gene set enrichment (p-value = 1.7 E−04) for gene set enrichment analysis. (D) Gene set enrichment analysis of differentially expressed genes showing different regulation between fdx1b−/−and rx3 strong. (E) Barcode plots for metabolic pathways and Nrf2 target genes in fdx1b−/−mutant larvae (left) and rx3 strong mutant larvae (right) in comparison to the corresponding control (wild-type siblings or rx3 weak). (F) Fold
changes of differentially expressed genes in steroid hormone biosynthesis between mutant larvae and their corresponding controls. The data for the rx3 mutants is a reanalysis from our previously published data set [74]. Scale bar = 110μm. *, p b .05, **, p b .01, ***, p b .001.
transcription of gls2a [74], and the relevance of regulation of glutaminolysis by GCs. The GC dependent regulation of gls2a and gls2b, and the fact that zebrafish are not self-feeding at the examined stages, strongly suggests that increased glutamine levels in fdx1b−/− mutant larvae are likely to be caused by impaired glutaminolysis rather than by impaired glutamine synthesis.
Importantly, data on global metabolic changes in patients with adre-nal insufficiency are limited. Our clinical data obtained from patients with primary adrenal insufficiency indicate metabolic alterations simi-lar to observed changes in our fdx1b-deficient larval model. However, plasma of untreated patients does not show the major accumulation of glutamine detected in fdx1b−/−mutants. As glutamine metabolism involves several organs [73], the difference may be due to the larger set of tissues analysed in the whole larval extracts, but could also reflect species-specific differences in, for example, nitrogenic waste excretion [72]. Nevertheless, eight other amino acids showed lower plasma con-centrations in untreated patients, andfive of these were also lower in untreated fdx1b−/−mutants compared to DEX treatment. Furthermore, two of these amino acids were also changed in plasma samples of con-genital adrenal hyperplasia (CAH) patients under GC replacement ther-apy [3]. Asparagine and methionine were lower in patients with CAH treated with lower GC doses than in those receiving high doses of GC. Furthermore, the purine inosine was increased in patients receiving low dose GC treatment [3]. This correlates with the observed metabolic and broad transcriptional as well as post-transcriptional up-regulation of purine metabolism observed in untreated fdx1b−/−mutants. Of note, the metabolic alterations in patients with primary adrenal insuf fi-ciency show greater overlap with those seen in the fdx1b−/−mutant than with those in rx3 mutants. This observation indicates that such changes may be specific to primary adrenal insufficiency as opposed to conditions associated with secondary adrenal insufficiency. Overall, by determining metabolic alterations most likely specific to primary ad-renal insufficiency, our study expands the understanding into metabolic changes in patients with primary GC deficiency. Furthermore, overlap-ping alterations in larvae validate fdx1b−/−mutant as a model for met-abolic features of primary adrenal insufficiency.
To explore potential changes between primary and secondary adre-nal insufficiency, we compared our results from the fdx1b−/−mutant
with our previously published data set of rx3 strong mutants [74], which represents a model of secondary adrenal insufficiency. This anal-ysis showed clear differences in changed gene expression in the two systems consistent with the different causes of GC deficiency. Down-regulation of ACTH target gene expression and steroidogenic genes ex-pression in the ACTH-deficient rx3 strong model, in contrast to the up-regulation observed in fdx1b−/− mutants, support the notion that these different lines represent models of secondary and primary adrenal insufficiency, respectively. Furthermore, we found striking differences in the metabolic profiles between the rx3 strong and fdx1b−/−mutants.
This includes glutathione metabolism, which was the most affected pathway in fdx1b−/−mutants. The observed changes in glutathione me-tabolism suggest altered levels of oxidative stress, which have been im-plicated in pathogenesis by leading to metabolic dysfunction [46] or DNA lesions [69]. The up-regulation of Gst genes and Nrf2 target genes, as well as changes in GSH/GSSG ratio and taurine concentrations provide further evidence of increased oxidative stress in fdx1b−/− larvae.
The altered oxidative stress response in fdx1b−/−mutants is ex-pected to be caused by the lack of GCs. This appears surprising in light of observations that GC excess increases reactive oxygen production and suppresses the Nrf2 mediated antioxidant response by silencing Nrf2 target genes [1,43]. These effects result in increased oxidative stress and have been suggested to be a key mechanism for the adverse effect of GCs. The increased transcript levels of the Nrf2 target gene fth1 in the fdx1b−/−mutant larvae were restored by GC replacement suggesting a regulatory role of GCs in the oxidative stress response in zebrafish larvae. However, the detected changes in GSH/GSSG ratio
and taurine levels were only partially restored by GC replacement. Fur-thermore, the vast majority of Nrf2 target genes and genes of glutathi-one metabolism showed opposing transcriptional patterns between the GC-deficient fdx1b−/−and rx3 strong mutants, and thus the altered
oxidative stress levels in fdx1b−/−mutants cannot solely be explained by the lack of GCs. Given that steroid hormone synthesis is one of the main contributors to the production of reactive oxygen species in mito-chondria [65], it is tempting to speculate that the detected increase in oxidative stress in the fdx1b−/−mutant is a consequence of an increased electron leakage due to insufficient Fdx1b-mediated electron transfer during steroidogenesis. This assumption is supported by reports in ro-dents and human showing that defects in nicotinamide nucleotide transhydrogenase (NNT), a gene that is involved in the maintenance of the mitochondrial redox homeostasis, leads to disturbances in adrenal redox status and increased levels of oxidative stress [55,56,78]. Overall, it appears that GCs modulate the antioxidant response, but GC de fi-ciency might not directly lead to oxidative stress.
Although some evidence suggests GC-dependent post-transcriptional gene regulation in immune system and anti-inflammatory pathways [70], the wider understanding of post-transcriptional regulation of metabolic pathways by GCs remains elu-sive. Our study identified de novo purine synthesis as a metabolic path-way affected in fdx1b−/−mutants. We demonstrated the GC-dependent post-transcriptional regulation of two key enzymes in this pathway, paics and atic. The pharmacological inhibition of Gls revealed a correla-tion between regulacorrela-tion of paics with changes in glutamine or glutamine-linked pathways. This is in line with previous observations that glutamine can induce paics expression in human lung cancer cell lines [31]. However, glutamine levels per se seem not to induce paics mRNA levels, as YAP transgenic zebrafish which exhibit also increased glutamine levels [12] show repressed paics mRNA levels. Why is paics expression differentially affected in the two conditions of glutamine ac-cumulation? Thefirst committed and rate-liming entry of glutamine into de novo purine biosynthesis is catalysed by phosphoribosyl pyro-phosphate amidotransferase (ppat) [62]. Expression of this enzyme pos-itively correlates with paics mRNA levels in YAP transgenic (p = .0502) and fdx1b−/−mutants (p = .0006). Thus, lower expression of ppat in YAP transgenics may limit glutamineflux into the purine biosynthesis pathway, while glutamineflux would be increased in fdx1b−/−mutants.
This observation suggests that theflux of glutamine into de novo purine synthesis rather than absolute glutamine concentrations are most likely linked to paics mRNA stability.
In contrast, post-transcriptional regulation of atic appears to be glutamine-independent. miRNAs are key molecules for post-transcriptional regulation [34], and are promising candidates in the reg-ulation of paics and atic. Indeed, several miRNAs have been shown to regulate glutamine metabolism through targeting glutaminase expres-sion [27,52,66] and may thereby affect the purine biosynthesis pathway genes. In our study, we have identified the miRNA dre-mir-2192 as being differentially expressed in fdx1b−/−mutants. Importantly, dre-mir-2192 has been predicted to target metabolism infish species [39]. A murine deletion model of DICER shows only a slight decrease in both transcrip-tion and mRNA abundance of paics. The high correlatranscrip-tion of mRNA and pre-mRNA levels supports the assumption that the observed post-transcriptional changes of paics in fdx1b−/−mutants are driven by a miRNA-independent mechanism. atic shows an opposing profile as mRNA levels drop to a higher extent in DICER KO mice than those of pre-mRNA, suggesting that miRNAs are involved in the post-transcriptional stabilization of atic mRNA. However, a potential direct regulation of atic by mir-2192 would be rather surprising, as dre-mir-2192 would have to act through a yet undescribed mechanism sta-bilizing the transcript rather than targeting it for degradation. Alterna-tively, the regulation of atic by miRNAs might be indirect, for example, involving the destabilization of another regulator of atic, which then al-lows for stabilization of atic transcript levels. Such regulators inducing mRNA decay have been described in the context of GCs [15,61] and
the nutrient sensing mTOR pathway [47]. Intriguingly, dre-mir-2192 shares a seed match with atic but not paics at the 3’UTR [48]. Future work will be required to understand whether and how miRNAs regulate the post-transcriptional regulation of atic. Overall, our identification of GC mediated post-transcriptional regulation of the de novo purine syn-thesis pathway defines new research questions aiming at a detailed mechanistic understanding of the interconnections between GC signal-ling, glutamine metabolism and miRNA regulation.
In conclusion, our work provides a detailed characterization of the in vivo consequences of a disrupted ferredoxin system and GC
deficiency on metabolism at a transcriptional, post-transcriptional and metabolite level. Based on our characterization of two GC-deficient mutants, we propose that the fdx1b−/−and rx3 strong
mu-tant have translational capacity for future investigations into the pathogenesis of primary and secondary adrenal insufficiency. Given that zebrafish is a well-known model organism for performing high-throughput screenings, future applications of both models might include screenings to identify compounds that specifically tar-get the metabolic differences between patients with primary and sec-ondary adrenal insufficiency.
Fig. 7. Amino acid changes in plasma of patients with primary adrenal insufficiency overlap with changes observed in fdx1b−/−mutant larvae. (A) Hormonal features of patients with
primary adrenal insufficiency on hydrocortisone treatment and after 48 h interruption of therapy. (B) Levels of the amino acids asparagine (Asn), lysine (Lys), phenylalanine (Phe), alanine (Ala), histidine (His), arginine (Arg), leucine (Leu), and methionine (Met) in human patient plasma in On and Off treatment conditions. (C) Venn diagram showing the altered amino acids in human patients with primary insufficiency, fdx1b−/−and rx3 strong mutants between untreated and treated conditions. More amino acids are altered between human
and fdx1b−/−mutants (p = .02; assessed by hypergeometric testing) than between human and rx3 strong mutants (p = .18). The data for the rx3 mutants is a reanalysis from our previously published data set [74].
Supplementary data to this article can be found online athttps://doi. org/10.1016/j.ebiom.2018.09.024.
Acknowledgements
We would like to thank Yavor Hadzhiev, Nan Li and Andreas Zaucker for scientific discussions and Hannah Ivision for administrative support. We acknowledge the Metabolomics Core Technology Platform of the Excellence cluster CellNetworks, University of Heidelberg, for performing the metabolic analysis and the IGBMC Microarray and Se-quencing platform, a member of the“France Génomique” consortium (ANR-10-INBS-0009), for running the RNA-Sequencing.
Funding sources
Marie Curie Intra-European Fellowships for Career Development (PIEF-GA-2013-625827, MISTRAL; to MW), HGF-programme BIFTM (to TD, BG, BL), Deutsche Forschungsgemeinschaft (grant ZUK 40/ 2010-3009262; to RH and GP) and BBSRC (BB/L010488/1; to FM). The funders had no role in study design, data collection, data analysis, inter-pretation, or writing of the report.
Declaration of interest
BDW was an employee of Nestlé Health Sciences SA. All other au-thors declare no conflict of interest.
Author contributions
Conceptualization: MW, NK; Study design: MW, TG, NK; Investiga-tion: MW, BG, GP, TG, MY; Data analysis: MW, BDW, BG; Funding acqui-sition: MW, TD, BL, RH, FM, NK; Resources: RH, BL, TA, TG, FM, TD, NK; Supervision: BL, TA, RH, TD, FM, NK; Writing - original draft: MW, NK; Writing– review & editing: MW, BDW, TD, FM, NK.
References
[1] Alam MM, Okazaki K, Nguyen LTT, Ota N, Kitamura H, Murakami S, et al. Glucocor-ticoid receptor signaling represses the antioxidant response by inhibiting histone acetylation mediated by the transcriptional activator NRF2. J Biol Chem 2017;292: 7519–30.https://doi.org/10.1074/jbc.M116.773960.
[2] Altman BJ, Stine ZE, Dang CV. From Krebs to clinic: glutamine metabolism to cancer therapy. Nat Rev Cancer 2016;16:749.https://doi.org/10.1038/nrc.2016.114. [3] Alwashih MA, Watson DG, Andrew R, Stimson RH, Alossaimi M, Blackburn G, et al.
Plasma metabolomic profile varies with glucocorticoid dose in patients with con-genital adrenal hyperplasia. Sci Rep 2017;7(17092).https://doi.org/10.1038/ s41598-017-17220-5.
[4] Atger F, Gobet C, Marquis J, Martin E, Wang J, Weger B, et al. Circadian and feeding rhythms differentially affect rhythmic mRNA transcription and translation in mouse liver. Proc Natl Acad Sci U S A 2015;112:E6579–88.https://doi.org/10.1073/pnas. 1515308112.
[5] Bancos I, Hahner S, Tomlinson J, Arlt W. Diagnosis and management of adrenal insuf-ficiency. Lancet Diabetes Endocrinol 2015;3:216–26. https://doi.org/10.1016/S2213-8587(14)70142-1.
[6] Benato F, Colletti E, Skobo T, Moro E, Colombo L, Argenton F, et al. A living biosensor model to dynamically trace glucocorticoid transcriptional activity during develop-ment and adult life in zebrafish. Mol Cell Endocrinol 2014;392:60–72.https://doi. org/10.1016/j.mce.2014.04.015.
[7]Benjamini Y, Hochberg Y. Controlling the false discovery rate: a practical and pow-erful approach to multiple testing. J R Stat Soc Ser B 1995:289–300.
[8] Brion F, Le Page Y, Piccini B, Cardoso O, Tong S-K, Chung B, et al. Screening estrogenic activities of chemicals or mixtures in vivo using transgenic (cyp19a1b-GFP) zebrafish embryos. PLoS One 2012;7:e36069.https://doi.org/10.1371/journal.pone. 0036069.
[9] Bürstenbinder K, Rzewuski G, Wirtz M, Hell R, Sauter M. The role of methionine recycling for ethylene synthesis in Arabidopsis. Plant J 2007;49:238–49.https:// doi.org/10.1111/j.1365-313X.2006.02942.x.
[10]Cano N. Bench-to-bedside review: glucose production from the kidney. Crit Care 2002;6:317–21.
[11] Chorley BN, Campbell MR, Wang X, Karaca M, Sambandan D, Bangura F, et al. Iden-tification of novel NRF2-regulated genes by ChIP-Seq: influence on retinoid X recep-tor alpha. Nucleic Acids Res 2012;40:7416–29.https://doi.org/10.1093/nar/gks409. [12] Cox AG, Hwang KL, Brown KK, Evason K, Beltz S, Tsomides A, et al. Yap reprograms
glutamine metabolism to increase nucleotide biosynthesis and enable liver growth. Nat Cell Biol 2016;18:886–96.https://doi.org/10.1038/ncb3389.
[13] Deberardinis RJ, Cheng T. Q's next: the diverse functions of glutamine in metabolism, cell biology and cancer. Oncogene 2010;29:313–24.https://doi.org/10.1038/onc. 2009.358.
[14] Dhanasiri AKS, Fernandes JMO, Kiron V. Glutamine synthetase activity and the ex-pression of three glul paralogues in zebrafish during transport. Comp Biochem Phys-iol Part B Biochem Mol BPhys-iol 2012;163:274–84.https://doi.org/10.1016/j.cbpb.2012. 06.003.
[15] Dhawan L, Liu B, Blaxall BC, Taubman MB. A novel role for the glucocorticoid recep-tor in the regulation of monocyte chemoattractant protein-1 mRNA stability. J Biol Chem 2007;282:10146–52.https://doi.org/10.1074/jbc.M605925200.
[16] Dickmeis T, Lahiri K, Nica G, Vallone D, Santoriello C, Neumann CJ, et al. Glucocorti-coids play a key role in circadian cell cycle rhythms. PLoS Biol 2007;5:e78.https:// doi.org/10.1371/journal.pbio.0050078.
[17] Dobin A, Davis CA, Schlesinger F, Drenkow J, Zaleski C, Jha S, et al. STAR: ultrafast universal RNA-seq aligner. Bioinformatics 2013;29:15–21.https://doi.org/10.1093/ bioinformatics/bts635.
[18] Du, N.-H., Arpat, A.B., De Matos, M., Gatfield, D., 2014. MicroRNAs shape circadian hepatic gene expression on a transcriptome-wide scale. Elife 3, e02510. [19] Eachus H, Zaucker A, Oakes JA, Griffin A, Weger M, Güran T, et al. Genetic disruption
of 21-hydroxylase in zebrafish causes interrenal hyperplasia. Endocrinology 2017.
https://doi.org/10.1210/en.2017-00549.
[20]Edgar R, Domrachev M, Lash AE. Gene expression omnibus: NCBI gene expression and hybridization array data repository. Nucleic Acids Res 2002;30:207–10.
[21] El-Maouche D, Arlt W, Merke DP. Congenital adrenal hyperplasia. Lancet (London, England) 2017;390:2194–210.https://doi.org/10.1016/S0140-6736(17)31431-9. [22] Espinosa-Diez C, Miguel V, Mennerich D, Kietzmann T, Sánchez-Pérez P, Cadenas S,
et al. Antioxidant responses and cellular adjustments to oxidative stress. Redox Biol 2015;6:183–97.https://doi.org/10.1016/j.redox.2015.07.008.
[23] Facchinello N, Skobo T, Meneghetti G, Colletti E, Dinarello A, Tiso N, et al. nr3c1 null mutant zebrafish are viable and reveal DNA-binding-independent activities of the glucocorticoid receptor. Sci Rep 2017;7(4371). https://doi.org/10.1038/s41598-017-04535-6.
[24] Fetter E, Krauss M, Brion F, Kah O, Scholz S, Brack W. Effect-directed analysis for es-trogenic compounds in afluvial sediment sample using transgenic cyp19a1b-GFP zebrafish embryos. Aquat Toxicol 2014;154:221–9.https://doi.org/10.1016/j. aquatox.2014.05.016.
[25] Gaidatzis D, Burger L, Florescu M, Stadler MB. Erratum: Analysis of intronic and ex-onic reads in RNA-seq data characterizes transcriptional and post-transcriptional regulation. Nat Biotechnol 2016;34:210.https://doi.org/10.1038/nbt0216-210a. [26] Gaidatzis D, Burger L, Florescu M, Stadler MB. Analysis of intronic and exonic reads
in RNA-seq data characterizes transcriptional and post-transcriptional regulation. Nat Biotechnol 2015;33:722–9.https://doi.org/10.1038/nbt.3269.
[27] Gao P, Tchernyshyov I, Chang T-C, Lee Y-S, Kita K, Ochi T, et al. c-Myc suppression of miR-23a/b enhances mitochondrial glutaminase expression and glutamine metabo-lism. Nature 2009;458:762–5.https://doi.org/10.1038/nature07823.
[28] Gorelick DA, Halpern ME. Visualization of estrogen receptor transcriptional activa-tion in zebrafish. Endocrinology 2011;152:2690–703.https://doi.org/10.1210/en. 2010-1257.
[29] Gorelick DA, Iwanowicz LR, Hung AL, Blazer VS, Halpern ME. Transgenic zebrafish reveal tissue-specific differences in estrogen signaling in response to environmental water samples. Environ Health Perspect 2014;122:356–62.https://doi.org/10.1289/ ehp.1307329.
[30] Gorelick DA, Pinto CL, Hao R, Bondesson M. Use of reporter genes to analyze estro-gen response: the transestro-genic zebrafish model. Methods Mol Biol 2016;1366: 315–25.https://doi.org/10.1007/978-1-4939-3127-9_24.
[31] Goswami MT, Chen G, Chakravarthi BVSK, Pathi SS, Anand SK, Carskadon SL, et al. Role and regulation of coordinately expressed de novo purine biosynthetic enzymes PPAT and PAICS in lung cancer. Oncotarget 2015;6:23445–61.https://doi.org/10. 18632/oncotarget.4352.
[32] Grassi Milano E, Basari F, Chimenti C. Adrenocortical and adrenomedullary homo-logs in eight species of adult and developing teleosts: morphology, histology, and immunohistochemistry. Gen Comp Endocrinol 1997;108:483–96.https://doi.org/ 10.1006/gcen.1997.7005.
[33] Griffin A, Parajes S, Weger M, Zaucker A, Taylor AE, O'Neil DM, et al. Ferredoxin 1b (Fdx1b) is the essential mitochondrial redox partner for cortisol biosynthesis in zebrafish. Endocrinology 2016;157:1122–34. https://doi.org/10.1210/en.2015-1480.
[34] Gulyaeva LF, Kushlinskiy NE. Regulatory mechanisms of microRNA expression. J Transl Med 2016;14(143).https://doi.org/10.1186/s12967-016-0893-x.
[35] Gut P, Reischauer S, Stainier DYR, Arnaout R. Littlefish, big data: zebrafish as a model for cardiovascular and metabolic disease. Physiol Rev 2017;97:889–938.https://doi. org/10.1152/physrev.00038.2016.
[36] Hahner S, Loeffler M, Fassnacht M, Weismann D, Koschker A-C, Quinkler M, et al. Im-paired subjective health status in 256 patients with adrenal insufficiency on stan-dard therapy based on cross-sectional analysis. J Clin Endocrinol Metab 2007;92: 3912–22.https://doi.org/10.1210/jc.2007-0685.
[37] Hinfray N, Sohm F, Caulier M, Chadili E, Piccini B, Torchy C, et al. Dynamic and differ-ential expression of the gonadal aromatase during the process of sexual differentia-tion in a novel transgenic cyp19a1a-eGFP zebrafish line. Gen Comp Endocrinol 2017.
https://doi.org/10.1016/j.ygcen.2017.06.014.
[38] Hsu H, Lin G, Chung B. Parallel early development of zebrafish interrenal glands and pronephros: differential control by wt1 and ff1b. Development 2003;130:2107–16.
https://doi.org/10.1242/dev.00427.
[39] Huang Y, Zou Q, Ren HT, Sun XH. Prediction and characterization of microRNAs from elevenfish species by computational methods. Saudi J Biol Sci 2015;22:374–81.