ARTICLE
OPEN
doi:10.1038/nature15394An integrated map of structural variation
in 2,504 human genomes
A list of authors and their affiliations appears at the end of the paper.
Structural variants are implicated in numerous diseases and make up the majority of varying nucleotides among human genomes. Here we describe an integrated set of eight structural variant classes comprising both balanced and unbalanced variants, which we constructed using short-read DNA sequencing data and statistically phased onto haplotype blocks in 26 human populations. Analysing this set, we identify numerous gene-intersecting structural variants exhibiting population stratification and describe naturally occurring homozygous gene knockouts that suggest the dispensability of a variety of human genes. We demonstrate that structural variants are enriched on haplotypes identified by genome-wide association studies and exhibit enrichment for expression quantitative trait loci. Additionally, we uncover appreciable levels of structural variant complexity at different scales, including genic loci subject to clusters of repeated rearrangement and complex structural variants with multiple breakpoints likely to have formed through individual mutational events. Our catalogue will enhance future studies into structural variant demography, functional impact and disease association.
Structural variants (SVs), including deletions, insertions, duplications and inversions, account for most varying base pairs (bp) among
individual human genomes1. Numerous studies have implicated
SVs in human health with associated phenotypes ranging from cognitive disabilities to predispositions to obesity, cancer and other maladies1,2. Discovery and genotyping of these variants remains chal-lenging, however, since SVs are prone to arise in repetitive regions and internal SV structures can be complex3. This has created challenges for genome-wide association studies (GWAS)4,5. Despite recent methodo-logical and technomethodo-logical advances6–9, efforts to perform discovery, genotyping, and statistical haplotype-block integration of all major SV classes have so far been lacking. Earlier SV surveys depended on microarrays10as well as genomic and clone-based approaches limited to a small number of samples11–15. More recently, short-read DNA sequencing data from the initial phases of the 1000 Genomes Project8,9enabled us to construct sets of SVs, genotyped across popu-lations, with enhanced size and breakpoint resolution6,7. Previous 1000 Genomes Project SV set releases, however, encompassed fewer indi-viduals and were largely6or entirely8limited to deletions, in spite of the relevance of other SV classes to human genetics1,2,4.
The objective of the Structural Variation Analysis Group has been to discover and genotype major classes of SVs (defined as DNA var-iants $50 bp) in diverse populations and to generate a statistically phased reference panel with these SVs. Here we report an integrated map of 68,818 SVs in unrelated individuals with ancestry from 26 populations (Supplementary Table 1). We constructed this resource by analysing 1000 Genomes Project phase 3 whole-genome sequen-cing (WGS) data16 along with data from orthogonal techniques, including long-read single-molecule sequencing (Supplementary Table 2), to characterize hitherto unresolved SV classes. Our study emphasizes the population diversity of SVs, quantifies their functional impact, and highlights previously understudied SV classes, including inversions exhibiting marked sequence complexity.
Construction of our phase 3 SV release
We mapped Illumina WGS data (,100 bp reads, mean 7.4-fold
coverage) from 2,504 individuals onto an amended version8 of
the GRCh37 reference assembly using two independent mapping
algorithms—BWA17and mrsFAST18—and performed SV discovery
and genotyping using an ensemble of nine different algorithms (Extended Data Fig. 1 and Supplementary Note). We applied several orthogonal experimental platforms for SV set assessment, refinement and characterization (Supplementary Table 2) and to calculate the false discovery rate (FDR) for each SV class (Table 1). Callset refine-ments facilitated through long-read sequencing enabled us to incorp-orate a number of additional SVs into our callset, including an additional 698 inversions and 9,132 small (,1 kbp) deletions, com-pared to the SV set released with the 1000 Genomes Project marker paper16. As a result, our callset differs slightly relative to the marker paper’s SV set16(see Supplementary Table 2). We merged individual callsets to construct our unified release (Table 1), comprising 42,279 biallelic deletions, 6,025 biallelic duplications, 2,929 mCNVs (multi allelic copy-number variants), 786 inversions, 168 nuclear mitochon-drial insertions (NUMTs), and 16,631 mobile element insertions (MEIs, including 12,748, 3,048 and 835 insertions of Alu, L1 and SVA (SINE-R, VNTR and Alu composite) elements, respectively).
SV non-reference genotype concordance estimates ranged from ,98% for biallelic deletions and MEI classes to ,94% for biallelic duplications. 60% of SVs were novel with respect to the Database of
Genomic Variants (DGV)19 (50% reciprocal overlap criterion,
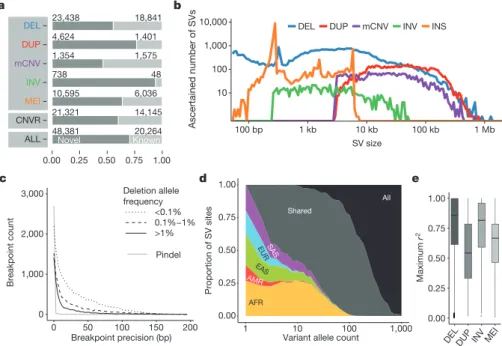
Fig. 1a), whereby 71% of SVs (50% reciprocal overlap) and 60% of collapsed copy-number variable regions (CNVRs, 1 bp overlap) were novel compared to previous 1000 Genomes Project releases6,8, reflect-ing methodological improvements and inclusion of additional popu-lations. Novel SVs showed enrichment for rare sites, which we detected down to an autosomal allele count of ‘1’. And while varia-tions in FDR estimates were evident with SV size and VAF (variant allele frequency), we consistently estimated the FDR at #5.4% when stratifying deletions and duplications by size and frequency, including for rare SVs with VAF , 0.1% (Extended Data Figs 1, 2). A compar-ison with deep-coverage Complete Genomics (CG) sequencing data indicated an overall sensitivity of 88% for deletions and 65% for duplications, with the false negatives driven largely by the relatively lowered sensitivity for ascertaining small SVs in Illumina sequencing data (Fig. 1b, Extended Data Fig. 3). The average per-individual sensitivity was similar for deletions (89%) and slightly lower for 1 O C T O B E R 2 0 1 5 | V O L 5 2 6 | N A T U R E | 7 5 G2015 Macmillan Publishers Limited. All rights reserved
duplications (50%). For MEI classes, estimated sensitivities ranged from 83–96% (Table 1) compared to the 1000 Genomes Project pilot phase where a different MEI detection tool was used20. For inversions, we estimated an overall sensitivity of 32% based on variants with a positive validation status recorded in the InvFEST database21, with an increased sensitivity of 67% for inversions ,5 kbp in size.
We performed breakpoint assembly using pooled Illumina WGS and Pacific Biosciences (PacBio) sequencing data22, and additionally performed split-read analysis23 of short reads, to resolve the fine-resolution breakpoint structure of 37,250 SVs (29,954 deletions, 357 tandem duplications, 6,919 MEIs, and 20 inversions; Supplementary Table 3). Breakpoint assemblies showed a mean boundary precision of 0–15 bp for all SV types, with the exception of inversions and duplications for which we achieved mean precision estimates of 32 bp and 683 bp, respectively (Table 1, Fig. 1c).
Population genetic properties of SVs
We explored the population genetic properties of SVs among five continental groups—Africa (AFR), the Americas (AMR), East Asia (EAS), Europe (EUR) and South Asia (SAS). The bulk of SVs occur at low frequency (65% exhibit VAF , 0.2%) consistent amongst indi-vidual SV classes (Extended Data Figs 2, 3). While rare SVs are typically specific to individual continental groups, at VAF $ 2% nearly all SVs are shared across continents (Fig. 1d, Extended Data Fig. 3). Notably, we identified 1,075 SVs with VAF . 50% (889 biallelic deletions, 2 biallelic duplications, 90 mCNVs, 88 MEIs and 6 inversions) encom-passing 5 Mbp, sites of interest for future updates to the human ref-erence genome. We estimated the mutation rate for each SV class using Waterson’s estimator of h, for example, ascertaining a mutation rate of 0.113 deletions per haploid genome generation, a threefold higher
estimate compared with previous reports10,24, probably owing to our increased power for detecting variants , 5 kbp (Supplementary Note). We found that 73% of SVs with .1% VAF and 68% of rarer SVs (VAF . 0.1%) are in linkage disequilibrium (LD) with nearby single nucleotide polymorphisms (SNPs) (r2.0.6); however, the propor-tion of variants in LD highly depends on the SV class (Fig. 1e, Extended Data Fig. 4). For example, only 44% of all biallelic duplica-tions with VAF . 0.1% were in LD with a nearby SNP (r2.0.6), in agreement with previous findings10,25,26. Notably, we observed a striking depletion of biallelic duplications amongst common SVs (P , 2 3 10216, Kolmogorov–Smirnov test; Extended Data Fig. 5) with most common duplications classified as multi-allelic SVs (that is, mCNVs). This behaviour suggests extensive recurrence of SVs at duplication sites consistent with what was recently observed in a smaller cohort of 849 individuals27. These LD characteristics suggest duplications are currently under-ascertained for disease associations using tag-SNP-based approaches.
Based on our haplotype-resolved SV catalogue, we observed that individuals of African ancestry exhibit, on average, 27% more hetero-zygous deletions than individuals from other populations (mean of 1,705 versus 1,342), consistent with SNPs28(Extended Data Fig. 5). The relative proportion of deletion- versus SNP-affected sequence, however, showed a 13% excess in non-African compared to African populations (ratio 1.64 versus 1.45). Principal component analyses with different SV classes generally recapitulated continental population structure and admixture (Extended Data Fig. 6 and Supplementary Note). Our analysis further allowed us to identify a catalogue of 6,495 ancestry-informative MEI markers of potential value to population genetics history and forensics research (Extended Data Fig. 5, Supple-mentary Table 4).
Table 1|Phase 3 extended SV release
SV class No. sites Median size of SV sites (bp)
Median kbp per individual
Median alleles per individual
Site FDR Biallelic site breakpoint precision (bp) Genotype concordance (non-ref.) Sensitivity estimates Deletion (biallelic) 42,279 2,455 5,615 2,788 2%*–4%{ 15 (650)** 0.7 (69.5){{ 98%" 88%" Duplication (biallelic) 6,025 35,890 518 17 1%*–4%{ 683 (61,350){{ 94%" 65%" mCNV 2,929 19,466 11,346 340 1%*–4%{ – NA NA Inversion 786 1,697 78 37 17%1 (9%){jjjj 32 (647)jjjj 96%1 32% MEI 16,631 297 691 1,218 4%{ 0.95 (65.93) 98%jj 83# 296%w NUMT 168 157 3 5.3 10%{ 0.25 (60.43) 86.1%{ NA
FDR estimates are based on intensity rank-sum testing8
using *Affymetrix SNP6 and {Omni 2.5 arrays, {PCR, as well as 1long-read,jjPCR-free (250 bp-read) and "CG sequencing (CG-based estimates used reciprocal overlaps of 50% and 20% for deletions and duplications, respectively). Estimate by comparing MEIs to all #calls or all wPCR-validated calls from20(estimates for individual MEI classes are in Supplementary Table 4). NA, no previous data available. Differences in deletion and duplication counts are driven by size-cutoffs and classification of common duplications as mCNVs27. **Ascertained using read-pairs or read-depth. {{Ascertained with split-reads23. {{Estimated for tandem duplications.jjjjEstimated for inversions with paired-end support from both breakpoints.
Novel Known 23,438 4,624 1,354 738 10,595 48,381 21,321 18,841 1,401 1,575 48 6,036 20,264 14,145 ALL CNVR MEI INV mCNV DUP DEL 0.00 0.25 0.50 0.75 1.00 Pindel 0 1,000 2,000 3,000 0 50 100 150 200 Breakpoint precision (bp) Breakpoint count Deletion allele frequency <0.1% 0.1%−1% >1% a c d e b 10 100 1,000 10,000 100 bp 1 kb 10 kb 100 kb 1 Mb SV size Ascertained number of SVs
DEL DUP mCNV INV INS
0.00 0.25 0.50 0.75 1.00 Maximum r 2 DE L DUP INV M EI AFR AMR EAS EURSAS Shared All 0.00 0.25 0.50 0.75 1.00 1 10 100 1,000
Variant allele count
Proportion of SV sites
Figure 1|Phase 3 integrated SV callset.
a, Novelty based on overlap of our SV set with
DGV19(upper panel, broken down by SV class), of
collapsed CNVRs with earlier 1000 Genomes
Project releases6,8(middle panel) and of our SV set
with refs 6, 8 (bottom panel). b, Size distribution of ascertained SVs (bin width is uniform in log-scale). DEL, biallelic deletion, DUP, biallelic duplication, INV, inversion, INS, non-reference insertion (including MEIs and NUMTs). c, Breakpoint precision of assembled deletions
stratified by VAF (split-read caller Pindel23shown
separately). d, SV allele sharing across continental groups. e, LD properties of biallelic SV classes.
7 6 | N A T U R E | V O L 5 2 6 | 1 O C T O B E R 2 0 1 5
Since population stratification can be used as a signature to detect adaptive selection, we additionally identified SVs varying in VAF amongst different populations. For each SV site we calculated a VST statistic, a measure highly correlated with FST(the fixation index)29 that can be applied to assess population stratification of biallelic and multi-allelic SVs29. We observed 1,434 highly stratified SVs (.0.2 VST, corresponding to 2.9 standard deviations (s.d.) from the mean; Supplementary Table 5), among which 578 intersected gene coding sequences (CDSs). Among these were several SVs associated with regions previously reported to be under positive selection, such as KANSL1 mCNVs (Extended Data Fig. 6) that tag a European-enriched inversion polymorphism associated with increased fecundity30. Most of the population-stratified sites, however, have not been previously described and are, thus, potential targets for future investigation of SVs undergoing adaptive selection or genetic drift. These include, for example, a 14.5 kbp intronic duplication of HERC2 enriched in East Asians (VST50.62 EAS-EUR).
Functional impact of SVs
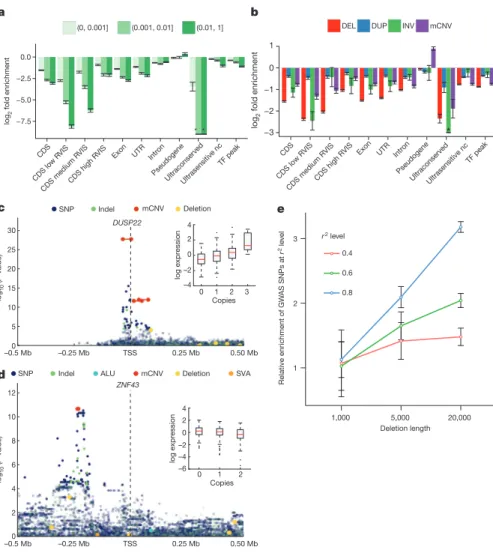
We analysed the intersection of deletions binned by VAF with various classes of genic and intergenic functional elements (Fig. 2a, Extended Data Fig. 7). The CDSs, untranslated regions (UTRs) and introns of genes, in addition to ENCODE31transcription factor binding sites and ultrasensitive noncoding regions, showed a significant depletion (P , 0.001; permutation testing in each VAF bin) compared to a ran-dom background model. In general, these elements are more depleted (in terms of fold change) in common VAF bins compared to rarer deletion alleles, in keeping with purifying10 (or in some cases background32) selection. Genes more intolerant to mutation (as mea-sured from SNP diversity, residual variation intolerance score
(RVIS)33,20) exhibited the most pronounced depletion (P , 0.001; permutation testing between pairs of RVIS-score categories). All other SV classes exhibited similar signatures of selection; when com-pared to deletions these depletions were, however, more attenuated (Fig. 2b, Extended Data Fig. 7). Additional assessment of the site frequency spectrum showed that, as deletion sizes increase, these SVs become rarer (P , 2.2 3 10216; linear model, F-test), evidence of purifying selection against events more likely intersecting func-tional elements. Duplications, by comparison, did not exhibit such trend, consistent with reduced selective constraints (Supplemen-tary Note).
We additionally analysed 5,819 homozygous deletions to search for gene knockouts occurring naturally in human populations. Among these we identified 240 genes (corresponding to 204 individual dele-tion sites) that, on the basis of the observadele-tion of homozygous losses in normal individuals, seem to be ‘dispensable’ (Supplementary Table 6). Most of the underlying deletions were found in more than one human population, and for only one (0.5%) we observed evidence for the putative involvement of uniparental disomy in the homozygosity (Supplementary Note). The majority (.80%) of these homozygous gene losses were novel compared to a previous analysis based on DGV variants19, or recent clinical genomics studies (Supplementary Note). As expected, genes affected by homozygous loss were not highly conserved and were relatively tolerant to other forms of genetic variation (RVIS 5 0.74 compared to OMIM disease genes showing RVIS 5 0.43; P 5 9.4 3 10225; Mann–Whitney test). Moreover, the set was func-tionally enriched for glycoproteins (Benjamini–Hochberg corrected P-value 5 1.6 3 1023, EASE (Expression Analysis Systematic Explorer) score) and genes harbouring immunoglobulin domains (Benjamini– Hochberg corrected P-value 5 1.0 3 1025, EASE score).
1 O C T O B E R 2 0 1 5 | V O L 5 2 6 | N A T U R E | 7 7 * * −7.5 −5.0 −2.5 30 –log 10 (P value) –log 10 (P value) 25 20 15 –0.5 Mb –0.25 Mb SNP SNP SVA Deletion Deletion mCNV mCNV Indel Indel ALU 0.25 Mb 0.50 Mb TSS –0.5 Mb –0.25 Mb TSS 0.25 Mb 0.50 Mb 10 12 10 8 6 4 2 0 5 0 0.0 CDS CDS lo w R VIS CDS medium R VIS CDS high R
VIS Exon UTR Intron Pseudogene Ultraconser ved Ultra sensitiv e nc TF peak log 2 fold enrichment
(0, 0.001] (0.001, 0.01] (0.01, 1] DEL DUP INV mCNV
1 2 3 1,000 5,000 20,000 Deletion length Relative enr ichment of GW AS SNPs at r 2 le v e l r2 level 0.4 0.6 0.8 a b e ZNF43 DUSP22 d c * 0 1 2 Copies 3 log expression 4 2 0 –2 –4 0 1 2 Copies log expression 4 2 0 –2 –4 –6 log 2 fold enrichment −2 −1 0 1 −3 CDS CDS low RVIS CDS medium RVIS CDS high RVIS
Exon UTR Intron Pseudogene
UltraconservedUltrasensitive nc TF peak
Figure 2|SV functional impact. a, Relative
enrichment or depletion of genomic elements within breakpoint-resolved deletions binned by VAF. TF, transcription factor binding site; nc, noncoding. RVIS range from 0–100 (low , 20, medium 20–50, high $ 50). *no element intersected. b, Enrichment/depletion of genomic elements within different SV classes, compared with breakpoint-resolved deletions. c, Manhattan plot of DUSP22-eQTL. Inset, boxplots of association between copy-number genotype and expression. d, Manhattan plot of ZNF43-eQTL. e, Enrichment of SV-containing haplotypes at previously reported GWAS hits (error bars show s.e.m.).
We next quantified the functional impact of SVs using expression quantitative trait loci (eQTL) associations as a surrogate34,35. Based on transcriptome data from lymphoblastoid cell lines derived from 462 individuals36 (the gEUVADIS consortium), we tested 18,969 expressed protein-coding genes for cis-eQTL associations, considering 1 Mbp candidate regions upstream and downstream of CDSs. A joint eQTL analysis using SNPs, indels and SVs with VAF .1% identified 54 eQTLs with a lead SV association (denoted SV-eQTL) and 9,537 eQTLs with a lead SNP/indel association (10% FDR). For an additional 166 eQTLs with lead associations to SNPs or indels, we observed SVs in LD (r2.0.5) seven times more than when using random variants matched for LD structure, distance to the transcription start site, and VAF, suggesting that a larger number of eQTLs are probably affected by SVs (Extended Data Fig. 8, Supplementary Table 7). In proportion to the number of variants tested, SV classes were up to ,50-fold enriched for SV-eQTLs (P 5 2.84 3 10239, one-sided Fisher’s exact test; Supplementary Table 8). Large SVs were associated with increased effect size; for example, a twofold increase in effect size for genic SVs .10 kbp versus variants ,1 kbp (P 5 0.0004; t-test; Extended Data Fig. 8). Taken together, although SNPs contribute more eQTLs overall, our results suggest that SVs have a disproportionate impact on gene expression relative to their number.
Among those 220 eQTLs having either an SV-eQTL or an SV in LD with the lead SNP/indel, most were due to deletions (55% of associations), followed by mCNVs (19%) (Supplementary Table 8). Although SV-eQTLs with the largest effect sizes tended to overlap with CDSs, such as for the dual specificity phosphatase 22 (DUSP22) gene (Fig. 2c), we also observed several expression-associated SVs strictly intersecting upstream noncoding sequences, including an mCNV upstream of ZNF43 (Fig. 2d) possibly mediated through vari-ation of a cis-regulatory element. We additionally considered the impact of accounting for SVs when constructing personalized ref-erence genomes for transcriptome analysis. To illustrate this, we con-sidered RNA read alignments for the sample NA12878, comparing the standard reference genome with GRCh37-derived personalized references constructed using NA12878 SNPs, or using NA12878 SNPs and SVs. Using such an approach, we observed marked changes in expression for 525 exons (610 reads, $onefold change relative to the standard reference), 24 of which could be attributed to the inclu-sion of SVs into the personalized reference (Supplementary Table 9). The relevance of SVs to eQTLs suggests that a number of disease associations previously detected by GWAS may be attributable to SVs, which are difficult to assess directly in GWAS. To test this hypothesis we compared 12,892 previously reported SNP-based GWAS hits to SVs identified in our data set, identifying 136 candidate SVs in strong LD (r2.0.8) with GWAS variants, which represents a 1.5-fold enrichment when compared to a VAF and haplotype size-matched background set and a threefold enrichment for deletions .20 kbp (P 5 0.004) (Fig. 2e and Supplementary Note). Approximately a third of these candidate GWAS associations (39) were novel, impacting phenotypes such as colorectal cancer and bone mineral density (Supplementary Table 10). Interestingly, 64% of these novel associa-tions were mediated by deleassocia-tions ,1 kbp, a size range for which our study has improved power over previous surveys, which more than doubles (from 18 to 40) the number of SVs ,1 kbp in strong LD with a GWAS lead SNP. Thus, our SV resource could facilitate discovery of numerous additional disease-linked SVs.
SV clustering and complexity
Advances in Illumina sequencing towards longer read lengths (,100 bp versus 36 bp)6in conjunction with the population-level data allowed us to perform an in-depth investigation of SV complexity and clustering. We identified 3,163 regions where SVs seemed to cluster (.2 SVs mapping within 500 bp; Supplementary Table 11). To reduce redundancy caused by multiple overlapping calls per sample, we
cal-culated distinct CNVRs per cluster by merging calls per sample and haplotype and then counting the distinct CNVRs produced across samples (average 6.4 6 7.2 CNVRs per cluster). We identified 30 genomic regions with an excess of CNVRs (.4 s.d. or .36 CNVRs per cluster). This clustering effect was not correlated with segmental duplications (r 5 0.02) and only partially explained by SNP diversity (r 5 0.15; Extended Data Fig. 9). CNVR clusters showed enrichment near late-replicating origins (P 5 0.013, permutation test) and at cyto-genically defined ‘fragile’ sites (P 5 0.0017; permutation test). Although the proportion of gene content in regions exhibiting excess-ive SV clustering was significantly reduced when compared to a null distribution (P , 0.000001, permutation test), 1,881 of 3,163 such regions (59%) intersected one or more genes (Supplementary Table 11). This includes a region comprised of 47 SVs (ranking 2nd out of the 30 genomic regions with .4 s.d.) encompassing the preg-nancy-specific glycoprotein gene family (Fig. 3a), a set of genes thought to be critically important for maintenance of pregnancy37. Other SV clusters associated with genes (for example, IMMP2L, CHL1 and GRID2) have been implicated as potential risk factors for disease, including neurodevelopmental disorders38.
We additionally specifically assessed the complexity of the 29,954 deletions with resolved breakpoints and found that 6% (1,822) inter-sected another deletion with distinct breakpoints. A larger fraction (16% or 4,813 of assembled deletion sites) showed the presence of additional inserted sequence at deletion breakpoints. We grouped 1,651 deletions with mean size of 3.1 kbp and at least 10 bp of addi-tional DNA sequence between the original SV site boundaries into five broad classes (Fig. 3b, Supplementary Table 12). The most common class (n 5 501, 30.3%), termed ‘Ins with Dup and Del’, comprised deletions exhibiting a recognizable duplicated sequence interval within the respective inserted sequence. Notably, in many cases (n 5 191) the inserted sequences comprised two or more apparent sequence duplications at the deletion boundaries (a class denoted ‘Ins with MultiDup and Del’). Additional classes commonly observed include Inv and Del (inversion with adjacent deletion; n 5 9) and ‘MultiDel’—a class where two or more adjacent deletions are sepa-rated by at least one sequence ‘spacer’ of up to ,204 bp in length (n 5 370). However, not all complex SVs fit into these classes, with 214 sites forming distinct patterns corresponding to multiple classes or exhibiting increased complexity. Template-switching mechanisms could explain the notable complexity of these SVs3. Indeed, micro-homology patterns were typically present between the breakpoints of deletions and the respective boundaries of insertion templates at these sites (Extended Data Fig. 9), consistent with formation through single mutational events (Supplementary Note). Across the complex sites assessed, 871 (53%) showed evidence for a local template ($10 bp match, within 10 kbp), whereas for 41 the insertion was presumably templated from a distal region ($22 bp match, .10 kbp away), including 17 sites where the DNA stretch was likely derived from RNA templates (Supplementary Table 13).
To further characterize SV breakpoint complexity, we employed two alternative approaches that do not rely on low-coverage Illumina read assembly. We first examined 7,804 small deletions for breakpoint complexity using split-read analysis23 (Fig. 3c) and identified 664 (median size 67 bp) exhibiting complexity, 64 of which contained insertions $3 bp that may be derived from a nearby template (Supplementary Table 14, Extended Data Fig. 9). We additionally realigned long DNA reads from a single individual (NA12878)22 sequenced by high-coverage PacBio (median read length 3.0 kbp) and Moleculo (median 3.2 kbp) single-molecule WGS around dele-tions from our release set (Fig. 3d). Out of 766 deledele-tions in NA12878 investigated with this approach, 62 exhibited complexity showing three to six breakpoints (Supplementary Table 12). A deletion of exon 3 of the serine protease inhibitor SPINK14, for example, was accompanied by an inversion of an internal segment of the SV sequence (Fig. 3d, left panel). In contrast to the smaller proportion 7 8 | N A T U R E | V O L 5 2 6 | 1 O C T O B E R 2 0 1 5
of deletions showing breakpoint complexity, the majority of inver-sions assessed in NA12878 (19/28) exhibited multiple breakpoints.
To further explore inversion sequence complexity, we performed a battery of targeted analyses, leveraging PacBio resequencing of fos-mids (targeting 34 loci), sequencing by Oxford Nanopore Minion (60 loci) and PacBio (206 loci) of long-range PCR amplicons, and data for 13 loci from another sample (CHM1) sequenced by high-coverage PacBio WGS14. Altogether we verified and further charac-terized 229 inversion sites, 208 using long-read data and 21 by PCR (Supplementary Table 15), increasing the number of known validated inversions21 by .2.5-fold. Remarkably, only 20% of all sequenced inversions characterized in this manner were ‘simple’ (termed ‘Simple Inv’), exhibiting two breakpoints (Fig. 3e), including a 2 kbp inversion on chromosome 4 intersecting a regulatory exon of the Ras homologue family member RHOH (Fig. 3d, right panel). The majority of inversions (54%) corresponded to inverted duplications (‘Inverted Dup’; Fig. 3d, middle right panel). In nearly all cases, these involved duplicated stretches ,1 kbp inserted within 5 kbp of the alternate copy, suggesting a common mechanism of SV formation (Extended Data Fig. 10). The remaining inversions comprised ‘Inv and Del’ events (14%), ‘MultiDel’ events exhibiting inverted spacers (7%), and more highly complex sites (5%; Fig. 3d, middle left panel). The appreciable inversion complexity uncovered here is most likely due to a mutational process forming complex SVs, potentially involving DNA replication errors3, rather than due to recurrent rearrangement, as our analyses failed to detect corresponding intermediate events in 1000 Genomes Project samples.
Discussion
We present what is to our knowledge the most comprehensive set of human SVs to date as an integrated resource for future disease and population genetics studies. We estimate that individuals harbour a median of 18.4 Mbp of SVs per diploid genome, an excess contributed to a large extent by mCNVs (11.3 Mbp) and biallelic deletions (5.6 Mbp; Table 1). When collapsing mCNV sites carrying multiple copies as well as homozygous SVs onto the haploid reference assembly, a median of 8.9 Mbp of sequence are affected by SVs, compared to 3.6 Mbp for SNPs. Furthermore, 37,250 SVs have mapped break-points amounting to .113 Mbp of SV sequence resolved at the nucleotide-level. By mining homozygous deletions we identified over two hundred nonessential human genes, a set enriched for immuno-globulin domains that hence may reflect variation in the immune rep-ertoire underlying inter-individual differences in disease susceptibility. We demonstrate that SV classes are disproportionally enriched (by up to ,50-fold) for SV-eQTLs, although only 220 SVs were found either as lead eQTL association or in high LD with the respective lead SNP. While this corresponds to proportionally fewer associations relative to SNPs compared to a prior estimate based on array techno-logy34, this may be explained by the reliance of this prior estimate on bacterial artificial chromosome arrays, which ascertain large SVs (.50 kbp) that associate with strong effect size, as well as by the relative scarcity of SNPs tested in an earlier study34 (HapMap Phase I)39. We further expand the number of candidate SVs in strong LD with GWAS hits by ,30% (39/136 novel associations implicating SVs as candidates) and find that GWAS haplotypes are enriched up to 1 O C T O B E R 2 0 1 5 | V O L 5 2 6 | N A T U R E | 7 9 b
e
d
Left proximal copy : chr7 120290250 1137 → 15
REF: ATTTGAATGTTGGCTTGCCTTGCTAGGTTGGGGAAGTTCTCCTGGATAAT (1,137 bp) CCTGGCTGCTGCCTTGCAGTTCGATCTCAGACTGCTGTGCCAGCAATGAG
ALT: ATTTGAATGTTGGCTTGCCTTGCTAGGTTGGGGAAGTTCTCCTGGATAAT TCTCCTGGAAATTCTCCTGGCTGCTGCCTTGCAGTTCGATCTCAGACTGCTGTGCCAGCAATGAG
Right proximal copy : chr8 11076332 119 → 62
REF: CAGAGTCTCACTCGGTCGCC (119 bp) AGCTAATTTTTGTATTTTTAGTAAAGATGGGGT
ALT: CAGAGTCTCACTCGGTCGCC TGCCACCACGCCCAGCTAATTTTTGTATTTTTAGTAATTTTTAGCTAATTTTTTGTATTTTTAGCTAATTTTTGTATTTTTAGTAAAGATGGGGT
Right reverse compliment proximal copy and rightproximal copy : chr20 373682 125 → 42
REF: ACCCCATGGCATTTTAAAAAACT (125 bp) ACTATTAACTAAGCCACAGATTGATTCCCACTTCCCGAGTTTCCCACTAA
ALT: ACCCCATGGCATTTTAAAAAACT AAGGGGTGTTAGTGGGTACTAAGAAGTCAACCTTGGTAGAGTACTATTAACTAAGCCACAGATTGATTCCCACTTCCCGAGTTTCCCACTAA
Left proximal copy and right reverse compliment proximal copy: chr10 89275797 771
22000 20000 18000 16000 14000 12000 10000 → 13
REF: GCTAATGTTTGTATTTTTAGTAGAGACGGGGTTTCACCATGTTGGCCAGG (771 bp) ATTGTGTATTTTTGCTTTCAATTTTTTCTTTATTACAGTAGTTTATTGTTTA
ALT: GCTAATGTTTGTATTTTTAGTAGAGACGGGGTTTCACCATGTTGGCCAGG TGAAAATACATGTATTGTGTATTTTTGCTTTCAATTTTTTCTTTATTACAGTAGTTTATTGTTTA
c
Inverted Dup Simple Inv Inv and Del MultiDel with Inv Highly complex a Scale chr19: 1 Mb hg19 43000000 43500000 44000000 44500000 Hotspot locus 1000 Genomes SVs Segmental duplications Genes 104 GSK3A ERF CIC PAFAH1B3 PRR19 TMEM145 MEGF8 MIR8077 CNFN LIPE-AS1LIPE CXCL17 CEACAM1 CEACAM8 PSG3 PSG8 LOC100289650 PSG10P PSG1 PSG6PSG7PSG11PSG2LOC284344PSG5PSG4 PSG9 PRG1 CD177TEX101LYPD3 PHLDB3 ETHE1 ZNF575 XRCC1 PINLYP IRGQ ZNF576 ZNF428 SRRM5 CADM4 PLAURIRGC chr19 (q13.2-q13.31) 19p13.3 19p13.2 p13.11 19p12 19q12 13.11 13.12 19q13.2 13.32 q13.33 13.42 13.43 0 1 2 Copy 0 1 2 3 4 Copy 0 1 2 3 4 0 1 2 AFR AMR EAS EUR SAS Deletion Duplication mCNV MEI RHOH P acB io clo n e ass e m b ly co o rdina te (AB C14_50977200_M13) P a cB io clo n e ass e m b ly co o rdina te (AB C14_1018314_D15) 11 29 14 42 110
Ins with Dup and Del
MultiDel with inverted
or non-inverted spacer
Inv and Del
(370) (501)
(9) (366)
Duplication Insertion Deletion
Ins and Del
Ins with MultiDup
and Del (191) P acB io clo n e ass em b ly co o rdina te (AB C14_50102800_N6) S e q u ence ass e m b ly co o rdina te (chr11:55363934-55458773) 7000 28000 27000 26000 25000 24000 23000 22000 21000 20000 6000 5000 4000 3000 2000 1000 0 30000 25000 20000 15000 10000
Figure 3|SV complexity at different scales. a, PSG locus with clustered SVs.
Population copy-number state histograms are shown for two example SVs. b, Schemes depicting assembled complex deletions. c, Smaller-scale complex
deletions identified with Pindel23. Flanking sequences are shown for reference
(REF) and alternate (ALT) alleles, further to insertions at the breakpoints.
Proximal stretches matching the insertion are labelled in red (forward) and green (reverse complement). Blue, insertions lacking nearby matches. d, Alignment dot plots depicting inversions (inverted sequences are in red within each dot plot). Adjacent schemes depict allelic structures for REF and ALT. e, Inversion complexity summarized.
threefold for common SVs, which emphasizes the relevance of ascer-taining SVs in disease studies. The large number of novel SVs smaller than 1 kbp in length associated with previously reported GWAS hits highlights the importance of increasing sensitivity for SV detection and genotyping at this size range. Additionally, the large number of rare SVs captured by our resource may be of value for disease asso-ciation studies investigating rare variants.
Our deep population survey has identified hotspots of SV mutation that cannot be accounted for by deep coalescence or segmental duplication content. We describe hitherto undescribed patterns of SV complexity, particularly for inversions. These patterns indicate that other more complex mutational processes outside of non-allelic homologous recombination, retrotransposition, and non-homologous end-joining played an important role in shaping our genome. In spite of this, it remains difficult to fully disentangle the contributions of SV mutation rates and selective forces to the observed variant clustering. The findings presented here leveraged substantial recent technolo-gical advances, including increases in Illumina read length and devel-opments in long-read DNA technologies. SV discovery remains a challenge nonetheless, and the full complexity and spectrum of SV is not yet understood. Our analyses, for example, are largely based on 7.4-fold Illumina WGS and, thus, are underpowered to capture much of the complexity of variation, including SVs in repetitive regions, non-reference insertions, and short SVs at the boundaries of the detection limits of read-depth and paired-end-based SV discovery4. Furthermore, while many SVs in our callset are statistically phased, the diploid nature of the genome is non-optimally captured by current analysis approaches, which mostly rely on mapping to a haploid reference. We envision that in the future, the use of technology allowing substantial increases in read lengths over the current state-of-the-art will enable genomic analyses of truly diploid sequences to facilitate targeting these additional layers of genomic complexity. Until this is realized, our SV set represents an invaluable resource for the construction and analysis of personalized genomes.
Online Content Methods, along with any additional Extended Data display items and Source Data, are available in the online version of the paper; references unique to these sections appear only in the online paper.
Received 19 February; accepted 20 August 2015.
1. Weischenfeldt, J., Symmons, O., Spitz, F. & Korbel, J. O. Phenotypic impact of genomic structural variation: insights from and for human disease. Nature Rev. Genet.14, 125–138 (2013).
2. Malhotra, D. & Sebat, J. CNVs: harbingers of a rare variant revolution in psychiatric genetics. Cell148, 1223–1241 (2012).
3. Hastings, P. J., Lupski, J. R., Rosenberg, S. M. & Ira, G. Mechanisms of change in gene copy number. Nature Rev. Genet.10, 551–564 (2009).
4. Alkan, C., Coe, B. P. & Eichler, E. E. Genome structural variation discovery and genotyping. Nature Rev. Genet.12, 363–376 (2011).
5. Wellcome Trust Case Control Consortium. Genome-wide association study of CNVs in 16,000 cases of eight common diseases and 3,000 shared controls. Nature464, 713–720 (2010).
6. Mills, R. E. et al. Mapping copy number variation by population-scale genome sequencing. Nature470, 59–65 (2011).
7. Sudmant, P. H. et al. Diversity of human copy number variation and multicopy genes. Science330, 641–646 (2010).
8. The 1000 Genomes Project Consortium. An integrated map of genetic variation from 1,092 human genomes. Nature491, 56–65 (2012).
9. The 1000 Genomes Project Consortium. A map of human genome variation from population-scale sequencing. Nature467, 1061–1073 (2010).
10. Conrad, D. F. et al. Origins and functional impact of copy number variation in the human genome. Nature464, 704–712 (2010).
11. Kidd, J. M. et al. A human genome structural variation sequencing resource reveals insights into mutational mechanisms. Cell143, 837–847 (2010).
12. Korbel, J. O. et al. Paired-end mapping reveals extensive structural variation in the human genome. Science318, 420–426 (2007).
13. Pang, A. W. et al. Towards a comprehensive structural variation map of an individual human genome. Genome Biol.11, R52 (2010).
14. Chaisson, M. J. et al. Resolving the complexity of the human genome using single-molecule sequencing. Nature517, 608–611 (2015).
15. Teague, B. et al. High-resolution human genome structure by single-molecule analysis. Proc. Natl Acad. Sci. USA107, 10848–10853 (2010).
16. The 1000 Genomes Project Consortium. A global reference for human genetic variation. Nature http://dx.doi.org/10.1038/nature15393 (this issue).
17. Li, H. & Durbin, R. Fast and accurate long-read alignment with Burrows-Wheeler transform. Bioinformatics26, 589–595 (2010).
18. Hach, F. et al. mrsFAST-Ultra: a compact, SNP-aware mapper for high performance sequencing applications. Nucleic Acids Res.42, W494–W500 (2014).
19. MacDonald, J. R., Ziman, R., Yuen, R. K., Feuk, L. & Scherer, S. W. The Database of Genomic Variants: a curated collection of structural variation in the human genome. Nucleic Acids Res.42, D986–D992 (2014).
20. Stewart, C. et al. A comprehensive map of mobile element insertion polymorphisms in humans. PLoS Genet.7, e1002236 (2011).
21. Martı´nez-Fundichely, A. et al. InvFEST, a database integrating information of polymorphic inversions in the human genome. Nucleic Acids Res.42, D1027–D1032 (2014).
22. Pendleton, M. et al. Assembly and diploid architecture of an individual human genome via single-molecule technologies. Nature Methods12, 780–786 (2015). 23. Ye, K., Schulz, M. H., Long, Q., Apweiler, R. & Ning, Z. Pindel: a pattern growth
approach to detect break points of large deletions and medium sized insertions from paired-end short reads. Bioinformatics25, 2865–2871 (2009).
24. Kloosterman, W. P. et al. Characteristics of de novo structural changes in the human genome. Genome Res.25, 792–801 (2015).
25. McCarroll, S. A. et al. Integrated detection and population-genetic analysis of SNPs and copy number variation. Nature Genet.40, 1166–1174 (2008).
26. Locke, D. P. et al. Linkage disequilibrium and heritability of copy-number polymorphisms within duplicated regions of the human genome. Am. J. Hum. Genet.79, 275–290 (2006).
27. Handsaker, R. E. et al. Large multiallelic copy number variations in humans. Nature Genet.47, 296–303 (2015).
28. Simons, Y. B., Turchin, M. C., Pritchard, J. K. & Sella, G. The deleterious mutation load is insensitive to recent population history. Nature Genet.46, 220–224 (2014). 29. Redon, R. et al. Global variation in copy number in the human genome. Nature444,
444–454 (2006).
30. Stefansson, H. et al. A common inversion under selection in Europeans. Nature Genet.37, 129–137 (2005).
31. ENCODE Project Consortium. An integrated encyclopedia of DNA elements in the human genome. Nature489, 57–74 (2012).
32. McVicker, G., Gordon, D., Davis, C. & Green, P. Widespread genomic signatures of natural selection in hominid evolution. PLoS Genet.5, e1000471 (2009). 33. Petrovski, S., Wang, Q., Heinzen, E. L., Allen, A. S. & Goldstein, D. B. Genic intolerance
to functional variation and the interpretation of personal genomes. PLoS Genet.9, e1003709 (2013).
34. Stranger, B. E. et al. Relative impact of nucleotide and copy number variation on gene expression phenotypes. Science315, 848–853 (2007).
35. Schlattl, A., Anders, S., Waszak, S. M., Huber, W. & Korbel, J. O. Relating CNVs to transcriptome data at fine resolution: assessment of the effect of variant size, type, and overlap with functional regions. Genome Res.21, 2004–2013 (2011). 36. Lappalainen, T. et al. Transcriptome and genome sequencing uncovers functional
variation in humans. Nature501, 506–511 (2013).
37. Moore, T. & Dveksler, G. S. Pregnancy-specific glycoproteins: complex gene families regulating maternal-fetal interactions. Int. J. Dev. Biol.58, 273–280 (2014).
38. Girirajan, S. et al. Relative burden of large CNVs on a range of neurodevelopmental phenotypes. PLoS Genet.7, e1002334 (2011).
39. International HapMap Consortium. A haplotype map of the human genome. Nature437, 1299–1320 (2005).
40. Conrad, D. F. et al. Mutation spectrum revealed by breakpoint sequencing of human germline CNVs. Nature Genet.42, 385–391 (2010).
Supplementary Information is available in the online version of the paper. Acknowledgements We thank M. Hurles, R. Durbin and D. Reich for valuable comments during the preparation of this work, S. Scherer for providing PCR-based inversion genotyping data for the initial calibration of our inversion caller, B. Nelson and V. Benes for technical assistance, and T. Brown and N. Habermann for critical review of the manuscript. The following people are acknowledged for contributing to PacBio sequencing or analysis: E. Patel, S. Lee, H. Doddapaneni, L. Lewis, R. Ruth, Q. Meng, V. Vee, Y. Han, J. Jayaseelan, A. English, J. Korlach, M. Hunkapiller, B. Hu¨ttel and R. Reinhardt. We acknowledge the Yale University Biomedical High-Performance Computing Center and high-performance compute infrastructure made available through the EMBL and EMBL-EBI IT facilities. We thank the people generously contributing samples to the 1000 Genomes Project. Funding for this research project came from the following grants: NIH U41HG007497 (to C.L., E.E.E., J.O.K., M.A.B., M.G., S.A.M., R.E.M. and J.S.), RO1GM59290 (M.A.B.), R01HG002898 (S.E.D.) and R01CA166661 (S.E.D.), P01HG007497 (to E.E.E.), R01HG007068 (to R.E.M.), RR19895 and RR029676-01 (to M.B.G.), Wellcome Trust WT085532/Z/08/Z and WT104947/Z/14/Z (to P.F.), an Emmy Noether Grant from the German Research Foundation (KO4037/1-1, to J.O.K.) and the European Molecular Biology Laboratory. C.L. is on the scientific advisory board (SAB) of BioNano Genomics. E.E.E. is.on the scientific advisory board (SAB) of DNAnexus, Inc. and is a consultant for Kunming University of Science and Technology (KUST) as part of the 1000 China Talent Program. P.F. is on the SAB of Omicia, Inc. C.L. is an Ewha Womans University Distinguished Professor. E.E.E. is an investigator of the Howard Hughes Medical Institute. J.O.K. is a European Research Council investigator.
Author Contributions SV discovery & genotyping: R.E.H., P.H.S., T.R., E.J.G., A.Ab., K.Y., F.H., K.C., G.D., K.W., M.H.-Y.F., S.K., C.A., S.A.M., R.E.M., K.Y., M.B.G., S.E.D., E.E.E., J.O.K.; SV merging & haplotype-integration: T.R., R.E.H., M.H.-Y.F., E.G., A.Me., S.McC.; SV validation: R.E.H., A.Ab., G.J., M.H.-Y.F., A.M.S., M.K.K., A.Ma., S.K., M.M., M.J.P.C., S.M., P.C., S.E., J.M.K., B.R., J.A.W., F.Y., T.Z., M.A.B., R.E.M., A.B., C.L., E.E.E., J.O.K.; additional analyses: A.Au.,
8 0 | N A T U R E | V O L 5 2 6 | 1 O C T O B E R 2 0 1 5
C.E.M., E.C., E.D., E.-W.L., F.K., J.H., Y.Z., X.S., F.P.C., M.M., M.J.P.C., G.M., S.M., D.A., T.B., J.C., Z.C., L.D., X.F., M.G., J.M.K., H.Y.K.L., Y.K., X.J.M., B.J.N., A.N., R.A.G., M.P., M.R., R.S., D.M.M., M.W., N.F.P., A.Q., E.E.S., A.S., A.A.S., A.U., C.Z., J.Z., W.Z., J.S., O.S.; data management & archiving: L.C., X.Z.-B., P.F.; display items: P.H.S., T.R., E.J.G., A.A., Y.Z., J.H., M.H.-Y.F., K.Y., M.B.G., A.B., O.S., R.E.M., S.E.D., E.E.E., J.O.K.; organization of Supplementary Material: G.D., J.O.K., P.H.S., R.E.M.; SV Analysis group co-chairs: C.L., E.E.E., J.O.K.; manuscript writing: P.H.S., T.R., E.J.G., J.H., R.E.M., M.B.G., O.S., S.E.D., E.E.E., J.O.K.
Author Information Sequencing data, archive accessions and supporting datasets including GRCh37 variant call files comprising the extended SV Analysis Group release set, a ‘readme’ describing differences to the phase 3 marker paper variant release16, and a GRCh38 version of our callset, are available at http://www.1000genomes.org/ phase-3-structural-variant-dataset. DGV archive accession: estd219. Reprints and permissions information is available at www.nature.com/reprints. The authors declare competing financial interests: details are available in the online version of the paper. Readers are welcome to comment on the online version of the paper. Correspondence and requests for materials should be addressed to E.E.E. ([email protected]) or J.O.K. ([email protected]).
This work is licensed under a Creative Commons Attribution-NonCommercial-ShareAlike 3.0 Unported licence. The images or other third party material in this article are included in the article’s Creative Commons licence, unless indicated otherwise in the credit line; if the material is not included under the Creative Commons licence, users will need to obtain permission from the licence holder to reproduce the material. To view a copy of this licence, visit http://creativecommons. org/licenses/by-nc-sa/3.0
Peter H. Sudmant1*, Tobias Rausch2*, Eugene J. Gardner3*, Robert E. Handsaker4,5*, Alexej Abyzov6*, John Huddleston1,7*, Yan Zhang8,9*, Kai Ye10,11*, Goo Jun12,13, Markus Hsi-Yang Fritz2, Miriam K. Konkel14, Ankit Malhotra15, Adrian M. Stu¨tz2, Xinghua Shi16, Francesco Paolo Casale17, Jieming Chen8,18, Fereydoun Hormozdiari1, Gargi Dayama19, Ken Chen20, Maika Malig1, Mark J. P. Chaisson1, Klaudia Walter21, Sascha Meiers2, Seva Kashin4,5, Erik Garrison22, Adam Auton23, Hugo Y. K. Lam24, Xinmeng Jasmine Mu8,25, Can Alkan26, Danny Antaki27, Taejeong Bae6, Eliza Cerveira15, Peter Chines28, Zechen Chong20, Laura Clarke17, Elif Dal26, Li Ding10,11,29,30, Sarah Emery31, Xian Fan20, Madhusudan Gujral27, Fatma Kahveci26, Jeffrey M. Kidd12,31, Yu Kong23, Eric-Wubbo Lameijer32, Shane McCarthy21, Paul Flicek17, Richard A. Gibbs33, Gabor Marth22, Christopher E. Mason34,35, Androniki Menelaou36,37, Donna M. Muzny38, Bradley J. Nelson1, Amina Noor27, Nicholas F. Parrish39, Matthew Pendleton38, Andrew Quitadamo16, Benjamin Raeder2, Eric E. Schadt38, Mallory Romanovitch15, Andreas Schlattl2, Robert Sebra38, Andrey A. Shabalin40, Andreas Untergasser2,41, Jerilyn A. Walker14, Min Wang33, Fuli Yu33, Chengsheng Zhang15, Jing Zhang8,9, Xiangqun Zheng-Bradley17, Wanding Zhou20, Thomas Zichner2, Jonathan Sebat27, Mark A. Batzer14, Steven A. McCarroll4,5, The 1000 Genomes Project Consortium{, Ryan E. Mills19,311, Mark B. Gerstein8,9,421, Ali Bashir381, Oliver Stegle171, Scott E. Devine31, Charles Lee15,431, Evan E. Eichler1,71& Jan O. Korbel2,171
1
Department of Genome Sciences, University of Washington, 3720 15th Avenue NE, Seattle, Washington 98195-5065, USA.2
European Molecular Biology Laboratory (EMBL), Genome Biology Unit, Meyerhofstrasse 1, 69117 Heidelberg, Germany.3
Institute for Genome Sciences, University of Maryland School of Medicine, 801 W Baltimore Street, Baltimore, Maryland 21201, USA.4
Department of Genetics, Harvard Medical School, Boston, 25 Shattuck Street, Boston, Massachusetts 02115, USA.5
Program in Medical and Population Genetics, Broad Institute of MIT and Harvard, 415 Main Street, Cambridge, Massachusetts 02142, USA.6
Department of Health Sciences Research, Center for Individualized Medicine, Mayo Clinic, 200 First Street SW, Rochester, Minnesota 55905,
USA.7
Howard Hughes Medical Institute, University of Washington, Seattle, Washington 98195, USA.8
Program in Computational Biology and Bioinformatics, Yale University, BASS 432 & 437, 266 Whitney Avenue, New Haven, Connecticut 06520, USA. 9
Department of Molecular Biophysics and Biochemistry, School of Medicine, Yale University, 266 Whitney Avenue, New Haven, Connecticut 06520, USA.10
The Genome Institute, Washington University School of Medicine, 4444 Forest Park Avenue, St Louis, Missouri 63108, USA.11
Department of Genetics, Washington University in St Louis, 4444 Forest Park Avenue, St Louis, Missouri 63108, USA.12
Department of Biostatistics and Center for Statistical Genetics, University of Michigan, 1415 Washington Heights, Ann Arbor, Michigan 48109, USA.13
Human Genetics Center, School of Public Health, The University of Texas Health Science Center at Houston, 1200 Pressler St., Houston, Texas 77030, USA.14
Department of Biological Sciences, Louisiana State University, 202 Life Sciences Building, Baton Rouge, Louisiana 70803, USA.15
The Jackson Laboratory for Genomic Medicine, 10 Discovery 263 Farmington Avenue, Farmington, Connecticut 06030, USA.16
Department of Bioinformatics and Genomics, University of North Carolina at Charlotte, 9201 University City Blvd., Charlotte, North Carolina 28223, USA. 17
European Molecular Biology Laboratory, European Bioinformatics Institute (EMBL-EBI), Wellcome Trust Genome Campus, Hinxton, Cambridge CB10 1SD, UK.18
Integrated Graduate Program in Physical and Engineering Biology, Yale University, New Haven, Connecticut 06520, USA.19
Department of Computational Medicine & Bioinformatics, University of Michigan, 500 S. State Street, Ann Arbor, Michigan 48109, USA.20
The University of Texas MD Anderson Cancer Center, 1515 Holcombe Boulevard, Houston, Texas 77030, USA.21
The Wellcome Trust Sanger Institute, Wellcome Trust Genome Campus, Hinxton, Cambridge CB10 1SA, UK.22
Department of Biology, Boston College, 355 Higgins Hall, 140 Commonwealth Avenue, Chestnut Hill, Massachusetts 02467, USA. 23
Department of Genetics, Albert Einstein College of Medicine, 1301 Morris Park Avenue, Bronx, New York 10461, USA.24
Bina Technologies, Roche Sequencing, 555 Twin Dolphin Drive, Redwood City, California 94065, USA.25
Cancer Program, Broad Institute of MIT and Harvard, 415 Main Street, Cambridge, Massachusetts 02142, USA.26
Department of Computer Engineering, Bilkent University, 06800 Ankara, Turkey.27
University of California San Diego (UCSD), 9500 Gilman Drive, La Jolla, California 92093, USA. 28
National Human Genome Research Institute, National Institutes of Health, Bethesda, Maryland 20892 USA.29
Department of Medicine, Washington University in St Louis, 4444 Forest Park Avenue, St Louis, Missouri 63108, USA.30
Siteman Cancer Center, 660 South Euclid Avenue, St Louis, Missouri 63110, USA.31
Department of Human Genetics, University of Michigan, 1241 Catherine Street, Ann Arbor, Michigan 48109, USA. 32
Molecular Epidemiology, Leiden University Medical Center, Leiden 2300RA, The Netherlands.33
Baylor College of Medicine, 1 Baylor Plaza, Houston, Texas 77030, USA. 34
The Department of Physiology and Biophysics and the HRH Prince Alwaleed Bin Talal Bin Abdulaziz Alsaud Institute for Computational Biomedicine, 1305 York Avenue, Weill Cornell Medical College, New York, New York 10065, USA.35
The Feil Family Brain and Mind Research Institute, 413 East 69th St, Weill Cornell Medical College, New York, New York 10065, USA.36
University of Oxford, 1 South Parks Road, Oxford OX3 9DS, UK. 37
Department of Medical Genetics, Center for Molecular Medicine, University Medical Center Utrecht, Utrecht, 3584 CG, The Netherlands.38
Department of Genetics and Genomic Sciences, Icahn School of Medicine, New York School of Natural Sciences, 1428 Madison Avenue, New York, New York 10029, USA.39
Institute for Virus Research, Kyoto University, 53 Shogoin Kawahara-cho, Sakyo-ku, Kyoto 606-8507, Japan.40
Center for Biomarker Research and Precision Medicine, Virginia Commonwealth University, 1112 East Clay Street, McGuire Hall, Richmond, Virginia 23298-0581, USA.41
Zentrum fu¨r Molekulare Biologie, University of Heidelberg, Im Neuenheimer Feld 282, 69120 Heidelberg, Germany.42
Department of Computer Science, Yale University, 51 Prospect Street, New Haven, Connecticut 06511, USA.43
Department of Graduate Studies – Life Sciences, Ewha Womans University, Ewhayeodae-gil, Seodaemun-gu, Seoul 120-750, South Korea.
*These authors contributed equally to this work.
{A list of participants and their affiliations appears in the Supplementary Information. 1These authors jointly supervised this work.
1 O C T O B E R 2 0 1 5 | V O L 5 2 6 | N A T U R E | 8 1 G2015 Macmillan Publishers Limited. All rights reserved
Extended Data Figure 1|Construction of the SV release and intensity rank sum validation. a, Approach used for constructing our SV release set. b, Intensity rank sum (IRS) validation results for deletions in different size bins. c, IRS validation results for deletions in variant allele frequency (VAF) bins.
d, IRS results for duplications in different size bins. e, IRS validation results for duplications in VAF bins. Based on Affymetrix SNP6 array probes, the IRS FDR for all SV length and VAF bins was #5.4%, requiring at least 100 SVs per bin with an IRS assigned P-value.
Extended Data Figure 2|This figure shows the number of SV sites in our phase 3 release relative to allele frequency expressed in terms of allele count. SVs down to an allele count of 1 (corresponding to VAF 5 0.0002) are represented in our phase 3 SV set (with the exception of mCNVs, denoted
‘CNV’ in this figure, which are defined as sites of multi-allelic variation thus requiring allele count $2, hence no mCNV sites are ascertained for allele count 5 1).
Extended Data Figure 3|Size and population distribution of different SV
classes. a, Variants ascertained in the 1000 Genomes Project pilot phase6(light
grey) as well as the recent publication of SVs ascertained by PacBio sequencing
in the CHM1 genome14(grey) are displayed for comparison in this SV size
distribution figure (INS, used as abbreviation for MEIs and NUMTs in this display item). b, Population distribution of SV allele sharing across continental groups for different SV classes. c, Cumulative distributions of the number of events as a function of size by SV class.
Extended Data Figure 4|LD properties of various SV classes. a, LD properties of deletions, broken down by continental group and shown as a function of VAF. b, LD properties of duplications. c, LD properties of Alu, L1 and SVA mobile element insertions. d, LD properties of inversions (with breakdown for two independent inversion sets generated with our inversion
discovery algorithm Delly; that is, CINV 5 one-sided inversions with support for one breakpoint; INV 5 two-sided inversions with support for both breakpoints; these two sets are combined into the joint phase3 SV group inversion set).
Extended Data Figure 5|Population genetic properties of SVs. a, Deletion heterozygosity and homozygosity among human populations for a subset of high-confidence deletions. Populations from the African continental group (AFR) exhibit the highest levels of heterozygosity and thus diversity among humans, but show the overall lowest level of deletion homozygosity among all continental groups. By comparison, East Asian populations exhibited the lowest levels of deletion heterozygosity and the highest levels of homozygosity. Het., heterozygous; Hom., homozygous. b, VAF distribution of major SV classes. Bi-allelic duplications represent a notable outlier, showing a striking depletion of common alleles, which can be explained by the preponderance of genomic sites of duplication to undergo recurrent rearrangement (see main text). As a consequence, most common duplications are classified as multi-allelic variants (that is, mCNVs). c, The number of base pairs (bp) differing
among individuals within and between continental groups for deletions (upper panel) and SNPs (middle panel) contrasted with the ratio of deletion bp differences to SNP bp differences (‘deletion bp/SNP bp’) among groups (lower panel). Non-African groups exhibit a higher ‘deletion bp/SNP bp’ compared to Africans. d, Neighbour-joining tree of populations constructed from MEIs (homoplasy-free markers) to provide a (simplified) view of population ancestry. The tree is labelled with the number of lineage-specific MEIs (Alu:L1:SVA). e, Classification of ancestry in AFR/AMR and AMR admixed populations using homoplasy-free ancestry informative MEI markers. Colour usage follows the same scheme as in Fig. 1d, except in the case of AFR individuals, which use both the colour in Fig. 1d and another colour that is unrelated to any other figure to indicate additional substructure within this group.
Extended Data Figure 6|Principal component analysis and population stratification of SVs. a, Principal component analysis (PCA) plot of principal components 1 and 2 for deletions. b, PCA plot of principal components 3 and 4 for deletions. c, PCA plot of principal components 1 and 2 for MEIs. d, PCA plot of principal components 3 and 4 for MEIs.
e, The five most highly population-stratified deletions intersecting
protein-coding genes based on VST. f, The five most highly population-stratified
duplications and multi-allelic copy number variants (mCNVs) intersecting
protein-coding genes based on VST. For abbreviations, see Supplementary
Table 1.
Extended Data Figure 7|Enrichment of functional elements intersecting SVs. a, Shadow figure of Fig. 2a. Overlap enrichment analysis of deletions (with resolved breakpoints) versus genomic elements, using partial overlap statistic, deletions categorized into VAF bins. b, Similar to a. The only difference is that engulf overlap statistic is used instead of partial overlap statistic. Engulf overlap statistic is the count of genomic elements (for example, CDS) that are fully imbedded in at least one SV interval (for example,
deletions). *no element intersected observed within data set. c, Similar to a and b, with the enrichment/depletion analysis pursued for common SNPs as well as more rare single nucleotide polymorphisms/variants (SNVs). Common SNV alleles show the highest levels of depletion for investigated genomic elements. d, Overlap enrichment analysis of various SV types versus genomic elements, using partial overlap statistic.
Extended Data Figure 8|SV-eQTL analysis. a, SV-centric eQTL analysis of coding SVs. Shown is the proportion of coding SVs that are eQTLs as a function of the minimum VAF and the expression quartile. b, Total number of coding SVs for corresponding filters. Common SVs (VAF . 0.2) in highly expressed genes (.75% quantile) are very likely to correspond to SV-eQTLs (54%, see also Supplementary Table 8). c, For all genes with significant eQTLs (FDR , 10%), shown are raw P-values considering only SNPs (x axis) or only SVs (y axis). Genes with (strict lead) SV-eQTLs are shown in red. Genes
with a SNP lead eQTL that is in linkage with an SV (r2.0.5) are shown in
orange. SNP lead eQTLs without an SV in LD are shown in blue. d, Relative eQTL effect sizes for genetic and intergenic SV eQTLs (n 5 239) either with an SV-eQTL or an LD tagged SV (in log abundance scale). Shown are regression trends for both genic and intergenic SV eQTls. For genetic eQTLs, a clear relationship between SV effect size is found. For example, genic SVs .10 kb have threefold larger effect sizes compared to genic SVs , 1 kb; P 5 0.004; t-test.
Extended Data Figure 9|SV clustering and breakpoint analysis. a–c, Extensive clustering of recurrent SVs into CNVRs appears unrelated to the extent of segmental duplications (a) and is only partially correlating with SNP diversity (b) and GC content (c). Breakdown of SV mechanism classifications based on criteria from two earlier studies (refs 6, 40). Shown are results for deletions with nucleotide resolved breakpoints. BreakSeq was used for mechanism inference. d, 1KG_P3: breakdown for our 1000 Genomes Project phase 3 SV callset using classification criteria from ref. 6. e, Conrad_2010: summary of mechanism classification results published in ref. 40. f, Mills_2011: summary of mechanism classification results published in ref. 6.
g, 1KG_P3_Conrad: Breakdown for our 1000 Genomes Project phase 3 SV callset using classification criteria from ref. 40. Mechanism classification was pursued using four different categories. Blue, non-allelic homologous recombination (NAHR); green, mobile elements inserted into the reference genomes (appearing deleted in this analysis); red, non-homology-based
rearrangement mechanisms (NHR), such as NHEJ, microhomology-mediated end-joining and microhomology-mediated break-induced replication (involving blunt-ended deletion breakpoints or breakpoints with
microhomoloy); purple, expansion or shrinkage of variable numbers of tandem repeats (VNTRs). TEI, transposable element insertion (equivalent with MEI). h, Distribution of lengths of micro-homology (MH) for complex SVs, measured between deletion and corresponding template sites boundaries. Simple deletions, which based on BreakSeq were inferred to be formed by a non-homology-based SV formation mechanism, such as NHEJ and microhomology-mediated break-induced replication (Supplementary Table 3), are shown as an additional control (here denoted ‘blunt NH deletions’). i, Origins of inserted sequences in complex deletions inferred by split read analysis. This figure depicts examples for each class shown in Supplementary Table 13.
Extended Data Figure 10|Examples of inversions identified in the SV release. a–e, Five classifications of inversions verified using PacBio and Minion reads are represented: Simple Inversion (a), inv-dup (b), inv-del (c), MultiDel with Inv (here abbreviated as inv-2dels) (d) and complex (e). f, Several further examples of inverted duplications (inv-dup), the most common form of inversion-associated SV identified in the phase 3 release set. The figure is
depicting DNA sequence alignment dotplots (same arrangement as in Fig. 3), with the y axis referring to PacBio DNA single molecule sequencing reads and the x axis referring to the reference genome assembly (hg19). Inverted sequences are highlighted in red. Sequence analysis suggests that these inverted duplications are not typically associated with retrotransposition.