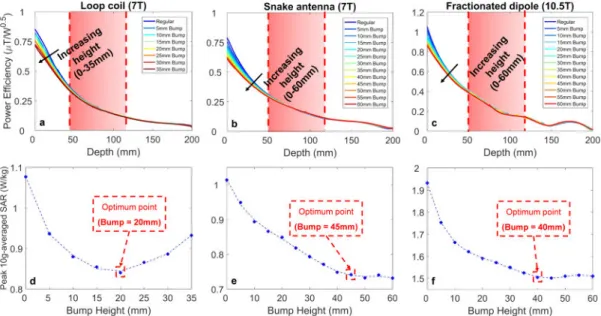
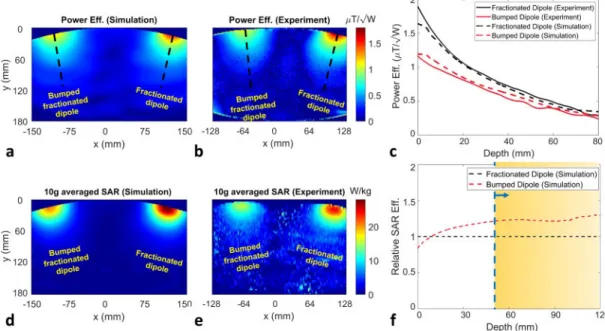
Novel techniques and innovative designs for the RF chain of magnetic resonance imaging scanners
Tam metin
Şekil
Benzer Belgeler
Engelli istihdamı içersinde kadın engellilerin istihdama ne oranda katıldığı, engelli kadınlara uygun görülen işlerin yapısı ve kalitesi, engelli kadınların üsleri
As it is stated, there are six type of shocks in this model. However, since my main aim is to observe the effectiveness of reserve requirements on current account deficit, I will
We test the proposed action recognition method on a publicly available mice action dataset and achieve promising recognition rates.. In addition, we compare our method to
When a researcher removes their footsteps – preferences they made during the research design process, difficulties, failures, and shortcomings they have faced during the
Greece on the other hand has adopted a facilitative conditionality policy towards Turkey by appearing to support Turkey’s EU membership on the condition (and in the hope) that
Various estimation tools have been used to estimate the channel parameters such as Multiple Signal Classifica- tion (MUSIC), Estimation of Signal Parameter via Rota- tional
While 3D hexagonal Bi crystal with a small direct band gap and inverted indirect band gap is a semimetal, its single-layer buckled honeycomb structure is a narrow band
1613 cm -1 daki güçlü absorpsiyon bandının varlığı karboksilat grubunun (-COO) varlığını doğrular. CMC1F‘nin spektrumunda da görüldüğü gibi esterleşmiş
