Received by the editors: November 11, 2017; Accepted: December 17, 2017.
Key word and phrases: Muscle fatigue, EMG, FFT, Wavelet
© 2018 Ankara University Communications Faculty of Sciences University of Ankara Series A2-A3: Physical Sciences and Engineering Communications de la Faculté des Sciences de l'Université d'Ankara-Séries A2-A3: Physical Sciences and Engineering
DETECTION OF MUSCLE FATIGUE: RELATIVE STUDY WITH DIFFERENT METHODS
MOHAMED REZKI, ISSAM GRICHE, ABDELKADER BELAIDIAND MOULOUD AYAD
Abstract.This paper aims to investigate problem of muscle fatigue through the application of a comparative study by different processing techniques in order to see the effect of physical exercise on Electromyography characteristics. Indeed, electromyography is the best physiological examination to study muscle activity and it is translated by an electromyogram (EMG). The analysis of the biomedical signal "EMG" before and after physical exercise allowed us to quantify the physical effort and give some diagnostic elements that can help the practitioner. We applied some signal processing techniques to quantify the physical effort and therefore we were able to identify and detect muscle fatigue.
1. Introduction
EMG is the process by which an examiner puts a needle (or electrode) into a particular muscle and studies the electrical activity of that muscle (this electrical activity comes from the muscle itself) [1].
The EMG is a signal that must be recorded, so there are several electronic acquisition platforms (Arduino, PowerLab from ADInstruments Ltd, Data Acquisition card “DAQ” from National Instruments, etc.). We have chosen as an acquisition platform the Arduino mega card for its availability (see figure 01). This card must be connected through electrodes on the surface of the skin because the EMG is a non-invasive examination (Figure 2).
laboratory. We chose a physical exercise that causes the muscular fatigue of the hand (see figure 03); the reference being open hand.
Figure 3.Physical exercise provoking hand’s fatigue. 2. Materials and Methods
2.1 Data acquisition
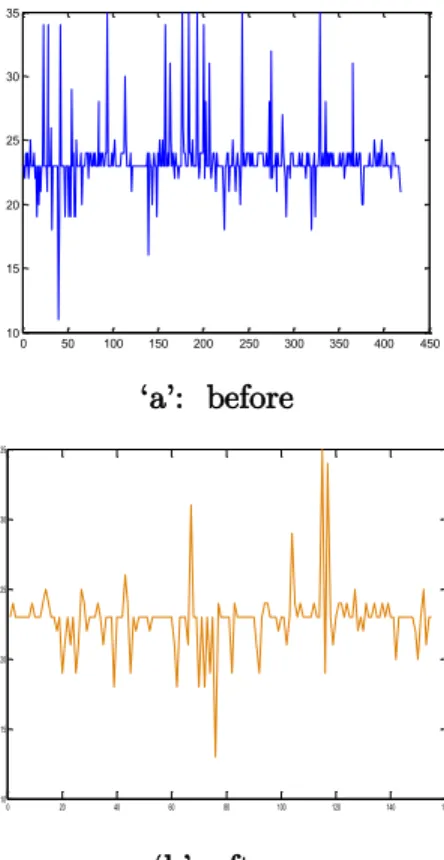
After performing physical exercise (see Figure 03), we obtain the following results (Figure 04):
As a first observation, one sees from the shape of the acquired signals that physical exercise has caused a dilation of the signal, that is to say the peaks (representing the activity of the muscular fibers) become more and more spaced.
‘a’: before
‘b’: after
Figure 4. Acquired data before and after doing hard exercise.
2.2 Processing techniques
2.2.1 Fast Fourier Transform. The Fast Fourier Transform (FFT) is is
commonly used in analyzing the spectral content of any deterministic biosignal, it’s a numerical approach for quick computation of the Discrete Fourier transform (DFT). The equation of DFT is as follows [3]:
𝑋(𝑘) = 1 𝑁∑ 𝑥(𝑛)𝑒 −𝑗(2𝜋𝑘𝑛 𝑁𝑇 ) 𝑁−1 𝑛=0 (2.1)
where: X(n) is the input biosignal whose sampling period is T. The spectrum
X(k) is estimated at multiples of: fs/N, where fs is the sampling frequency.
2.2.2 Wavelet Transform technique. Wavelet is a wave-like oscillation with
amplitude that begins at zero, increases, and then decreases back to zero. We
0 50 100 150 200 250 300 350 400 450 10 15 20 25 0 20 40 60 80 100 120 140 160 10 15 20 25 30 35
(2.3)
𝑎: is the dilation parameter.
s : is the translation parameter.
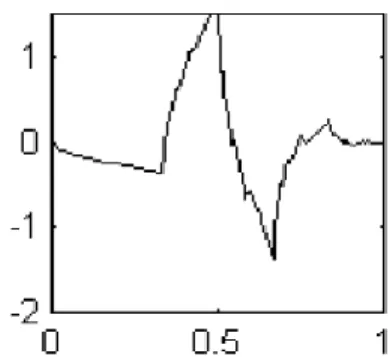
There are numerous analyzing wavelet called mother wavelets such as: Haar, Mexican hat, Morlet and Daubechies. This latter seems (Duabechies) the most used in the analysis of biological signals [6]. Its shape can be seen in the following figure:
Figure 5: Diagram of the wavelets mother function “Daubechies”
3. Results and Discussion 3.1. Fast Fourier Transform
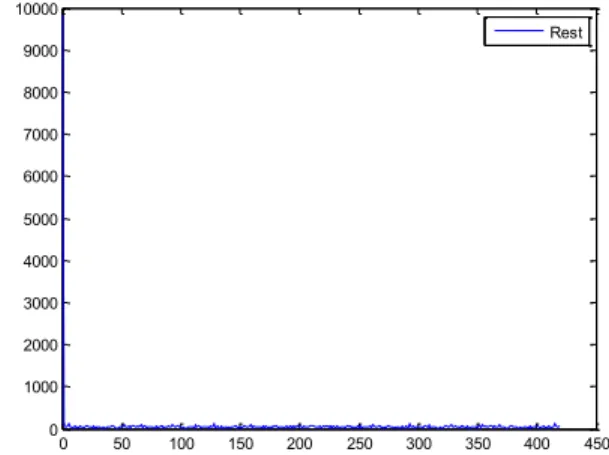
By applying the Fast Fourier Transform technique on the primary signals (raw data), we get the following curves:
Figure 6. FFT of Rest’s case (without effort).
Figure 7. FFT of effort’s case (with effort)
From the figures, we note that the effort incite an extension of the signal intensity (to 4000) compared to the signal of rest. But in general the FFT technique gives little information for the analysis of biomedical signals. 3.2. Technique of wavelet
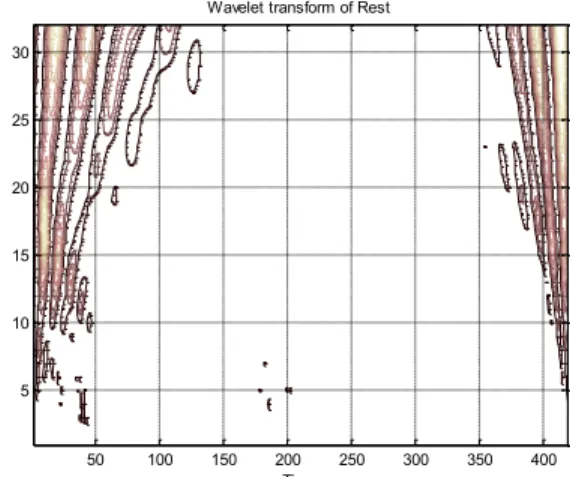
We have chosen the Daubechies continuous wavelet for treating our raw data. After running the Matlab program, we obtained these signals (Figures 8 and 9): 0 50 100 150 200 250 300 350 400 450 0 1000 2000 3000 4000 5000 6000 7000 8000 0 20 40 60 80 100 120 140 160 0 500 1000 1500 2000 2500 3000 3500 4000 effort
Figure 8. The wavelet transforms of an EMG signal (scalogram of Rest’s situation).
Figure 9. The wavelet transforms of an EMG signal (scalogram of Effort’s situation).
The first result is concentration of wavelet coefficients on the peaks of the EMG signal.
Another finding, we see clearly that the signal of effort’s wavelet is very rich in coefficients and in energy. So we can deduct from the shape of the signal confirms or not if there is fatigue.
Time
50 100 150 200 250 300 350 400 5
Wavelet transform of Effort
S ca le Time 20 40 60 80 100 120 140 5 10 15 20 25 30
general on Shannon wavelet entropy. The modified Shannon wavelet entropy is computed by [7]: (3.1) where, Pk
i is the distribution sequence obtained from wavelet coefficients. Pki
i is calculated by [7]:
(3.2)
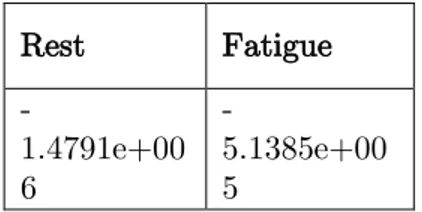
By calculating the maximum of Shannon entropy coefficient for the two cases (before and after getting fatigue ‘effort’), we get this table:
Table 1. Maximum of Shannon entropy Rest Fatigue -1.4791e+00 6 -5.1385e+00 5
We can deduct from the table that the fatigue’s muscle signal’s entropy is higher than the rest case. This signal of fatigue contains a lot of different information (very rich in information).
4. Conclusion
The analysis of EMG signal through the processing tools offered by Matlab is very useful to detect muscle fatigue. In this paper, we applied some signal
References
[1] J. M. Weiss, L.D Weiss and J.K. Silver, Easy EMG . Elsevier Inc., First edition, Philadelphia, USA, (2004) 4.
[2] R Arduino card. Retrieved: July, 12, 2017. Available at:
http://arduino.cc/.
[3] E. M. Kutz. Standard Handbook of Biomedical Engineering and Design.
McGraw-Hill Companies,Inc., First edition, New York, USA, (2003) 447-448.
[4] M.Rezki & al., De-noising a Signal’s ECG sensor using various Wavelets
Transforms and other analyzing techniques. International Journal of
Applied Engineering Research, (2013) 589-599.
[5] K. J. Blinowska, J. Zygierewicz, Practical Biomedical Signal Analysis
Using MATLAB. CRC Press, Taylor & Francis Group, LLC, First
edition, New York, USA, (2011) 54.
[6] J. Rafiee & al., Wavelet basis functions in biomedical signal processing. Expert Systems with Applications, vol.38 , (2011) 6190–6201.
[7] M.Ayad , D.Chikouche , N.Boukezzoula N and M.Rezki, Search of a robust defect signature in gear systems across adaptive Morlet wavelet of
vibration signals. IET Signal Processing, 8/9, (2014) 918 –926.
Current Address: MOHAMED REZKI, ISSAM GRICHE1, MOULOUD AYAD:
Department of Electrical Engineering, University of Bouira, 10000 Bouira, ALGERIA
E-mail Address: M. REZKI (Correspoding author)[email protected]
ORCID: https://orcid.org/0000-0003-2406-1644
Current Address: ABDELKADER BELAIDI: 2Department of electrical engineering,
![Figure 1. Model of Arduino Mega 2560 R3 Front [2].](https://thumb-eu.123doks.com/thumbv2/9libnet/4090881.59139/1.918.298.605.711.849/figure-model-of-arduino-mega-r-front.webp)