T.C.
SELÇUK ÜNİVERSİTESİ FEN BİLİMLERİ ENSTİTÜSÜ
April-2018 KONYA All rights reserved
OPTIMAL ACTIVE AND REACTIVE POWER DISPATCH IN SMART GRID (Nature-inspired optimization algorithms based approach)
Gaddafi Sani SHEHU Ph.D. Thesis
iv ÖZET DOKTORA TEZİ
AKILLI ŞEBEKELERDE OPTİMAL AKTİIF VE REAKTİF GÜÇ DAĞITIMI (Doğadan esinlenen optimizasyon algoritmaları tabanlı yaklaşım)
Gaddafi Sani SHEHU
Selçuk Üniversitesi Fen Bilimleri Enstitüsü Elektrik-Elektronik Mühendisliği Anabilim Dalı Danışman: Dr. Öğr. Üyesi Nurettin ÇETİNKAYA
2018, 100 Sayfa Jüri
Prof.Dr. Mehmet ÇUNKAŞ Doç.Dr. Ahmet AFŞİN KULAKSIZ
Doç.Dr. Muciz ÖZCAN Dr.Öğr.Üyesi Nurettin ÇETİNKAYA
Dr.Öğr.Üyesi Oktay ALTUN
Geçtiğimiz birkaç yıl içinde elektrik güç sektörü, artan enerji talebi, yüksek düzeyde yenilenebilir enerji, dağıtık güç sistemleri ve elektrikli araç kullanımı gibi sistemsel problemler ile karşımıza çıkmaktadır. Diğer yandan, yüksek güç kayıpları ve ekonomik yük dağıtımı, endüstri için kritik zorluklar oluşturmaktadır. Bu zorluklar, akıllı şebeke adı verilen yeni güç sistemi teknolojisinin geliştirilmesine yol açmakta, yeni sistem, elektrik üretimi, iletimi ve dağıtımı talebinin güvenilirlik ve en iyi kaliteyle en uygun maliyetle sağlanmasında verimlilik ve sürdürülebilirliği sağlamaktır. Bununla birlikte, güç şebekesinde akıllı şebekenin geliştirilmesiyle ilişkili karmaşıklık, hızlı yanıt, dağıtık enerji kaynaklarının ve elektrikli taşıtların bulunması ve müşteri katılımı gibi akıllı şebekenin özel karakteristikleri nedeniyle optimal güç dağıtım problemi daha zor hale gelmiştir. Güç dağıtım problemlerini çözmek için çeşitli matematiksel ve optimizasyon yöntemleri geliştirilmiştir. Mevcut güç şebekesinde, belirli güç limiti kısıtlamaları dahilinde bir miktar güç üretirken minimum maliyete ulaşmak için geleneksel ve merkezi metotları uygulamak pahalıdır ve güvenilir değildir. Bu çalışmada, güç dağıtım problemini çözmek için ilk olarak esinlenen optimizasyon algoritmaları ve hibrit algoritma ile güvenlik değerlendirmesi ve planlaması için akıllı bir şebeke öngörülmüştür. İkincisi, aşırı şarj nedeniyle yük talebinin yüksek olasılıklı doğasından dolayı ve dağıtık yenilenebilir enerji kaynaklarının payına sahip olan düşük dağıtım şebekesinde elektrikli araçların deşarj edilmesi, güvenli ve istikrarlı şebeke operasyonları için yüke katkıda bulunur. Bu nedenle, tasarım çerçevesini araştıracak mekanizmalar ve elektrikli taşıtların şarj hizmetlerinin sorunsuz bir şekilde sağlanabilmesini sağlayan ayarlama, böylece daha yüksek yenilenebilir enerji entegrasyonunun kolaylaştırılması ve elektrikli araçların azaltılmış bir maliyetle şarj edilmesinin sağlanması önerilmektedir. Son olarak, elektrikli araç şarjı için esnek fiyat ve reaktif güç enjeksiyon kontrolüne dayanan yeni bir algoritma seti önerilmiştir, algoritmalar mevcut şebeke altyapısını desteklemek ve şebekeye yükünü azaltmaya katkıda bulunmak için tasarlanmıştır. Yeni yaklaşım, elektrikli taşıtların ve yüklerin şebekeyle güç alışverişinin ötesine geçmesine izin verecek, aynı zamanda mevcut şebeke kapasitesinin etkin bir şekilde kullanılmasına olanak sağlayacaktır. Önerilen algoritmaların etkinliğini göstermek için farklı durumların simülasyon sonuçları Matlab yazılımı kullanılarak elde edilmiştir.
Anahtar Kelimeler: Akıllı dağıtım şebekesi; Doğadan esinlenen optimizasyon; Elektrikli Araç; Esnek fiyat; Güç dağıtımı; İleri besleme yapay sinir ağı; Reaktif güç kontrolü; Yük akış tahmini.
v ABSTRACT Ph.D. THESIS
OPTIMAL ACTIVE AND REACTIVE POWER DISPATCH IN SMART GRID (Nature-inspired optimization algorithms based approach)
Gaddafi Sani SHEHU
THE GRADUATE SCHOOL OF NATURAL AND APPLIED SCIENCE OF SELÇUK UNIVERSITY
THE DEGREE OF DOCTOR OF PHILOSOPHY IN ELECTRICAL-ELECTRONICS ENGINEERING
Thesis Advisor: Asst.Prof.Dr. Nurettin ÇETİNKAYA 2018, 100 Pages
Examining Committee Members Prof.Dr. Mehmet ÇUNKAŞ Assoc.Prof.Dr. Ahmet Afşin KULAKSIZ
Assoc.Prof.Dr. Muciz ÖZCAN Asst.Prof.Dr. Nurettin ÇETİNKAYA
Asst.Prof.Dr. Oktay ALTUN
Over the past few years electricity sector is confronted with growing energy demand, high level of renewable energy and Electric vehicle penetration, couple with total deregulation of power sector as commodity enterprises. On another hand, high aggregated power losses and Economic Dispatch constitutes critical challenges to the industry. These challenges lead to the development of new power system technology called smart grid, the new system is to ensured efficiency and sustainability in the delivery of electricity generation, transmission and distribution demand with reliability and best of quality at optimal cost. However, the complexity associated with the development of smart grid in power system is optimal power dispatch problems challenging due to special characteristics of the smart grid, such as fast response, accommodation of intermittent distributed energy resources and electric vehicles, and customer participation. Various mathematical and optimization methods have been developed to solve power dispatch problems. In current power grid, it is expensive and unreliable apply conventional centralized methods to achieve a minimum cost when generating an amount of power within certain power limit constraints. In this work, first nature-inspired optimization algorithms and hybrid algorithm to solve power dispatch problem and it is forecasting in a smart grid for security assessment and planning is proposed. Secondly due to high probabilistic nature of load demand due to excessive charging and discharging of electric vehicles at low distribution grid having a share of distributed renewable energy resources, contribute burden for the secure and stable grid operations. Hence mechanisms that will investigate design framework, and adjustment capable of the smooth provision of charging services of electric vehicles, thus facilitating higher renewable energy integration and penetration of electric vehicles charging at a reduced cost is proposed. Finally, a new set of algorithms based on flexible price and reactive power injection control for electric vehicle charging is proposed, the algorithms designed to support the existing grid infrastructure and contribute in reducing charging burden to the grid. The new approach will enable electric vehicles and loads to goes beyond exchanging power with the grid, but also allow efficient exploitation of the current grid capacity. Simulation results of different cases are provided to show the effectiveness of the proposed algorithm in Matlab software.
Keywords: Electric Vehicle;Flexible price; Load flow forecasting; Feedforward neural network; Nature-inspired optimization; Power dispatch; Smart distribution grid; Reactive power control.
vi
ACKNOWLEDGMENTS
First and foremost, I would like to express my sincere appreciation to Asst.Prof.Dr. Nurettin ÇETİNKAYA for his for his guidance and insight throughout the research works. Special thanks go to the other faculty members, especially Head of Department and member doctorate committee Assoc.Prof.Dr. Ahmet AFŞIN KULAKSIZ, and Prof.Dr. Mehmet ÇUNKAŞ. My special gratitude goes to the Scientific and Technological Research Council of Turkey (TUBITAK) for Ph.D. support.
I would also like to express my appreciation goes to my family for their constant support, understanding, motivation, and prayer for the successful completion of my study. Lastly but not the least, I will like to thanks my entire colleagues and friends who help me in one way or another and made my stay at the university a wonderful and memorable journey. Lastly to my wife Amina (Shukrah) Hafiz, daughter Fatima (Sajida), and son Muhammad Sani.
Gaddafi Sani SHEHU KONYA-2018
vii
TABLE OF CONTENTS
ÖZET ...iv
ABSTRACT ... v
ACKNOWLEDGEMENTS ...vi
TABLE OF CONTENTS ... vii
LIST OF FIGURES...ix
LIST OF TABLES... ...xi
LIST OF SYMBOLS/ABBREVIATIONS...xii 1. INTRODUCTION ... 1 1.1. Research Objectives...1 1.2. Motivation...2 1.3. Problem Statement...2 2. LITERATURE REVIEW ... 4
3. MATERIAL AND METHODS ... 12
3.1. Introduction ... 12
3.2. Test Case ... 12
3.3. Smart Distribution Grid ... 12
3.4. Distributed Renewable Energy Sources (DRES) ... 14
3.5. Electric Vehicles (EV) ... 15
3.6. Optimization Algorithm Methods ... 17
4. OPTIMAL POWER DISPATCH ... 21
4.1. Introduction ... 21
4.2. Problem Formulation for Optimal Power Dispatch ... 23
4.2.1. Fuel cost minimization function ... 23
4.2.2. Incremental fuel cost minimization function ... 24
4.2.3. Active power loss function ... 24
4.2.3. Equality and inequality constraints ... 24
4.3. Test System and Results ... 25
5. LOAD FLOW FORECASTING IN SMART DISTRIBUTION GRID ... 30
5.1. Introduction ... 30
5.2. Load Flow Forecasting in Smart Distribution Grid ... 33
5.3. Support Vector Regressions (SVR) ... 34
5.4. Flower Pollination-Feedforward Neural Networks for Load Flow Forecasting .. 36
5.4.1. FPA for training FNN ... 38
viii
6. ELECTRIC VEHICLE DISPATCH IN DISTRIBUTION GRID... 48
6.1. Introduction ... 48
6.2. Method and network model ... 50
6.2.1. Optimal siting and sizing of DRES placement ... 51
6.2.2. Test network ... 53
6.2.3. Electric vehicle load modelling ... 55
6.3. Results and Discussion ... 57
7. FLEXIBLE ELECTRIC VEHICLE CHARGING MANAGEMENT ... 63
7.1. Introduction ... 63
7.2. Methodology and Problem Formulation ... 63
7.2.1. Test system model ... 66
7.2.2. Electric vehicle model ... 68
7.2.3. Grid sensitivities ... 69
7.3. Electric Vehicle Charing Scenarios ... 70
7.3.1. Uncontrolled (Dumb) charging scenario ... 70
7.3.2. Reactive power control charging scenario ... 70
7.3.3. Flexible Price control charging scenario ... 72
7.4. Results and Discussion ... 75
8. CONCLUSION AND RECOMMENDATION ... 80
8.1. Conclusion... 80
8.2. Recomendation ... 80
REFERENCES ... 83
APPENDIX ... 95
ix
LIST OF FIGURES
Figure 3.1. Smart distribution grid attributes...13
Figure 3.2. EV charging configuration at AC level 1 and level 2 setup...16
Figure 3.3. Flowchart of Evaluating the EV Charging interaction on grid...17
Figure 3.4. Proposed EV in distribution grid concept...17
Figure 4.1 Number of thermal unit committed to serving load Pload...21
Figure 4.2 A number of Generators, wind, and EV battery sources...22
Figure 4.3 Proposed pseudocode algorithms...26
Figure 4.4 Convergence curve of 26 bus fuel cost...28
Figure 4.5 Convergence curve of 30 bus fuel cost...28
Figure 4.6 Voltage profile for IEEE 26 bus system...29
Figure 4.7 Voltage profile for IEEE 26 bus system...29
Figure 5.1 Load flow topology of Konya industrial zone...33
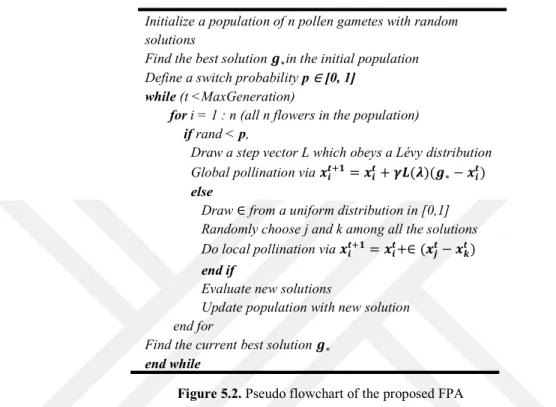
Figure 5.2 Pseudo flowchart of the proposed FPA...38
Figure 5.3 Structure of two-layer feedforward neural network...39
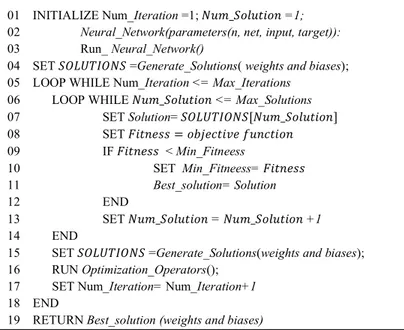
Figure 5.4 Proposed pseudo code for training algorithm...41
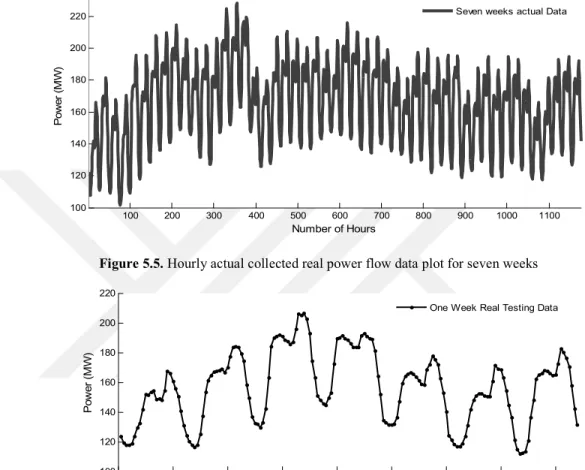
Figure 5.5. Hourly actual collected real power flow data plot for seven weeks...43
Figure 5.6. One week actual testing data plot of the Konya industrial zone...43
Figure 5.7. Comparison of actual load flow and FNN algorithm...43
Figure 5.8. Comparison of actual load flow and SVR forecasted...44
Figure 5.9 Comparison of actual load flow and FPAFNN forecasted...44
Figure 5.10 Comparison of actual load flow, FNN, SVR, and FPAFNN forecasted...45
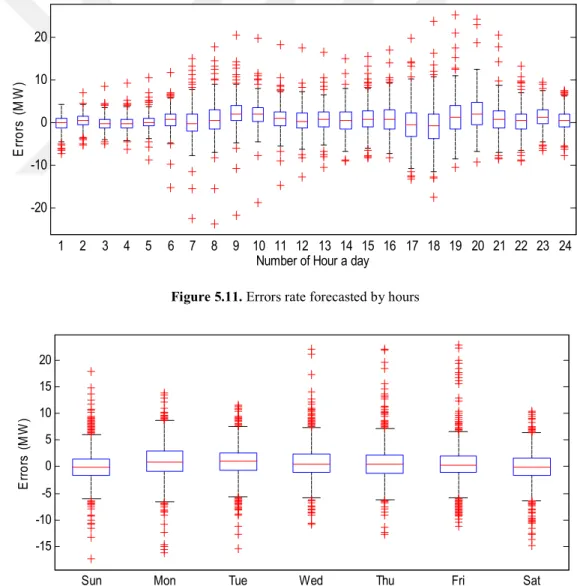
Figure 5.11 Error rate forecasted by hours...46
Figure 5.12 Error rate forecasted by days of the week...46
Figure 6.1 Flowchart for optimal DRES placement...54
Figure 6.2 A 33-bus system with connected EV and DRES position...55
Figure 6.3 A typical load demand profile for 24 hr period...55
Figure 6.4 Voltage profile of EVs charging at feeder 33 a case with no DRES...57
Figure. 6.5 Voltage profile of EVs charging at feeder 19 a case with no DRES...58
Figure 6.6 EVs charge rate at feeder position 33 and 19 with no DRES...58
Figure 6.7 Voltage profile of 33-bus grid connected with single DRES...59
Figure 6.8. Voltage profile of EVs charging at feeder 33 a case with single DRES...59
x
Figure 6.10. EVs charge rate at feeder position 33 and 19 with single DRES...60
Figure 6.11. Voltage level of the 33-bus grid with Three DRES integration...61
Figure 6.12. Voltage profile of EVs charging at feeder 33 a case with three DRES...61
Figure 6.13. Voltage profile of EVs charging at feeder 19 a case with three DRES...62
Figure 6.14. EVs charge rate at feeder position 33 and 19 with three DRES...62
Figure 7.1 A 33-bus system with connected EV sampling position...67
Figure 7.2 A typical load demand and electricity price profile for 24 hr period...67
Figure 7.3 Power losses curve variation of charger level capacity……….68
Figure 7.4 Voltage sensitivities responding to EV charging at selected node...70
Figure 7.5 Reactive power control for EV load shedding...72
Figure 7.6 Battery state-of-charge operating limit for grid services provision...73
Figure 7.7 Optimal charging schedule for price control...74
Figure 7.8 Electric vehicles distribution arriving for grid services after the final trip....75
Figure 7.9 Base demand at node 12 for 24-hr period. ...75
Figure 7.10 Uncontrolled charging for EV power demand...76
Figure 7.11 Reactive power control compares against dumb Charging. ...77
Figure 7.12 Node voltage improvement for reactive power control...77
Figure 7.13. Flexible price control of EV charging compare against base demand...78
xi
LIST OF TABLES
Table 3.1. Traditional Electric Grid versus the Smart Grid……….13
Table 3.2. Benefits of distributed renewable energy sources………..14
Table 4.1. IEEE-26 bus system optimized comparison results………...27
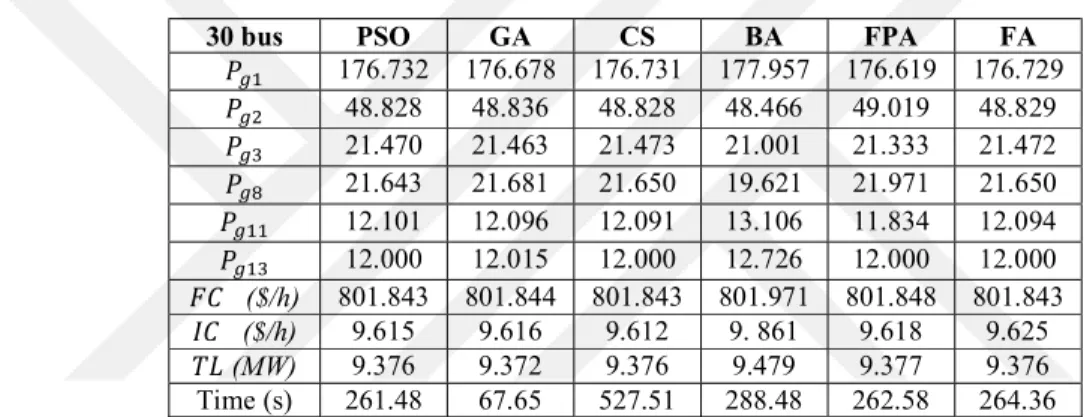
Table 4.2. IEEE-30 bus system optimized comparison results………...…27
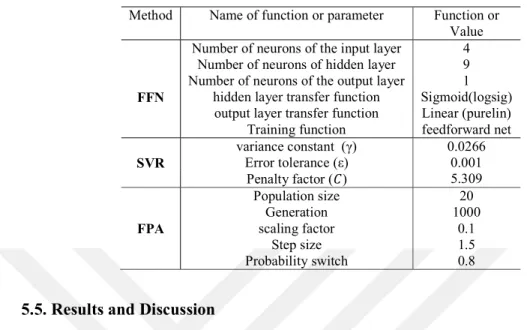
Table 5.1. Parameter setting of each methods...…....42
Table 5.2. Evaluation of Forecasted methods……….45
xii
LIST OF SYMBOLS/ABBREVIATIONS
SYMBOL EXPLANATION
𝜃 Voltage angle difference between buses ith and jth
ℜ Component of the real part ℑ Component of the imaginary part
𝑦 Shunt admittance between buses ith and jth
𝑛𝑔 Generator number in the system 𝑛𝑙 Transmission line number
𝐿𝐹 MVA capacity of line between buses ith and jth
𝑔 Conductance of branch k
𝑌 Admittance between buses ith and jth
𝑉 Voltage at bus jth
𝑉 Voltage at bus ith
𝑉 Lower voltage at bus i 𝑉 Upper voltage at bus i 𝑃 Real power at bus ith
𝑃 Real output power bus ith
𝑃 Lower limit of real power at bus ith
𝑃 Upper limit of power at bus ith
𝑃 Real power at bus i 𝑄 Reactive power at bus i 𝑄 Reactive output power bus ith
𝑄 Minimum of reactive power limit at bus ith
𝑄 Maximum of reactive power limit at bus ith
𝑄 Reactive power supply by shunt at bus ith
𝑄 Minimum Reactive power by shunt at bus ith
𝑄 Maximum Reactive power by shunt at bus ith
𝑇 Transformers tap setting at line ith
𝑇 Lower transformer tap setting 𝑇 Upper transformer tap setting OPF Optimal power flow
xiii EV Electric Vehicle
EVs Electric Vehicles
DGS Disperse Generation Sources DSO Distribution System Operator
DRES Distributed Renewable Energy Resources OPD Optimal Oower Dispatch
OPF Optimal Power Dispatch RES Renewable Energy Source
IEEE Institute of Electrical and Electronics Engineers SCADA Supervisory Control and Data Acquisition ANN Artificial Neural Network
PSO Particle Swarm Optimization GA Genetic Slgorithms
CS Cuckoo Search
BA Bat Algorithm
FPA Flower Pollination algorithm
FA Firefly Algorithm
ACS Adaptive Clonal Selection ABC Anty Bee Colony
DE Differential Evaluation
FL Fuzzy Logic
CKHA Chaotic Krill Herd Algorithm
𝑝 Probability of switch ∈ Belonging to a set 𝜌 Random number 𝑠 Step size ⊗ Vector product n Number of sample 𝑡 Times steps γ Scaling factor I Intensity 𝑟𝑎𝑛𝑑 Randomization generator
𝛼 Randomization control parameter
xiv FNN Feedforward Neural Network
FPAFNN Flower Pollination Algorithm-Feedforward Neural Networks SVR Support Vector Regression
SMV Support Vector Machines BPPN back propagation neural network STLF Short-Term Load Forecasting K-NN K-nearest neighbour
kV Kilo Volt
MVA Mega Volt Amper
kW Kilo Watt
𝐶 Penalty parameter on errors ε Error tolerance
σ Variance
PHEV Plug-in Hybrid Electric Vehicles BEV Battery Electric Vehicles
% Percentage
pu Per unit
h Hour
1. INTRODUCTION
The optimal power dispatch has long been studied in its development history, it was first discussed by Carpenter in (Abadie and Carpentier, 1969), and it takes a long time to become successful algorithm that could be applied in everyday use (Wood and Wallenberg, 1996). Optimal power dispatch is dealing with minimum cost delivery of the generated power to the load by coordinating the production cost at all power plant operating on the system. But the minimum loss problem, the economic dispatch problems are solved by Optimal Power Flow (OPF) program (Saadat, 1999). Previous interest was on fuel cost and generation loss only, currently interest much focus on the previous two-plus security of the system as well as renewable energy (RE) integration and electric vehicle (EV) especially in the concept of the smart grid. The economic dispatch calculation in term of generation cost and the entire set of the equation needed for the power flow itself as constraints need to be formulated, this formulation considering fuel cost including losses is called OPF. The OPF with minimum generation cost requires that the optimization calculation also balance the entire power flow at the same time. For the case of simple Optimal Power Dispatch (OPD) a simple equation can mathematically solve the problem with minimum operating cost without considering losses.
For the case involving smart grid scenarios, deterministic and stochastic approach are the major considerations. The power flow in such stuation is a non-linear multi-objective function that requires iterative methods of solution and requires optimization techniques to come off with minimizing objectives functions (Saadat, 1999). The revolving point in our research works focuses on scenarios configuration of different dimension, with interest on the security of the system as well as RE and EV integration especially in the concept of the smart grid. Therefore it is highly important to access the ecomics of power system for optimal system operations and security. 1.1. Research Objectives
The main objectives of the research thesis are to provide a comprehensive studies, advanced research knowledge, and modeling capabilities of OPD using nature-inspired and hybrid optimization techniques in the smart grid concept.
The objectives to be accomplished are summarized as follows:
1. Investigate and enhance the definition of OPD in smart grid context.
2. OPF using nature-inspired optimization algorithms techniques and compare with existing techniques.
3. Modify and enhance the techniques to accommodate renewable energy source (RES) and electric vehicle (EV) for performance improvement.
4. Formulate of optimal power dispatch method to accommodate intermittent generation sources.
5. Investigate power flow forecasting for power component system security. 6. Provide an optimal power dispatch problems solution approach reproducible by
other researchers.
7. Draw a conclusion that is useful to literature and power system utility operators. 1.2. Motivation
An economy of power system is one of the most promising characteristics of smart power grid technology today. With the development of smart grid technology, more and more renewable devices are connected to the power grid network. For example, solar energy, wind energy, EV, and energy storage (battery) are all interfacing with the grid. Therefore, power dispatch becomes very important for all active players units in the grid. For optimal power dispatch in a smart grid, a nature-inspired control algorithm will be applied to enable each generation unit to control its own power output in an optimized manner. Compared with the classical algorithm, the nature-inspired algorithm features optimized operation of the interconnected element for sustainable electricity delivery, in a protected setting.
1.3. Problem Statement
As stated before, it’s becoming more and more important to solve OPD for a smart grid in a smart distributed manner, and optimized setting. In this work, a nature-inspired, and hybrid-based algorithms for OPD in a smart grid is proposed. The swarm intelligent algorithm exhibits great advantages over classical methods, one of it is self-control in an optimized setting. First of all, a cost function of OPD and generator constraints will be well defined. Practically, the generators have to operate within certain operation limits, the power balance between generation and demand is also required. For practice, the transmission power loss is also taken into consideration for
constraints. Based on swarm intelligence, the nature-inspired algorithm is employed to solve OPD in the smart grid. Therefore, the performance of proposed algorithm will be examined in different structure and topologies. In order to validate the effectiveness of each algorithm, a comparison among algorithm is tested and in some scenarios with conventional algorithms are also compared. The performance is also validated by testing in a standard IEEE test power system and real grid using the Matlab software.
The thesis is divided in to eight chapters, literature review is given in chapter 2, material and methods is given in chapter 3, optimal power dispatch are treated in chapter 4, while chapter 5 deals with load flow forecasting in smart gird, also electric vehicle dispatch in distribution grid is presented in chapter 6, chapter 7 deals with flexible electric vehicle charging management in distribution grid, finally conclusion and recommendation are summarized in chapter 8.
2. LITERATURE REVIEW
Smart means intelligent, neat, stylish, or operating in automation; a grid is a network of electrical conductors that deliver electricity to certain points. The smart grid does not have one definition that is universally accepted. It can be described both in simple and complex terms. It used to be a dream or just an idea but, now it is one of the most talked topics in the modern electrical system. Simply put, the Smart Grid is an intelligent grid. The traditional grid can only transmit or distribute electric power, while the modern grid is able to store, communicate and make decisions. The Smart Grid transforms the current grid to one that functions more cooperatively, responsively and organically (Tunaboylu et al, 2016). Traditional grid operates one-way communication and central power generation. Nowadays electricity sector is confronted by critical challenges of high aggregated power losses, voltage disturbance, and harmonics distortion. As a result of the rapid rate of increasing energy demand, with different load and sources (EV and RES) bi-directional power flow in distribution grid becomes a necessity. In today’s grid, the vision is to have grid capable of accommodating two-way real-time communication coupled with distributed power generation and automatic control recovery. It is essential to develop smart grid technology for electric power distribution system to meet increasing power demand and to provide reliable and sustainable electricity supply for consumers. According to the Strategic Deployment Document for Europe's Electricity Networks of the Future, a Smart Grid is an electricity network that can intelligently integrate the actions of all users connected to it generators, consumers and those that do both in order to efficiently deliver sustainable, economic and secure electricity supplies (European grid, 2010). The Korean Smart Grid Roadmap 2030 states that a Smart Grid refers to a next-generation network that integrates information technology into the existing power grid to optimize energy efficiency through a two-way exchange of electricity information between suppliers and consumers in real time. Utility companies and consumers benefit due to the employment of smart distribution grid. Smart grid requires having suitable monitoring and control systems to effectively control the power flow in the network (Korean, 2010; Zaballos et al, 2011). According to the National Institute of Standards and Technology (NIST), the Smart Grid is a grid system that integrates many varieties of digital computing and communication technologies and services into the power system infrastructure. It goes beyond smart meters for homes and businesses, as the bidirectional flows of energy and
the two-way communication and control capabilities can bring in new functionalities. Different smart grid testbed systems have been presented in the literature. At Florida International University, hardware-based smart grid testbed is developed to study grid connectivity problems of renewable energy sources (Salehi, 2012).
The smart grid is sophisticated, digitally enhanced power systems where the use of modern communications and control technologies allows much greater robustness, efficiency and flexibility than today’s power systems. A smart grid impacts all the components of a power system especially at the distribution level (Rugthaicharoencheep and Boonthienthong, 2012). In the smart grid, reliable and real-time information become the key factor for reliable delivery of power from the generating units to the end-users. The impact of equipment failures, capacity constraints, and natural accidents, which cause power disturbances and outages, can be largely avoided by online power system condition monitoring, diagnostics, and protection (Arup et al, 2011). With the introduction of distributed energy resources such as renewable generations, Plug-in Hybrid Electric Vehicles and demand response, the power grid will need to face the extra challenges in the following areas: energy balancing, power quality, reliability assessment, renewable generation forecasting, demand forecasting, ancillary services procurement, distribution reconfiguration, and distributed energy resource modeling. The Smart Grid may be understood better when viewed alongside the traditional grid. Yu et al in 2012 made a good comparison between the two structures. A power grid consists of power devices for physically carrying electricity from generation point to the load centers through transmission and distribution systems and communication devices, for transferring data to operate the power equipment, monitor the operation status, and gather readings from smart meters (Yu and Ansari, 2016). Another experimental study of integrated microgrid laboratory system testbed with a flexible and reliable multi microgrid structure is presented in (Zhao et al, 2012). Experiments on control and protection are conducted and these tests exhibited the promising results for future smart distribution grid. One of the latest studies on experimental validation of smart distribution grid is presented in (Gouveia, 2016).
The power quality refers to the voltage and current waveform purity, and disturbance is the deviation of the voltage signal from the fundamental values. The most associated power quality problems in smart distribution grids are voltage disturbance and harmonic components due to the application of power electronic devices, the interaction of nonlinear loads, and integration of renewable energy resources. The voltage disturbance is more frequent; this includes short-term interruption, voltage dips and peaks, and voltage fluctuation. Power quality monitoring in smart distribution grid is currently considered a cornerstone of supplying quality electricity without penalty. Because liberalization of energy market implies that the electricity is treated like other markets, which means the entity has to satisfy relevant standard in the respective country. In such case, integration of power quality monitoring devices in medium and low voltage is necessary for distribution system operators to have real system condition. This kind of works is reported in (Gordon et al. 2011; Music et al. 2012; Noce and Sartore, 2010). In order to analyze the effects of various network operations, the correlation between power quality measurement and SCADA log is needed. This kind of system forms the basis of the smart grid.
Scheduling and operational future growths of power system networks and defining the best scenario of existing systems is the essential backbone of fully deregulated power sector as commodity enterprises. Optimal Power Dispatch (OPD) problem is dealing with the lowest cost of fuel and loss delivery of power produced by organizing the production cost at all power plant working on the system (Saadat, 1999). It’s an optimization problem with aims to reduce total operational cost, and transmission losses, and voltage deviation, but the minimum loss problem, the economic dispatch problems are solved by optimal power flow (OPF) program. The OPD with minimum generation cost requires that the optimization algorithm calculation balance the entire power flow at the same time combining with economic dispatch problem (Wood and Wallenberg, 1996).
Numerous classical methods such as gradient search technique, non-linear programming, mix-integer linear programming, Newton’s approach, Jacobian matrix and interior point, are applied to find optimal result of non-linear OPD problems (Deeb and Shahidehpour, 1988; Granville, 1994; Grudinin, 1998; Lee et al., 1984; Narayan, 1999). Quadratic programming previously played important role in OPD approach (Nanda et al., 1989). Some of the previous problems are solved by a mathematical
technique that takes the advantage of network run structure of the problem (Carvalho et al., 1998). Artificial intelligence approach such as an artificial neural network (ANN), chaotic krill herd algorithm (CKHA), and Fuzzy logic (FL) play a vital role in OPD problem solution with different objective function and constraints (Gutierrez-Martinez et al., 2011; Mukherjee, 2016; Ramesh, 1997). Currently, heuristic and metaheuristic based on swam, evolutionary, and nature-inspired algorithms take the center stage of OPD solutions with robustness in the optimal solution. Particle swarm optimization (POS) and hybrid PSO (Ahmet et al., 2016; AlRashidi and El-Hawary, 2009; Esmin et al., 2005; Yoshida et al., 2000), Genetic algorithms (GA), modified GA, and Adaptive GA (Devaraj, 2007; Wu et al., 1998), Cuckoo Search (CS), and Modified CS (Chetan, 2015; Nguyen, 2016; Thang, 2016), Cuckoo Search also play vital role in multi machine power system stabilization analysis a part from OPD problem (Rangasamy, 2014). Bat Algorithm (BA) and modified BA (Biswal et al., 2013; Latif et al., 2016), Flower Pollination algorithm (FPA) and modified FPA (Kumar, 2015; Regalado, 2015), Firefly Algorithm (FA) (Herbadji et al., 2013; Hendrawati et al., 2015; Lin et al., 2015) have been employed in solving OPD and related power system problem with satisfactory results. The economics aspect of a power dispatch optimization problem with nature-inspired algorithms are treated in (Mimoun, 2013) the idea is based on hybrid FFA and Ant Colony Optimization for a practical strategy for faster convergence, the finding proved the ability of FFA of solution search.
A Multi-objective Adaptive clonal selection (ACS) an artificial intelligence based algorithm for solving OPD with load uncertainty to minimized fuel cost, loss, and L-index are presented in (Srinivasa, 2016), non-dominated sorting procedure has been applied to preserved distributed Pareto optimal set, the procedure is verified on IEEE-30 bus system, the results are compared with related literature and found multi-objective ACS is fit to the problem solutions. In (Ahmet et al., 2016), fuel cost is reflected as a cost function four heuristic algorithms i.e. PSO, GA, ABC, and DE are employed. Valve point effect and a penalty function are added to control active power generated violations for effective fuel cost results. Finally, the authors concluded that GA possesses fast iteration speed, with minimum fuel cost for DE. CS based solution to OPD is presented in (Nguyen, 2016), the objective is to abate total fuel cost, CS is improved to combines teaching-learning based optimization to enhance the presentation of Cuckoo eggs, the technique was tested on IEEE-30 and IEEE-57 bus system. BA is
proposed In (Biswal, 2013) to solve OPD problems combined cost function dispatch in 3 unit and 6 unit system, the results are matched with PSO, BA proved to have superior computational time. Regalado et al. (2015) presented FPA and compared with CS to solve OPD problem on IEEE-30 bus system, authors conclude FPA achieved best fuel cost and time to reach a global best result. Herbadji et al. (2013) applied FFA on IEEE-30 bus system, the author considers fuel cost and emission as the cost function to be minimized, the author compared the results of FA with PSO and GA are found to be in synchronization.
The year 1960s and 1970s are two key periods covering the growth of evolutionary algorithms, John Holland and his associates at the University of Michigan conceptualized GA. He later considered the adaptive system which is first to applied crossover and recombination operations for demonstrating systems that lead to the development of GA (Melanie, 1995). Within year intervals, Kenneth De Jong write thesis showing the perspective and supremacy of GA for objective functions with noisy, multimodal, or even discontinuous (Holland, 1975; De Jong, 1975). Majority of classical algorithms are deterministic, in case of stochastic algorithms most types are heuristic and metaheuristic, with small differences heuristics mean finding solution by guessing of many trials, on the other hand, metaheuristic algorithms means finding advanced level solutions beyond good solutions, and these algorithms usually execute well than simple heuristics (Yang, 2014). In practice metaheuristic algorithms custom certain trade-offs of randomization and local search, Randomization offers worthy chance of algorithms deviation at local optimum trap to search on a global level (Yang, 2010a). Intensification and diversification, are two key constituents of all metaheuristic optimizations programs. Diversification is to produce different output so that search space is explored on a global optimum. Intensification allowed exploiting search focus in the region of local space that a good solution is within reach (Yang and Deb, 2010). This two major component guarantee emergence of the best solutions, whereas diversification through randomization evades the best fitness confined to the local region, and this increases the diversity of solutions. Metaheuristic algorithms can be categorized as based on population and trajectory-based. In the case, of GA which is population-based since the certain set of strings are utilized; while PSO, the firefly algorithm (FFA), and cuckoo search (CS), which all use multiple agents or particles (Yang and Deb, 2009; Yang and Gandomi 2012). Some selected list of Nature-inspired
metaheuristic optimization algorithms; PSO, GA, CS, BA, FPA, FFA, are applied to the power system and are briefly reviewed.
PSO is first presented by Kennedy and Eberhart in 1995 (Kennedy and Eberhart, 1995), motivated by social behavior of birds flocking and fish schooling. The algorithm was established numerous analysis and simulation of many simplified works, and establish to be vigorously efficient for solving nonlinear continuous problems, and PSO is attractive because very few parameters are entailed for its applicability (Shi and Eberhart, 1999). The swarm intelligence based algorithms exploit inhabitants of particles that sail through hyperspace problem, iteration velocity of each particle are randomly adjusted best on neighborhood historical best solutions (Eberhart and Kennedy, 1995). The details overview and comprehensive survey on the power system application of PSO are presented in (Yamille et al., 2008), the paper present technical requirement such as type, particles formulation, and efficient fitness functions. The famous and popular evolutionary algorithms are based on the mechanism of Darwin
principle of evolution, natural assortment and regular genetics, (Melanie, 1995). An inhabitant's based algorithms of which search process is performed by transforming
a set of individual point to another in the search space. The three genetic operator of GA is crossover, mutation, and selection (Yang, 2010b). GA is applied in an extensive range of engineering applications with ability deal with complex problems in any direction, domain. For GA to avoid being a trap in local optima, good formulation of the fitness function and care full selection of importance parameter are necessary.
The emerging CS algorithm is an optimization search algorithms formulated and developed by Yang and Deb (2009), their approach mimic brooding parasitic character of cuckoo species in a mixture with Levy flight of some bird and fruit flies behavior (Yang and Deb, 2009). Fittest selection and adaptation to the environment allowed the CS algorithm converge to the best optimal values. Yang and Deb described CS in three simple ways: each cuckoo lays a single egg at once randomly in a chosen nest; in a random selected best nest generation’s process will continue; with the secure amount of available host nest, intruding egg can discover by the host with probability 𝑝 ∈ [0, 1]. With following assumption nest owner usually identify the egg, there after destroy the egg or abandon the nest (Yang and Deb, 2010). CS algorithm always maintained stable
power system with the fixed generator at random bus, with probability the best power be generated with minimum fuel cost and transmission losses.
A nature-inspired metaheuristic BA was developed by Yang in 2010 basically on echolocation manners of bats, the echolocation fitness allowed the bat to easily prey, distinguished diverse insect and, obstructions in total darkness (Yang, 2010a). For simplicity as proposed by Yang (2010b) three idealized rule define BA are followed (Yang and Gandomi, 2012; Yang, 2010b; Yang, 2011):
Echolocation: detect and differentiate food and obstructions.
Bats are fly with random velocity at a secure frequency with different wavelength and loudness to hunt for food.
Bat loudness is varied in many ways from maximum to minimum.
With echolocation and related characters allowed BA algorithm to perfectly works in multi-objective optimization, especially in power system where darkness represent transmission distance with bat using echolocation to prey generator power delivery.
Another recent emerging nature-inspired based optimization algorithm is FPA developed by Yang in 2012, enthused by pollination process of flower, which is the transfer of pollen that is linked to natural bio habitant (Yang, 2012). Two important characteristics of flower pollination are abiotic and biotic, with 90 % biotic pollination and the rest abiotic require no pollinators. For FPA to solve multi-objective optimization problem such as power system dispatch a random weighted sum is added to combine a number of objectives so to become composite sole objective (Yang et al., 2013). The FPA algorithm can express in four rules for updating its optimization parameters.
1. Biotic and cross-pollination is considered as global pollination process with pollencarrying pollinators performing Levy flights.
2. Abiotic and self-pollination are considered as local pollination.
3. Flower constancy can be considered as the reproduction probability is proportional to the similarity of two flowers involved.
4. Local pollination and global pollination is controlled by a switch probability. Due to the physical proximity and other factors such as wind, local pollination can have a significant fraction p in the overall pollination activities.
Rule 1 global pollination and Rule 3 flower constancy, Rule 2 and Rule 3 both are local fertilization.Where pollen from diverse flowers with similar plant species. If pollens are from exact species and population this become local search with ∈= [0, 1] uniformly drawn. Rule 4 is switching probability control between local and global pollination of value 𝑝 ∈ [0, 1].
Established by Yang in late 2007 then appeared in 2008, FA is efficient and intelligent swam centered on flashing sequence (Yang, 2010a). The bioluminescence process emit flashing light, for now the exact functions of such signaling is under investigation, common knowledge of flashes application is in breeding partners attraction or food prey, it also works as guiding tool against fireflies predators, this implies optimization of FA depend on unique flashes of light (Lewis and Cratsley, 2008; Yang, 2009). In simple term FA flows three ideal rules:
Fireflies behave in a unisex manner to attract one another.
The direct relationship between attractiveness and brightness exist. The firefly brightness depends upon objective functions landscape.
The intensity of fireflies possess a direct relationship to brightness and to the attractiveness. For best optimization to the simple scenario attractiveness vary with distance between light source intensity, for a channel having static light absorption coefficient the light intensity diverge with the distance. In summary the intensity of firefly is directly related to their brightness and to attractiveness, relative to power system the attractiveness is how the network operate efficiently at minimum fuel cost with low level losses
3. MATERIAL AND METHODS 3.1. Introduction
To achieve the desired objectives stated above simulation analysis on standard IEEE test system and the real system network is performed. For a work scenario with sigle and multiple intermittent generation sources with electric vehicle are considered. Nature-inspired optimization algorithms; such as swam algorithm, Search algorithm, and genetic algorithms, are considered. The proposed framework focuses on analysis and assessment of active and reactive power dispatch in traditional and smart grid scenarios. Matlab software programs are used to develop a simulation model for the entire or part of the system. A case with real data is also considered for forecasting application, and is highly part of our objectives and motivation.
3.2. Test Case
For a reliable load flow program a test case data is essential, four test cases are considered and treated in this work, three IEEE test case and a test case of Konya Industrial zone Turkey. The four test case includes, an IEEE 26-bus transmission system with six number of generation unit, having total real power demand of 1263 MW, reactive power demand of 633 MVAr details are in Appendix A1. The second test case is IEEE 30-bus transmission system also has six number of generating unit with real and reactive power demand of 283.400 MW and 126.200 MVAr details are presented in Appendix A2. A low voltage IEEE 33-bus radial system, with 32 branch line, 12.66 kV radial distribution system with total active and reactive power demand 3.715 MW and 2.305 Mvar respectively. The system has an inherent power loss of 210.89 kW. A real smart distribution grid of Konya Industrial zone is considered as a case study. The grid is medium voltage with three separate transformers of 100 MVA at 33.5 kV, 50 MVA at 31.5 kV, and 100MVA at 31.5 kV, solar power plants of size 4350 kW are integrated.
3.3. Smart Distribution Grid
Smart Grid may be understood better when viewed alongside the traditional grid. Yu et al. made a good comparison between the two structures. A general summary of the characteristics of the two grids are presented in Table 3.1 (Yu and Ansari, 2016).
Table 3.1. Traditional Electric Grid versus the Smart Grid
S/n Traditional Grid Smart Grid
1 Centralized power generation Distributed power generation
2 One-way communication Two-way real-time communication
3 Manual control and recovery Automatic control and recovery 4 Slow response to emergencies Fast response to emergencies 5 Less security and privacy concerns Prone to security and privacy issues 6 Human attention to system disruptions Adaptive protection
7 Simultaneous production and consumption Use of storage systems 8 Small number of sensors and monitors Many sensors and monitors
Smart distribution grid comprises many component from advance metering infrastructure to communication management system Figure 3.1 give details attribute, with hundreds of power devices that collect power and signal from thousands of sensors over a geographical area. The information carried between a power management system and its managed power device can be command, while the information between the management system and the sensors can sense the data. Both command from a management console and data from a meter reading are carried by the communication network using with two different application i.e. operations and management (Yu and Ansari, 2016).
3.4. Distributed Renewable Energy Sources (DRES)
Distributed renewable energy sources (DRES) refers to relatively small-scale power generation that produce several kilowatts to tens of megawatts of power and are generally connected to the grid at the distribution or substation levels. Those DRES that are typically not connected to the grid are termed as Disperse Generation Sources (DGS) (Ashish, et al 2014; Kristoffersen, et al 2011). Even though they can participate in demand response programs, disperse generation sources’ effect on grid operation is insignificant, hence not covered in this work. DRES can be owned and/or operated by both utilities or their customers, and either case, provide variety of technical, economic and environmental benefits as summarized in Table 3.2 (Sortomme and El-Sharkawi, 2012).
Table 3.2. Benefits of distributed renewable energy sources
Technical
Voltage profile improvement Reduced power losses
Relieved transmission and distribution congestion Increased security for critical loads.
Increased generation diversity
Reduced impact from physical and cyberattacks
Economic
Deferred investments for generation, transmission, distribution upgrades.
Low operation and maintenance costs to peak shaving Increased overall efficiency due to reduced fuel cost
Environmental
Reduced land use for generation Reduction of pollutant`s emissions
However, the benefits aforementioned are highly dependent on the characteristics of each installation and the properties of the local power system. In spite of these benefits, neither utilities nor system operators monitor or control the operation of small DRES units, especially those in residential applications. Due to limited predictability and high variability of renewable DGS, they are not dispatchable or easily controllable (Kempton and Tomic, 2005). Hence increasing their share in the generation system present great challenges to grid operation. Tackling these impediments resulting from unpredictable nature of the DRES is cornerstone of the thesis. Conventional power system is designed in such a way that power is produced from large power plant usually located close to primary energy sources and far away from load centers. The produced power is conveyed to the load centers via long transmission lines which is later
distributed to the consumers using distribution lines. It is not designed to cope with generation at consumption side, only loads were connected to them (Sortomme and El-Sharkawi, 2012). This constitutes uniquely unidirectional power flow Not only generation and lines of most of the existing distribution systems assume a unidirectional power flow but protective relays, converters and the likes are designed and operated on that basis.
3.5. Electric Vehicles (EV)
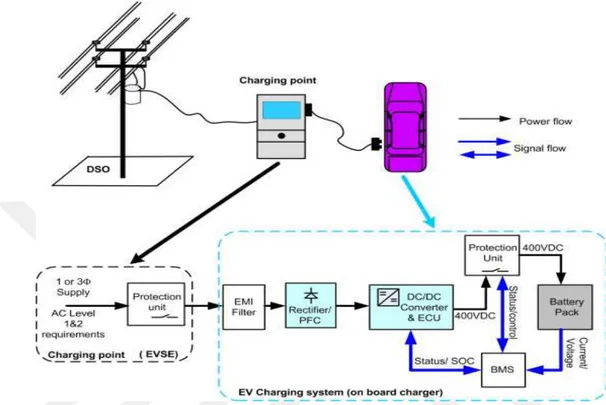
By definition Plug-in hybrid electric vehicles (PHEV) and battery electric vehicles (BEV) give owners the ability to charge the vehicle battery from dedicated charging station or from a stationary electrical source for example, an outlet in the garage in this regards PHEV and BEV are collectively refer to as EV in this work. EV technology has attracted the attentions of government and public due to the growing concerns on the environment and rising cost of fossil fuel and uncertainty. The integration of transportation sector and power grid will lead to many challenging issues to the power system. For instance, a large penetration of EVs will increase the power grid load during the EV charging process. There are three emerging concepts of grid-connected EV technologies, which are the Vehicle to Home (V2H), Vehicle to Vehicle (V2V), Vehicle to Grid (V2G), and Grid to Vehicle (G2V). Generally, the framework for V2H, V2V and V2G involve elements such as power sources, power loads, power grid aggregator, power transmission system, communication system, electric vehicles, and vehicle to grid chargers. Owing to the potentially large impacts of a high share of EVs in power systems, a large body of literature on this related topic has been developed in recent years. Due to integration problems of EV, The focus of works mostly lies on steady state analysis, different control techiniques, optimization problems and the computational tools employed to solve them. Smart dribution grid technologies typically require algorithms and mechanisms that can solve problems involving a large number of highly heterogeneous actors, each with their own aims and objectives, having to operate within significant levels of uncertainty and dynamism. Three main concept are given emphasis in this works are charging and scheduling of EVs, Application in renewable energy integration, and EV participation in electricity markets. The solutions approach is augmented into power flow model and flow by optimization algorithm. EV charging configurations for the AC Level 1 & 2 requirements (120V, 1.9 kW and
208-240V, 19.2 kW ) and DC Level 1 & 2 (200-450V, 36 kW and 200-450V, 90 kW ) respectively are commonly available as shown in Figure 3.2.
Figure 3.2. EV charging configuration at AC level 1 and level 2 setup
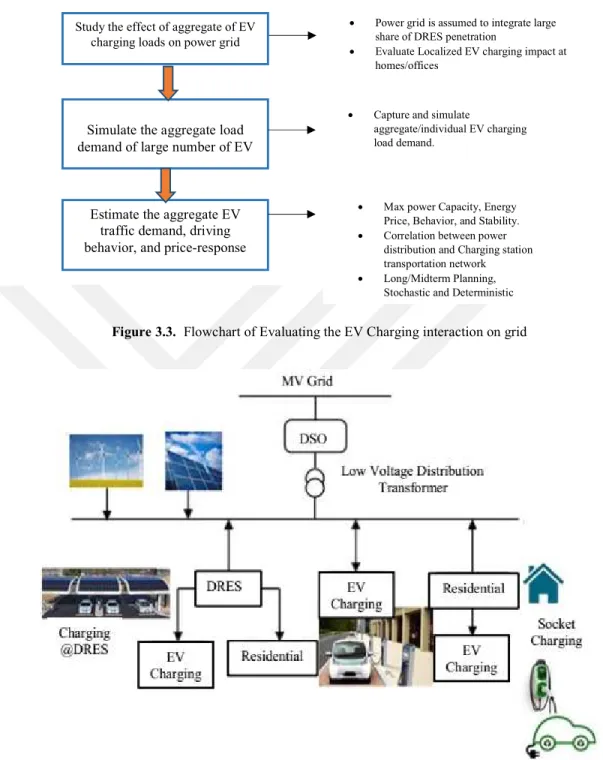
The proposed framework applies both deterministic and stochastic analytical approaches to evaluate the impact of EVs at the distribution feeder level as a function of time and place. It is important to determine the maximum transformer capacity that will support EV charging load at peak time, which is one of the critical factors in a deterministic impact analysis. It is also critical to capture the temporal and spatial diversity of EV charging by performing a sequential simulation. The real-world operational conditions of EV charging can be categorized into the following factors shows the flowchart in Figure 3.3 of evaluating EV charging behavior. At distribution level, we are interested in the aggregate impact of EV charging on power grids a real case distrubtion EV charging infrastructure depicted in Figure 3.4. For the steady state analysis approach and simplicity, the EV batteries are modeled based on lithium-ion battery technology with charging capability of 4 kW which is available at the low voltage level for battery capacity of 20 kWh.
Figure 3.3. Flowchart of Evaluating the EV Charging interaction on grid
Figure 3.4. Proposed EV in distribution grid concept
3.6. Optimization Algorithm Methods
Several optimization algorithms from nature-inspire, hybrid algorithms and linear programming are applied as a tool for obtaining optimal or near optimal solution. As discussed in chapter two literature review in here CS, BA, FPA, FA method are presented as a descriptions of mathematical methods.
Power grid is assumed to integrate large share of DRES penetration
Evaluate Localized EV charging impact at homes/offices
Capture and simulate
aggregate/individual EV charging load demand.
Manage the congestion
Max power Capacity, Energy Price, Behavior, and Stability. Correlation between power
distribution and Charging station transportation network Long/Midterm Planning,
Stochastic and Deterministic Study the effect of aggregate of EV
charging loads on power grid
Simulate the aggregate load demand of large number of EV
Estimate the aggregate EV traffic demand, driving behavior, and price-response
Cuckoo Search (CS)
CS algorithm always maintained stable distance between local and global search by 𝑝 . Local search can be express mathematically in Equation 3.1.
𝑥 = 𝑥 + 𝛼𝑠 ⊗ 𝐻(𝑝 − 𝜌) ⊗ (𝑥 − 𝑥 ) (3.1) Where 𝑥 and 𝑥 are different solutions from random arrangement, 𝜌 is a random number, 𝑠 is a step size, and ⊗ is an entry wise vector product. While global search using levy walk are represented by Equation 3.2.
𝑥 = 𝑥 + 𝛼𝐿(𝑠, 𝜆) (3.2)
And that of levy walk is given in Equation 3.3.
𝐿(𝑠, 𝜆) = ( ) , 𝑠 ≫ 𝑠 > 0 (3.3)
Bat Algorithm (BA)
Based on rule above virtual movement of bat are express in terms of position 𝑦 and their velocity 𝑠 with new the solution given by 𝑡 time step.
𝑓 = 𝑓 + (𝑓 − 𝑓 )𝛽 (3.4)
𝑠 = 𝑠 + (𝑦 − 𝒚∗)𝑓 (3.5)
𝑦 = 𝑦 + 𝑠 (3.6)
Such that 𝛽 ∈ [0, 1] is selected from constant distribution with stochastic vector properties. Here 𝒚∗ is global optimal best solution, n bats.
Flower Pollination Algorithm (FPA)
The FPA algorithm can express in four rules for updating equations mathematically; Rule 1 global pollination and (Rule 3) flower constancy is express in Equation (3.7) 𝑥 = 𝑥 + 𝛾𝐿(𝜆)(𝑔∗− 𝑥 ) (4.7)
Where 𝑥 is i solution vector xi at iteration t, and 𝑔∗ is the present best solution, γ is a
scaling factor of step size control, L(λ) is a step-size parameter. Rule 2 and Rule 3 both are local fertilization are express in (3.8).
𝑥 = 𝑥 +∈ (𝑥 − 𝑥 ) (3.8) Where 𝑥 and 𝑥 are pollen from diverse flowers with similar plant species. If 𝑥 and 𝑥 are from exact species and population this become local search with ∈= [0, 1] uniformly drawn. Rule 4 is switching probability control between local and global pollination of value 𝑝 ∈ [0, 1].
Firefly Algorithm (FA)
The intensity I of fireflies possess a direct relationship to brightness and to the attractiveness. For best optimization to the simple scenario, firefly brightness I at a specific and precise position x is represented as 𝐼(𝑥) ∝ (𝑥), the attractiveness 𝛽 vary with distance 𝑟 between firefly 𝑖 and firefly 𝑗. according to inverse square law 𝐼(𝑟) varies so that becomes.
𝐼(𝑟) = (3.9) Is is the light source intensity, for a channel having static light absorption coefficient γ,
the light intensity I diverge with the distance r.
𝐼(𝑟) = 𝐼 𝑒 , (3.10) So 𝐼 is the unique light concentration at zero r to avoid singularity at expression , the combine effect can be approximated in Equation 3.11.
𝐼(𝑟) = 𝐼 𝑒 (3.11) Attractiveness 𝛽 is directly proportional to adjacent firefly is define in Equation 3.12
𝛽(𝑟) = 𝛽 𝑒 (3.12)
The remoteness of two fireflies i and j at xi and xj, is the rectangular space in Equation
𝑟 = 𝑥 − 𝑥 = ∑ 𝑥, − 𝑥, (3.13)
For two dimension space
𝑟 = 𝑥 − 𝑥 + 𝑦 − 𝑦 (3.14)
The drive of firefly i attracting brighter j is determined by
𝑥 = 𝑥 + 𝛽 𝑒 𝑥 − 𝑥 + 𝛼 𝑟𝑎𝑛𝑑 − (3.15)
Where 𝑟𝑎𝑛𝑑 is randomization generator, 𝛼 randomization control parameter, 𝑥 is the previous value. In summary the intensity of firefly is directly related to their brightness and to attractiveness, relative to power system the attractiveness is how the network operate efficiently at minimum fuel cost with low level losses.
4. OPTIMAL POWER DISPATCH
This chapter is structured in three sections, section one is introduction to the problems and related works, section two is the problems formulation, in section three test system and results are discussed.
4.1. Introduction
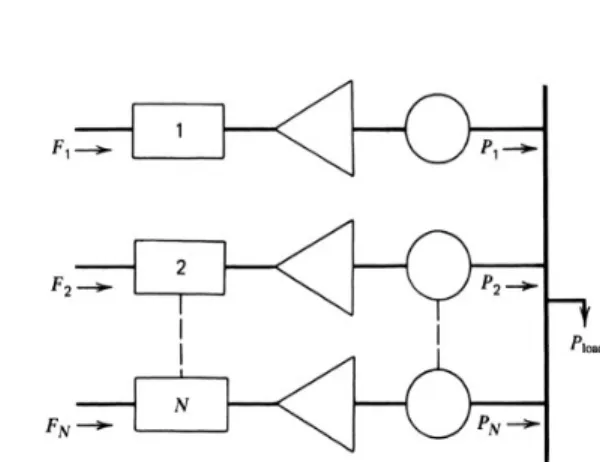
The influencing factors associated with the efficient operation of power systems are minimum fuel cost and losses in the transmission line. Optimal Power Dispatch (OPD) problem is treated to minimize instantaneous operating cost, incremental cost, and transmission line losses considering various network operating constraint. Newly developed Nature-inspired optimization algorithms approach are proposed in this analysis with robust parameter selections. For the case of simple optimal power dispatch shown in Figure 4.1, a simple equation can mathematically solve the problem with minimum operating cost without considering losses such as Equation (4.1)
𝐹 = ∑ 𝐶 𝑃 (4.1)
𝐶 Is the cost co-efficient associated with generators, under the equality constraint of meeting the load demand, i.e.
∑ 𝑃 − 𝑃 = 0 (4.2)
Where Equation (4.3) represent the sum of generators under network considerations.
𝑃 = 𝑃 + 𝑃 + 𝑃 + … … … … 𝑃 (4.3)
For the case in Figure 4.2, the case involved deterministic and stochastic approach, the power flow is a non-linear multi-objective function that requires iterative methods of solution and requires optimization techniques to come off with minimizing objectives functions (Saadat, 1999). The revolving point in our research focuses toward scenarios in Figure 4.2, with interest on the security of the system as well as RE and EV integration especially in the concept of the smart grid.
Figure 4.2. Number of Generators, wind, and EV battery sources
The results of most popular Genetic Algorithm (GA) and based on swarm behavior Particle Swarm Optimization (PSO) are compared with four Nature-inspired metaheuristic algorithms of Cuckoo Search (CS), Bat Algorithm (BA), Flower Pollination Algorithm (FPA), and Firefly Algorithm (FA). The quadratic cost function of power generation and penalty function to account for inequality constraints on dependent variables are added for solving OPD problem. A common algorithms evaluation parameters such as population size and generation limit are designated on an equal scale. Explicit parameters for each algorithm are tuned properly for optimal operations. Considering various network operating constraint, in an improved parameter setting. Penalty factor is added to account for line flow limit, bus voltages, and active generator real power violation. The objectives of this section are to compare and investigate, test and measure the effectiveness, efficiency, and robustness of mainstream nature-inspired metaheuristic based algorithms in term of OPD best solutions,
systematic convergence on power systems limits and applications, reducing operational cost and system security. The base case employed PSO and GA which are well matured and developed in power system applications especially in convergence and best solution, with newly developing CS, BA, FPA, and FA to identify robustness, and feebleness on IEEE-26 and IEEE-30 bus network.
4.2. Problem Formulatıon of OPD
OPD is formulated to reduce fuel cost to the minimum, incremental cost and generated power loss is an optimizations problems with multi-objective function. Generally, the objective functions are expressed in Equation 4.4
𝑀𝑖𝑛. 𝐹(𝑓 , 𝑓 , 𝑓 ) (4.1)
𝑓 is fuel cost objective function 𝑓 Incremental fuel cost function 𝑓 Power loss function
4.2.1. Fuel cost minimization function
Total fuel cost function employed a quadratic convex curve function as in Equation 4.2, minimum fuel cost guarantee how efficiently the power plant generators are operated.
𝑓 = ∑ 𝛾 𝑃 + 𝛽 𝑃 + 𝐾 (4.2) Where 𝛾 , 𝛽 , 𝛼 are cost coefficients for generators fuel as in Appendix A1 and A2, penalty factor Kpen are calculated depending if there exist possible equality or inequality
constraints violation express in Equation 4.3, the amount are added to fuel cost coefficient. In a situation where all the constraints are not violated the penalty factor is zero. 𝐾 = ⎩ ⎪ ⎪ ⎨ ⎪ ⎪ ⎧𝐿𝐹 (𝑃 − 𝑃 ) , 𝑖𝑓 𝑃 > 𝑃 𝐿𝐹 (𝑃 − 𝑃 ) , 𝑖𝑓 𝑃 < 𝑃 𝑜𝑟 𝑉 (𝑉 − 𝑉 ) , 𝑖𝑓 𝑉 < 𝑉 𝑉 (𝑉 − 𝑉 ) , 𝑖𝑓 𝑉 < 𝑉 0 , 𝑜𝑡ℎ𝑒𝑟𝑤𝑖𝑠𝑒 (4.3)
4.2.2. Incremental fuel cost minimization function
A functions parameter measuring how expensive the next generated power demand will be after generator requested supply presented in Equation (4.4).
𝑓 = 2𝛾 𝑃 + 𝛽 (4.4)
4.2.3. Active power loss function
Minimum transmission losses secure and guarantee minimum cost to efficiently operate power system, the distance at which generators are located to the load center determine how much losses are inherent at the system network as expressed in Equation (4.5).
𝑓 = ∑ 𝑔 𝑉 + 𝑉 − 2𝑉 𝑉 cos 𝜃 (4.5)
4.2.4. Equality and inequality constraints
Operating constraints allow the optimization to guarantee the optimal component dispatch of generation is within the allowable limit, in reality forcing the transmission system into limit violation may put the system in danger. The equality constraints for real and reactive power are given in Equation 4.6 and 4.7 respectively.
𝑃 − 𝑃 − ℜ 𝑉𝒊 ∑ 𝑌 𝑉 ∗ = 0 (4.6)
𝑄 − 𝑄 − ℑ 𝑉𝒊 ∑ 𝑌 𝑉 ∗
= 0 (4.7)
The inequality constraint of line flow of transmission line are given in Equation 4.8, is the transmission capacity between bus i and j.
𝐿𝐹 = ℜ 𝑉 𝑉 − 𝑉 𝑌 + 𝑉 𝑦 ∗ ≤ 𝐿𝐹 (4.8)
The second inequality constraints associated with generators bus voltages, real and reactive power limit, shunt VAR reactive power injection, regulating transformer tap setting between lower and upper constraints are given in Equation 4.9.
𝑉 ≤ 𝑉 ≤ 𝑉 𝑃 ≤ 𝑃 ≤ 𝑃 𝑄 ≤ 𝑄 ≤ 𝑄 𝑄 ≤ 𝑄 ≤ 𝑄 𝑇 ≤ 𝑇 ≤ 𝑇 (4.9)
The above constraints constitute the security of the optimal dispatch operation, the nonlinearity of the constraints in optimizations necessitate applying penalty factor in the objective function, to account the violation which is also a cost.
4.3. Test System and Results
In this approach robustness, efficiency and feebleness of new emerging Nature-Inspired based optimization algorithm of CS, BA, FPA, and FA have compared against well-developed PSO and GA for OPD problems investigation. In our proposed approach IEEE-26 and IEEE-30 bus system are verified on, penalty function is included in case of limit violation. In the optimization procedure initials independent variable is assigned randomly to perform power flow using Newton–Raphson, and then set depended on variable automatically. The optimal solution is achieved using respective algorithm setting parameters, the procedure is shown in Figure 4.3. The algorithms first initialized with random values and power flow solution is applied for those values. The constraints condition are checked if violation exist penalty function is applied. Otherwise new random values are generated with different values. Without any violation, fuel cost and incremental fuel cost are calculated with minimum loss for the next step. The best fitness candidate is selected, optimization algorithm operators are applied to obtained global best value for each one of the algorithms, the procedure is repeated until the maximum iteration or convergence of the algorithm is reached. Optimization common parameters controls are generation number and population size, other parameters explicitly stated, these parameter sets are obtained after several runs of course due to randomization a better result becomes worst result in some run. Population size = 60, Generation six =200, PSO: Inertia weight = [0.4, 0.9], Acceleration factor = [2, 2]. GA: Roulette function, with scatted crossover, mutation function is a constraint, crossover fraction is positive scalar (0.8). CS: probability of discovering nest pa=0.25 step-size scaling factor α= 0.01, Lévy exponent λ = 1.5. BA: Loudness A= 0.9, pulse emission rate r = 0.8. FFA: probability switch p = 0.8. FA: absorption coefficient of light γ = 1, attractiveness β= 0.8, randomization α = 0.9.
Proposed Algorithm :
Optimal_Power_Dispatch (Max_Iterations, Max_Solutions) Parameters List:
Num_Iteration: generation counter; 𝑁𝑢𝑚_𝑆𝑜𝑙𝑢𝑡𝑖𝑜𝑛: solution counter; Best_solution: value for best solution; Min_Fitneess: fitness for best solution SOLUTIONS array that holds current generation of solutions
Generate_Solutions():Sub-function that generate new solutions depending on the optimization algorithm
Newton_Raphson(): Sub-function that performs power flow analysis using N-R Violations():Sub-function that checks the constraint violations
Optimization_Operators():Sub-function that breeds the new solutions 01 INITIALISE Num_Iteration =1; 𝑁𝑢𝑚_𝑆𝑜𝑙𝑢𝑡𝑖𝑜𝑛 =1;
02 SET 𝑆𝑂𝐿𝑈𝑇𝐼𝑂𝑁𝑆 =Generate_Solutions(); 03 LOOP WHILE Num_Iteration <= Max_Iterations 04 SET Num_Iteration= Num_Iteration+1
05 LOOP WHILE 𝑁𝑢𝑚_𝑆𝑜𝑙𝑢𝑡𝑖𝑜𝑛 <= Max_Solutions
06 SET Solution= 𝑆𝑂𝐿𝑈𝑇𝐼𝑂𝑁𝑆[𝑁𝑢𝑚_𝑆𝑜𝑙𝑢𝑡𝑖𝑜𝑛] 07 RUN Newton_Raphson() 08 IF Violation (constraint) 09 IF IS Generator_Violation 10 Apply_Panalty() 11 GOTO Line 15 12 END IF 13 GOTO Line 04 14 END IF 15 SET 𝐹𝑖𝑡𝑛𝑒𝑠𝑠 = 𝑜𝑏𝑗𝑒𝑐𝑡𝑖𝑣𝑒 𝑓𝑢𝑛𝑐𝑡𝑖𝑜𝑛() 16 IF 𝐹𝑖𝑡𝑛𝑒𝑠𝑠 < Min_Fitneess; 17 SET Min_Fitneess= 𝐹𝑖𝑡𝑛𝑒𝑠𝑠 18 Best_solution= Solution 19 END IF 20 SET 𝑁𝑢𝑚_𝑆𝑜𝑙𝑢𝑡𝑖𝑜𝑛 = 𝑁𝑢𝑚_𝑆𝑜𝑙𝑢𝑡𝑖𝑜𝑛 +1 21 END LOOP 22 SET 𝑆𝑂𝐿𝑈𝑇𝐼𝑂𝑁𝑆 =Generate_Solutions(); 23 RUN Optimization_Operators(); 24 RETURN Best_solution 25 END LOOP
Figure 4.3 Proposed pseudocode algorithms
The optimal power dispatch result for IEEE-26 bus data are presented in Table 4.1, and for IEEE-30 bus data are presented in Table 4.2. To avoid premature result interpretation, several simulations run are carrying out with fixed tuned parameters. In both cases, the total fuel cost shows a direct relationship with the total minimum loss, and incremental fuel cost obtained for all the algorithms for GA in Table 4.1. Fuel cost (15118 $/h), incremental fuel cost (30.186 $/h), total losses (12.161 MW) are relatively higher than PSO, CS, BA, FPA, and FA even though GA has a minimum simulation time to approach convergence.