T.C.
BIRUNI UNIVERSITY
INSTITUTE OF HEALTH SCIENCES
DEPARTMENT OF MOLECULAR BIOLOGY AND GENETICS MOLECULAR AND MEDICAL GENETICS MASTERS PROGRAM
DETERMINATION OF THE EXPRESSION LEVELS OF
THE KALLIKREIN (KLK) GENE FAMILY IN PROSTATE
CANCER
FATMA BÜŞRA BÖYÜKÖZER
ADVISOR
ASST. PROF. DR. Elif Sibel Aslan
İSTANBUL 2018
ii I. DECLARATION
I hereby declare that the study entitled ‘Determination of the expression levels of the Kallikrein (KLK) gene family in Prostate Cancer’ is my original work and fully and specifically acknowledged wherever adapted from other sources. It has not been published or submitted for any degree, diploma or other similar titles elsewhere. This information is purely of academic interest.
iv II. ACKNOWLEDGEMENTS
I wish to express my sincere gratitude to my advisor Assistant Professor Dr. Elif Sibel Aslan, for her great help on my master’s thesis.
Also, I thank Dr. Esra Güzel for her help in experiments and technical support, and Michael Ittmann for samples for our experiment.
I also thank to my lovely husband Mehmet Z., my supportive mother, my dearest father and my children Zehra, Emir Yahya and Reyyan for their positive motivation.
v III. TABLE OF CONTENTS
Index
Page number
İç Kapak -
Thesis Approval -
I.Declaration iii
II.Acknowledgement iv
III.Table of Contents v
IV.Symbols and Abbreviations vi
V.List of Tables vii
VI.List of Figures viii
1.Özet ve anahtar kelimeler 1
2.Abstract 2
3.Introduction and Purpose 3
4.General Information 5
5.Methods and Materials 22
6.Results 29 7.Discussion 44 8.Conclusion 49 9.Resources 50 10.Appendix Ek 1.Gönüllü Olur Formu 59
Ek 2. Etik Kurul Onayı 61
Intihal raporu 63
vi IV. SYMBOLS / ABBREVIATIONS
AR : Androgen Receptor
cDNA : Complementary Deoxyribonucleic Acid DHT : Dihydrotestosterone
DNA : Deoxyribonucleic Acid DMSO : Dimethyl Sulfoxide dH2O : Distilled Water M : Metastasis
N: Lymph Node Count
PIN : Prostatic Intraepithelial Neoplasia PCa : Prostate Cancer
PSA : Prostate Specific Antigen
qRT-PCR : Quantitative Reverse Transcriptase Polymerase Chain Reaction RNA : Ribonucleic Acid
RP : Radical Prostatectomy 5 α R : 5 Alfa Reductase T : Tumor Size
μl : Microliter μm : Micrometer
vii V. LIST OF TABLES
Table No Table Name Page
Table 1 TNM Stage 14
Table 2 Cancer Stage 15
Table 3 KLK Gene Family 18
Table 4 Table 5 Table 6 Table 7 Table 8 Table 9
PCR conditions required for cDNA
cDNA-synthesis mix for target gene quantification Real Time PCR conditions
KLK primer pairs
Sample RNA concentrations and purity of RNA Gleason scores of the tumor samples
24 25 25 27 28 30
viii VI. LIST OF FIGURES
Figure No Figure Name Page
Figure 1 Prostate gland 6
Figure 2 Global incidence rates for prostate cancer 7 Figure 3
Figure 4 Figure 5
Global mortality rates for prostate cancer
Percent of Deaths by Age Group: Prostate Cancer Percent of Cases by Stage
9 10 12 Figure 6 Figure 7 Figure 8 Figure 9 Figure 10 Figure 11 Figure 12 Figure 13 Figure 14 Figure 15 Figure 16 Figure 17
KLK1 gene expression level
KLK1 gene expression levels in normal and tumor tissues KLK2 gene expression level
KLK2 gene expression levels in normal and tumor tissues KLK3 gene expression level
KLK3 gene expression levels in normal and tumor tissues KLK4 gene expression level
KLK4 gene expression levels in normal and tumor tissues KLK8 gene expression level
KLK8 gene expression levels in normal and tumor tissues KLK9 gene expression level
KLK9 gene expression levels in normal and tumor tissues 33 34 35 36 37 37 38 39 40 40 41 42
1
1. ÖZET
Böyüközer, F.B. (2018). Prostat Kanserinde Kallikrein (KLK) Gen Ailesinin Ekspresyon Seviyelerinin Belirlenmesi. Biruni Üniversitesi Sağlık Bilimleri Enstitüsü, Moleküler Biyoloji ve Genetik ABD. Yüksek Lisans Tezi. İstanbul.
Prostat kanseri günümüzde erkek toplumunu ilgilendiren ve ölümle sonuçlanan en ciddi kanser türlerindendir. Genellikle 50 yaşından sonra görülmeye başlar ve ileri yaşlarda görülme sıklığı artar. Prostat kanserinin erken evrede teşhisi mortalite ve morbiditeyi azaltılması açısından önem taşımaktadır. Ancak prostat kanseri başlangıç tedavisini takiben kanserin büyümesi yavaş olabilir ve özellikle yüksek riskli prostat kanseri olan erkeklerin % 30-90'ında nüks oluşabilmektedir. Prostat kanseri tanısında en yaygın kullanılan belirteç olan prostat spesifik antijen (PSA)’in özgüllüğü ve pozitif öngörü değeri düşük olup kanser tanısı için mutlak alt sınır değeri henüz tanımlanamamıştır. Radikal prostatektomi sonrasında takipte iki defa ölçülen PSA değerinin >0.2 ng/mL üzerinde ve radyoterapi sonrasında ise nadir PSA seviyesinin ≥2 ng/mL üzerindeki artışı biyokimyasal nüks olarak tanımlanmaktadır.
Kallikrein (KLK) gen ailesi hem DNA hem de amino asit seviyesinde önemli homolojileri paylaşan salgılanmış serin proteazları kodlayan 15 gen içerir. İnsan kallikrein gen ailesinin iki üyesi, prostat spesifik antijen ve insan kallikrein 2, prostat kanseri biyobelirteçleri olarak klinik uygulamada kullanılmaktadır. Çalışmamız kapsamında 34 adet tekrarlayan 36 adet tekrarlamayan prostat kanseri ve 19 normal doku örneklerinde 15 adet KLK gen ekspresyon düzeylerinde değişimleri incelenmiştir. Bu noninvaziv yöntemi PKa tanısında güçlü̈ bir aday yapmaktadır. Sonuç olarak, tekrarlayan PKa’da KLK gen ailesinin ekspresyon seviyelerindeki farklılık literatürde ilk kez tarafımızdan gösterilmiştir. PSA’nın rutin muayenede kolay uygulanabilir olması ve prostat kanserinin diğer KLK’lar ile olan ilişkisi incelenmiştir. Sonuçlarımız, PKa’da farklı eksprese olan KLK’ların nüks belirteci olarak kullanılabileceğini göstermiştir.
2
2. ABSTRACT
Böyüközer, F.B. (2018). Biruni University, Institute of Health Sciences, Molecular Biology and Genetics. Masters Thesis. İstanbul.
Prostate cancer is one of the deadliest cancer types affecting the male population that results with loss of life. Usually begin to appear after the age of 50, and the incidence increases with advanced age. Diagnosis of prostate cancer at the early stage is important in reducing mortality and morbidity. However, after initial treatment, cancer growth may be slow and recur in 30-90% of male patients with increased prostate cancer risk. The specificity and positive predictive value of prostate specific antigen (PSA), the most widely used biomarker for prostate cancer, is low and the absolute lower limit value for cancer diagnosis has not yet been identified. Biochemical recurrence is defined as an increase in PSA value >0.2 ng/mL, measured twice after radical prostatectomy and nadir PSA value ≥2 ng/mL, after radiotherapy.
The Kallikrein (KLK) gene family consist of 15 genes encoding secreted serine proteases that have relevant homologies at both the DNA and amino acid level. Two members of the human kallikrein gene family, prostate specific antigen (PSA) and human kallikrein 2 (hK2), are used clinically as prostate cancer biomarkers. In our study, changes in 15 KLK gene expression levels in 34 recurring 36 non-recurring prostate cancers and 19 normal tissue specimens were investigated. This non-invasive method makes a strong candidate for PCa diagnosis. In conclusion, the difference in expression levels of the KLK gene family in recurrent PCa has been shown for the first time by us in the literature. Easy application of PSA in routine examination and the relationship between prostate cancer and other KLKs have been examined. Our results have shown that KLKs, which are differently expressed in PCa, can be used as recurrence markers.
3
3. INTRODUCTION AND PURPOSE
Prostate cancer is the most typical cancer in males and can lead to death (Coffey 1993). Serum test for prostate-specific antigen, and procedures developed for surgical intervention and radiation therapy substantially reduce cancer mortality with early diagnosis of prostate cancer (Pezaro, et al. 2014). Clinical cancer staging of prostate cancer; PSA, digital rectal checkup, prostate biopsy findings and imaging methods are applied. In this view, it is possible to select the most appropriate treatment by determining the extensiveness of the disease using the pre-treatment clinical parameters and estimating the prognosis of the disease. When staging is done in prostate cancer, the risk assessment of the disease and the possibility of cancer recurrence are taken into consideration. The recurrence of prostate cancer depends on the treatment previously received by a patient and tumor characteristics. Most recurrent cancer patients have an increase in PSA levels, while some have evidence of recurrent cancer with x-rays or screening (Hanna and Jones 2015; Woodrum, et al. 2015). However, today, there is still no effective cure for advanced prostate cancer patients. For this reason, research continues for prognostic determinants that can differentiate prostate cancer from aggressive forms.
In the treatment planning of prostate cancer; patient age, tumor stage, accompanying health problems and risk groups are taken into consideration. Radical prostatectomy (RP) is the process of excising prostate tissue together with prostatic urethra that is between external sphincter and bladder neck and seminal vesicles so that negative surgical margins are obtained. Follow-up is of great importance in patients who have undergone RP surgery at an early age and who are in the moderate or high risk group for recurrence (Sternberg, et al. 2014). In patients with moderate or high risk (PSA ≥10 and/or Gleason score ≥7 and/or clinical stage ≥T2b), follow-ups are required once every 3 months for first 2 years, semiannually for next 2 years and every year for the following years (Mithal, et al. 2015).
The Kallikrein (KLK) gene family is a subgroup of serine proteases and is located on the same chromosomal locus 19q13.4. The KLK genes share significant homogeneity at nucleotide and protein levels. These genes are encoded for supposed serine proteases and majority of these genes are regulated by steroid hormones
4 (Yousef and Diamandis 2001). In recent studies, it is known that at least a few of the kallikrein genes play a role in malignancy formation that includes gene and protein structure, enzymatic activities, tissue expression, hormonal regulation and alternative splicing.
It has been shown that KLK genes are expressed at various levels in a broad range of tissues showing a functional involvement of human kallikrein proteases at various degrees of physiological processes. For example, it is known that certain kallikrein genes (NES1, protease M, PSA) have reduced expressions in prostate, breast and other cancers. NES1 has been shown to be a potent angiogenesis inhibitor of a novel breast cancer tumor suppressor protein and PSA (Diamandis, et al. 2000).
This study aimed to explore the potential biological effects of the KLK gene family on recurrence of prostate cancer since PSA has failed to predict prostate cancer. PCa mechanism in the direction of the obtained data will be better understood and lead to new projects for treatment.
5
4. GENERAL INFORMATION
4.1. Prostate
The prostate is the organ of the reproductive system, located just at the exit of the bladder. In males, the prostate is a small gland about the size of a chestnut that produces seminal fluid that nourishes and transports sperm it is approximately 4 cm in diameter, 2 cm in thickness, and 20 grams in weight (Wilson 2014). The prostate secretes the fluid that feeds and protects the semen. During ejaculation, the prostate compresses this fluid into the urethra and excretes it out as semen. Prostate secretions allow the male reproductive cell sperm to survive on the female reproductive tract (Lee, et al. 2011).
4.2. Prostate Cancer
Prostate cancer is one of the most common types of cancer in men developing in the prostate, the second most common cause of death after lung cancer. Usually the prostate cancer grows gradually and is initially limited to the prostate gland, which does not cause serious damage. However, some types of PCa grow slowly while other types are aggressive and can spread rapidly (Schrecengost and Knudsen 2013). Every year around the world, 899,000 new prostate cancers are detected and 258,000 people lose their lives due to prostate cancer. By 2030, it is predicted that 1.7 million new prostate cancer cases will be seen annually and 499,000 patients will lose their lives due to prostate cancer (Bellier, et al. 2018; Peisch, et al. 2017).
6
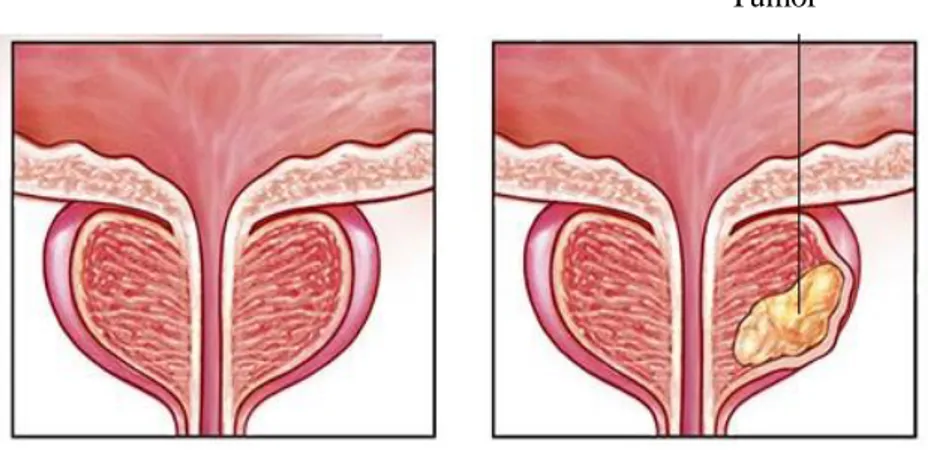
Figure 1. Prostate gland
Prostate cancer occurs in the prostate gland, which is located below a male's bladder. A normal prostate gland and a prostate with a tumor are shown in this figure.
(https://www.mayoclinic.org/diseases-conditions/prostate-cancer/symptoms-causes/syc-20353087, Date of access: 21.06.2018)
7
Figure 1. Global incidence rates for prostate cancer Prostate cancer incidence rates are higher at North America, Australia, Northern and Western Europe. The rates
are also high at less developed regions such as South America and South Africa.
8 The global incidence rates for prostate cancer varies more than 25 times in the world. The difficulty to diagnose prostate cancer at early stage and access to PSA (prostate specific antigen) test in different regions causes the variety. The prostate cancer usually arises from the outer part of the gland; it does not cause any urination symptoms, makes the diagnosis of prostate cancer at onset very difficult. The cancer may or may not show any symptoms. More advanced prostate cancer may have symptoms such as difficulty in urination, decreased urine flow, erectile dysfunction, blood in the semen, discomfort in the pelvic area and bone pain. However, access to PSA (prostate specific antigen) test makes early diagnosis of prostate cancer possible. The PSA (prostate specific antigen) test is prominently being used in the regions where incidence discovery rate is the highest such as Australia/New Zealand and North America (ASR 111.6 and 97.2 per 100,000, respectively) and Western and Northern Europe. Incidence rates are also relatively high in less developed regions such as Caribbeans (ASR 79.8 per 100,000), South Africa (ASR 61.8 per 100,000) and South America (ASR 60.1 per 100,000). PSA test has a greater effect on incidence than mortality thus worldwide mortality rate changes (ten times between approximately 3 and 30 in 100,000) are less likely to be observed than changes in incidence and, rates are much less compared to developed regions (165,000 and 142,000, respectively). Mortality rates are generally found to be very low in black populations (Caribbeans, 100,000 and sub-Saharan Africa 29) and Asia (for example 2.9 in 100,000 in South-Central Asia), modestly high in America and Oceania (Khazaei, et al. 2016) (Figure 2-3). According to GLOBOCAN data, prostate cancer with approximately 307,000 deaths in 2012 and 6.6% of total men deaths was reported to be the fifth leading cause of cancer death in men (Hassanipour-Azgomi, et al. 2016; Khazaei, et al. 2016). It is reported that prostate cancer is the 6th most common cancer in our country and it is present in rates of 6.1%. (Haydaroğlu A 2007). In addition, lifetime risk of developing prostate cancer is 30%, risk of developing clinical prostate cancer is 10%, and risk of prostate cancer death is 3%. Among other factors, age is the most important risk factor, the incidence of cancer increases starting from the age of 50. The mortality rate for age less than 44 years age and ages over 44 is 0.01% to 99.99% respectively. In addition to age, genetics, black race, high-fat diets play a role in the development of cancer (Grossman, et al. 2018). It is predicted that in 2018, new prostate cancer cases will constitute 9.5% of all new cancer cases with 164,690, and %4.8 of all cancer deaths with the estimated deaths of 29,430. The age rates of prostate cancer in all men between 2011 and 2015 are as shown in Figure 4 (https://seer.cancer.gov/statfacts/html/prost.html, Date of access : 16.05.2018 ).
9 Figure 2. Global mortality rates for prostate cancer Prostate cancer mortality rates are higher at less developed regions such as South Africa and South
America. Diversely, mortality rates are lower at South Asia and sub-Saharan Africa. ( http://globocan.iarc.fr/old/FactSheets/cancers/prostate-map-m1.png, Date of access: 23.06.2018)
10 Figure 3. Percent of Deaths by Age Group: Prostate Cancer (2011-2015). The percent of
prostate cancer deaths is highest among men aged 75-84.
(https://peterattiamd.com/wp-content/uploads/2018/02/prostate-survival-1.png, Date of access: 29.06.2018)
4.2.1. Diagnosis of Prostate Cancer
4.2.1.1.Prostate Specific Antigen
Prostate Specific Antigen (PSA) is an enzyme released from the prostate gland in men providing sperm liquidation. Essentially, it is secreted from the cells surrounding and forming the inner part of the ducts of the prostate (Kornberg, et al. 2018). PSA is a mostly prostate-specific enzyme that is also secreted by the pancreas and salivary glands in very small quantities. The concentration of PSA in the sperm is much higher than in blood, and only a fraction of the produced PSA circulate in the blood. In healthy individuals, serum levels of PSA may vary depending on prostate volume, age, and race (Blanc-Lapierre, et al. 2017; McVary and Rademaker 1990). Increased levels of PSA in the blood is important for prostate cancer, however it is not specific to prostate cancer alone. PSA levels may increase in ejaculation, transurethral catheterization, transrectal ultrasonography, trauma and benign growth of the prostate, prostate infections as well as diseases such as PCa, BPH, cystoscopy and prostatitis (Caster, et al. 2015). PSA level of 4.0 ng/mL is considered normal. Therefore, if a man has a PSA level above 4.0 ng/mL, digital prostate examination, the other important modality in the early diagnosis
11 of prostate cancer, should be done and evaluated together with the PSA level. Although 25% of patients diagnosed with prostate cancer have PSA levels within normal limits, the diagnosis is made with the stiffness and irregularity determined by digital examination. When there is a suspicion on the digital examination or in the PSA, ultrasonography guided needle biopsy is performed and prostate tissue samples are obtained (Hayes and Barry 2014).
Additional tests such as computed tomography, bone scintigraphy, and MRI may be required depending on the disease stage. Cancers limited to the organ respond very well to surgical treatment. In recent years, the success of surgeries has been reported to increase with developments of laparoscopic and robotic methods. In advanced stages; hormone-therapy, radiotherapy, chemotherapy and surgery are among the treatment methods (Fiz, et al. 2018).
4.2.2. Prostate Cancer Formation
There are many studies about the familial and genetic side of prostate cancer. Known risk factors for prostate cancer are age, family history and race. Age is the most important risk factor known in prostate cancer. In older ages, the incidence of prostate cancer is increasing (Gann 2002).
The earlier the age of the person who has been diagnosed with prostate cancer in the family, the higher the number of persons who have acquired prostate cancer in the family and the degree of relativity, the greater the risk. For example, a man with a father with prostate cancer is twice as likely to have prostate cancer, while with a brother with prostate cancer is 3 times as likely compared to normal risk. If both brothers and father have prostate cancer within the same family, the risk is 5 times higher. Generally, prostate cancer, which is a disease of men aged 50 years or older, is due to both genetic and environmental factors (Bostwick, et al. 2004; Leitzmann and Rohrmann 2012).
12 Figure 5.Percent of Cases by Stage. (2007-2013) The percent of the prostate cancer cases varies by stage. Prostate cancer is mostly localized to primary site. However, it could be spread to other parts of the male’s body.
(https://peterattiamd.com/wp-content/uploads/2018/02/prostate-survival-1.png, Date of access: 29.06.2018)
4.2.2.1. Age
Age is among the causes of prostate cancer, in fact it is considered to be the most important risk factor for cancer formation. Although pre-neoplastic lesions known as prostatic intraepithelial neoplasia (PIN) are seen at an early ages, the incidence is high in males aged 50 years (Sakr, et al. 1993), and it is much more common in individuals aged between 60-70 years. It was recorded that the incidence of PCa in our country was 8.3% in individuals in their 50s and increased up to 33.3% in individuals in their 80s and above. The appearance of precancerous lesions in male elderly individuals is significantly more common than the incidence of prostate carcinoma. For this reason, cancer-related morphological changes occur early in life and invasive carcinoma formation is more common as a consequence of aging (Mahran, et al. 2018).
13 4.2.2.2. Environmental factors
The incidence of prostate cancer in the United States is significantly higher than that of Asian countries, with the presence of histologic pre-neoplastic lesions (Dhom 1983). For this reason, it is assumed that diet and environmental factors play a crucial role in prostate carcinogenesis, as in other epithelial cancers (Steinberg, et al. 1990). 4.2.2.3. Familial inheritance
The ratio of familial inheritance is a small percentage (10%) of prostate cancers and most reports reflect association with early stage disease (Carter, et al. 1992; Nelson, et al. 2013). Although the candidate genes responsible for the formation of cancer have not yet been identified, studies have shown the presence of 2 loci (Ostrander and Stanford 2000) in predisposing families located in X chromosome and chromosome 1q region. In addition, statistical relationship between breast and prostate cancer has been reported in many studies however the molecular basis of such a link is still unclear (Anderson and Badzioch 1993; Bennett, et al. 2002).
4.2.2.4. The role of steroid hormones
In prostate carcinogenesis, steroid hormone receptors play a significant role in all phases of cancer formation. In particular, it has been reported that androgens have a substantial age-related decrease in men compared to estrogens and androgens have been reported to be a contributing factor in the onset of prostate cancer (Prehn 1999). The steroid binding protein in the prostate gland is increased by the effects of androgens. Dihydrotestosterone (DHT) is essential for the differentiation, development and secretion functions of the prostate. Testosterone-derived DHT produced with 5 alpha-reductase (5 α R) causes the secretion of keratinocyte and fibroblast growth factors in prostate mesenchymal cells. These growth factors cause hypertrophy and hyperplasia in the prostate gland (Bhargava 2014).
4.2.2.5. Heterogeneity and multifocality
The heterogeneous and multifocal character of prostate cancer lesions creates significant challenges in the diagnosis and treatment of the disease. Regarding heterogeneity, a histological examination of the prostate cancer gland typically reveals
14 benign glands, PIN foci and neoplastic foci at varying degrees of severity are side by side. For taking this heterogeneity into account, Gleason proposed a rating system, a common system used by pathologists, and is used to develop appropriate treatment methods. In this system, a higher Gleason grade related to the two most common neoplastic foci indicates the presence of a more advanced carcinoma (Gleason 1992).
4.2.3. TNM Staging in Prostate Cancer
The treatment of prostate cancer is planned based on the cancer staging and risk assessment. It is done by assessment of limitation of cancer to an organ, spreading to regional lymph nodes, distant metastases (Cheng, et al. 2012). Radiological imaging (computed tomography [CT], MRI) or bone scintigraphy are methods used for staging. In the TNM system, prostate cancer limitation to the organ is defined as T-staging; lymph node involvement as N-staging and distant metastasis is defined as M-staging (Mottet, et al. 2017).
Table 1. TNM Stage Tumor (T)
T0 No evidence of primary tumor
T1 Non-palpable tumor that is not evident from radiographic imaging T2 Palpable tumor confined to the prostate
T3 Palpable tumor extending beyond the prostate
T4 Palpable tumor that is fixed or that invades adjacent structures Lymph Nodes (N)
N0 No lymph node metastases
N1 Metastases in one regional lymph node that is ≤2 cm wide
N2 Metastases in one or more regional lymph nodes, each ≤5 cm wide N3 Metastases in at least one regional lymph node each >5 cm wide Distant metastases (M)
M0 No evidence of distant metastases M1 At least one distant metastasis
15 The staging of prostate cancer reveals how much cancer is present in the body. It is used to determine the best method of treatment as well as the course and condition of cancer. Cancer stage is based on tests performed in prostate cancer, including blood PSA level, and biopsy results (Mottet, et al. 2011).
Table 2. Cancer Stages
Stage I the cancer is small and only in the prostate
Stage II the cancer is larger and may be in both lobes of the prostate but is still
confined to the prostate
Stage III the cancer has spread beyond the prostate to close by lymph glands or
seminal vesicles
Stage IV the cancer has spread to other organs such as the bone and is referred
to as metastatic vesicles
(www.cancer.gov, Date of access: 30.06.2018)
4.2.4. Gleason Scoring
It should be considered together with the stage, and shows "how important cancer is" in the cancerous tissue detected with biopsy. The grading system used to determine is called the Gleason Score. Cancer cells are graded by giving a score of 1 to 5 (1: closest to normal, best; 5: unusually different, worst), which are different from the normal structural changes shown in microscopic images of cancer cells. The Gleason score is a value between 2 and 10 because it is a total value. The pathologist determines the two most frequent differences in tissues obtained by biopsy and gives a total "Gleason score", in which the most common becomes first (Chen and Zhou 2016; Stark, et al. 2009).
If there is no prostate tissue in the biopsy tissues, it should be evaluated as inadequate for diagnosis and a biopsy should be performed again. Intraductal carcinoma, lymphovascular invasion and presence of cancer exceeding the prostate,
16 presence of cancer in each biopsy piece, length and ratio should be indicated. Because this data is very important in determining the cancer volume and therefore the treatment to be performed. A biopsy piece with >5 mm or >50% cancer presence indicates an important cancer presence that needs to be treated immediately. Also, if only one of the received biopsies has cancer in a small focus, the cancer grade, length and percentage should be indicated. This is because it may require a re-biopsy before deciding on treatment. As the Gleason score increases, cancer proliferation, progression, exceeding of prostate and spreading (aggressiveness) increases. Also, the most common degree level is also important. For example, a Gleason score of 4+3=7 is more aggressive than 3+4=7, even though it has the same score (Epstein, et al. 2016; Wright, et al. 2009).
4.2.5. Recurrent Prostate Cancer
The PSA test is used in the follow-up of patients to see if cancer has recurred after treatment. Elevation in PSA level after prostate cancer treatment may be the first indication of recurrence. Such a "biochemical relapse" occurs much earlier than other clinical signs and symptoms of prostate cancer recurrence (Marks and Bostwick 2008). The factors predicting prostate cancer in recurrent biopsies cannot be determined precisely. For this reason, the optimal biopsy strategy is still undetermined. In the literature, many factors are studied which suggest the possibility of recurrence of prostate cancer in cases with negative biopsies and to prevent unnecessary biopsies with PSA, PSA velocity, free/total PSA ratio, prostate cancer antigen gene 3 (PCA-3), high grade intraepithelial neoplasia, atypical small acinar proliferation, prostate volume and radiological methods (Ploussard and de la Taille 2018).
17 4.2.6. Treatment
The treatment of prostate cancer is performed with the use of surgical (radical prostatectomy, RP), radiotherapy (RT) and hormonal therapy (HT) approaches alone or in combination with risk groups. Determination of treatment in prostate cancer is one of the controversial areas (Logothetis, et al. 2013). The main reasons for this are: varying treatment depending on the patient's life expectancy and general health status, presence of controversial issues in the areas of expertise, difficulties in projecting the guidelines for clinical practice, and clinical trials in the literature that form basis for treatment and guidelines to be depending on mostly retrospective data and their value of evidence are limited. As a result, there are different treatment options for prostate cancer treatment that can be applied instead of each other in similar clinical situations according to the choice of the physician and the patient (Incrocci 2015; Klotz and Emberton 2014). 4.3. Kallikrein Gene Family
Kallikreins are a subset of serine proteases and enzymes capable of cleaving peptide bonds in proteins. In humans, while plasma kallikrein has a known paralogue, peptidases (KLKs) associated with tissue kallikrein encode a family of fifteen related serine proteases. These genes are localized on the 19q13 chromosome, which constitutes the largest contiguous cluster of proteases in the human genome. Kallikreins are responsible for the coordination of various physiological functions such as blood pressure, semen liquefaction and skin shedding (Yousef and Diamandis 2001). Features table with general information about KLKs is given in Table 3.
18 Table 3. KLK gene family. KLK gene family has 15 members which encodes different types of proteins, belongs to tissue kallikreins. KLK gen family members are located contiguously on the 19q13 chromosome.
Approved
Symbol Approved Name
Other protein
names/symbols Chromosome
KLK1 kallikrein 1 Pancreatic/renal kallikrein,
hPRK
KLK2 kallikrein related peptidase 2 Human glandular kallikrein
1, hGK-1 19q13.33
KLK3 kallikrein related peptidase 3 Prostate-specific antigen,
PSA 19q13.33
KLK4 kallikrein related peptidase 4 Prostase, KLK-L1 protein,
EMSP1 19q13.41
KLK5 kallikrein related peptidase 5 KLK-L2 protein; HSCTE 19q13.41 KLK6 kallikrein related peptidase 6 Zyme, protease M,
neurosin 19q13.3
KLK7 kallikrein related peptidase 7 HSCCE 19q13.33
KLK8 kallikrein related peptidase 8 Neuropsin; ovasin;
TADG-14 19q13
KLK9 kallikrein related peptidase 9 KLK-L3 protein 19q13.33 KLK10 kallikrein related peptidase 10 NES1 protein 19q13.41 KLK11 kallikrein related peptidase 11 TLSP/hippostasin 19q13.41 KLK12 kallikrein related peptidase 12 KLK-L5 protein 19q13.41 KLK13 kallikrein related peptidase 13 KLK-L4 protein 19q13.41 KLK14 kallikrein related peptidase 14 KLK-L6 protein 19q13.41 KLK15 kallikrein related peptidase 15 19q13.33
Kallikrein enzymes are generally divided into two main categories: plasma kallikrein and tissue kallikreins. These two categories differ significantly in terms of molecular weight, substrate specificity, immunological properties, gene structure and type of quinine released. Plasma kallikrein or Fletcher factor (official symbol KLKB1) is encoded by a single gene located on human chromosome 4q35 (Björkqvist, et al. 2013; Diamandis, et al. 2000) The gene consists of 15 exons and encodes an enzyme that secretes bioactive peptide bradykinin from a high molecular weight precursor molecule (high mol wt kininogen) produced by the liver. Plasma kallikrein is expressed only by the liver cells. The function of plasma kallikrein plays a role in the regulation of
19 vascular tone and inflammatory reactions through the involvement of blood clotting and fibrinolysis process and release of bradykinin (Biyashev, et al. 2006).
Tissue kallikreins are members of a large multigene family and exhibit significant similarities at the gene and protein level and at the same time in the tertiary structure. The term "kallikrein" is generally used to describe an enzyme that acts on a precursor molecule (kininogen) for the release of a bioactive peptide (quinine) (Charest-Morin, et al. 2015; Yayama, et al. 2003). Another term is often used to define these enzymes is "kininogenases". The term "kininase"; is used to describe other enzymes that can inactivate kinin. Between known human and animal tissue kallikreins, only one enzyme has the ability to efficiently release a bioactive quinine from kininogen (Biyashev, et al. 2006).
Similarities between the members of the new human kallikrein gene family 1. All genes belonging to the family are located in the same chromosomal region (19q13.4).
2. All genes encode with a conserved catalytic triad structure (histidine, aspartic acid and serine in appropriate positions) for serine protease variants.
3. All genes belonging to the family have five coding exons (some members contain one or more 5' untranslated exons).
4. The encoding exon sizes are similar or identical.
5. The intron phases are completely protected between the members of the gene families of the 15 human and rodent kallikreins.
6. All genes belonging to the family have significant sequence homology at DNA and amino acid levels (40-80%).
7. Most genes belonging to the gene family are regulated by steroid hormones.
The intron phase indicates the position of the intron in the codon: the intron phase I, intron, occurs after the first nucleotide of the codon; II, intron occurs after the second nucleotide; 0, intron occurs between the codons (Pavlopoulou, et al. 2010).
20 4.3.1. Gene Organization
All members of the new human kallikrein multigene family are coded for serine proteases. The organization of all genes is very similar, with the first encoding exon having a short 5'-untranslated regions, the second exon containing the catalytic triple amino acid histidine. Towards the end of the exon, at the beginning of middle catalytic triple aspartic acid and exon, the third exon contains the fifth exon, which contains the catalytic triple serine. Beyond the stop codon, there is a 3'-untranslated region of variable length (Murray, et al. 1990).
While making sure that the classical kallikreins do not have 5' untranslated exons, many other members of this multigene family have one or two 5' untranslated exons. The gene family also contains 5' untranslated exons that have not yet been identified. In addition, most of the 3p-untranslated regions of these genes sometimes vary, leading to variants with different mRNA lengths, however they encode for the same protein. Although the intron lengths of these genes vary considerably, the exon lengths are quite similar or identical (Digby, et al. 1989).
21
5. MATERIALS AND METHOD
5.2. Materials 5.2.1. Samples
All samples were obtained in accordance with approved ethical standards of the responsible committee of Baylor College of Medicine. 19 normal and 70 Prostate Cancer tissue samples (which are grouped as recurrent and non-recurrent) were obtained from Baylor College of Medicine, Texas, USA. The environmental conditions for storing the tissues are in a freezer with temperature set in -80 °C.
The specimens were prepared to be more than 70% tumor tissue from radical prostatectomy materials. According to this method, punch biopsies were taken from fresh tissue and the percentage of cancer in this area was determined complementarily by observing the tumor around the punch biopsy cavity during a routine histopathological examination of the material of radical prostatectomy. The validity and consistency of this method have been pointed out in various studies. For example, it has been shown that cancer tissues prepared by this method have expressed higher prostate cancer specific markers AMACR and PSGR, compared to prostate tissues without tumor and included prostate cancer specific gene fusions.
22 5.2.2. Equipments and Devices
5.2.2.1. Equipments
Hybridization Oven (Shel Lab, Oregan, USA) Mini Centrifuge (Thermo Scientific, Germany) Centrifuge (Hettich Retina 420R, Germany) Refrigerator (4 ⁰ C) (Vestel, Turkey) Freezer (-20⁰ C) (Vestel, Turkey)
Freezer (-80⁰ C) (Wisd, DAIHAN Scientific, Korea)
Nanodrop spectrophotometer (Thermo Scientific-ND 8000, Germany) Hot Plate (Thermo Scientific, Germany)
Laminar air-flow (Class II Safety Cabinet) (Metisafe, Turkey) Vortex (Wise Mix-VM10, Korea)
Micropipette (Thermo Scientific, Germany)
Multi chanel pipette (Thermo Scientific, Germany) Thermal cycler (PCR) (Biorad, USA)
Roche LightCycler 480 (Basel, Switzerland) 5.2.2.2. Solutions
cDNA Synthesis Kit (Transcriptor High Fidelity cDNA Synthesis Kit, Basel Stadt, Switzerland)
TRIzol (Ambion, USA)
Isopropanol (Sigma-Aldrich, USA) Ethanol (Merck, Darmstadt, Germany)
First-Strand cDNA Synthesis Kit for Real-Time PCR (Applied Biosystems, Foster City, CA, USA)
Syber Green PCR Master miX (Applied Biosystems, Foster City, CA, USA) Primers (Sentegen, Turkey)
23 5.2.3.Computer Software
SPSS 21 (Istanbul University, Software License Server © 01-2013) 5.3. Method
5.3.1. Processing of tissues with nitrogen
The specimens taken from the patient tissues were treated with liquid nitrogen and divided into small pieces.
5.3.2. RNA isolation with Trizol
1 mL of Trizol solution was added to the cells for RNA isolation from the tissues separated into the small particles and stored at -80° C until isolation. Pipetting for fragmentation of the homogenized cells and 5 minutes of incubation for complete dissociation of the proteins bound to the nucleic acids were carried out. Each sample was pipetted for 5 minutes after adding 0.2 mL of chloroform. The samples were centrifuged at 12000 x g for 25 minutes at +4° C. After the centrifuge, three phases were observed in the tubes. The lower phase includes extracellular membranes and polysaccharides, middle phase includes high 22 molecular weight DNA and top phase includes RNA. The RNA included clear phase was transferred to the new micro-tube. 0.5 mL isopropyl alcohol was added to each sample. The samples were incubated in ice for 30 min and then centrifuged at +4° C for 30 min at 12000 x g. After this step, RNA was observed as a whitish structure. After removal of the supernatant, 0.5 mL of 75% ethanol was added and centrifuged at 7500 x g for 10 min at +4° C. At the last stage, ethanol was removed from the RNA pellets by drying. The RNA pellets were then suspended in 30 μl of nuclease free water. Concentration measurement was obtained by taking 3 µl from each of the RNA samples.
24 5.3.3. Determination of RNA concentration and purity
RNA concentration and purity quality were measured spectrophotometrically with optical density (OD) measurement. The concentrations and purity degrees of the RNA samples were measured on the NanoDrop ND-2000c spectrophotometer device with absorbance values of 260 nm and 280 nm wavelengths.
Purity measurements of the samples were compared with the ideal value for RNA 2 (OD260 nm/OD280 nm> ~ 2.0), determined by the absorbance ratio at a wavelength of 260/280 nm. RNA integrity was checked by agarose gel electrophoresis and the tubes were put to -80° C to hold for further steps.
5.3.4. cDNA synthesis
The cDNAs were synthesized with Transcriptor HighFidelity Reverse Transcription kit from Roche (Switzerland) using the same amount of samples from the isolated RNAs.
5.3.4.1. Qualitative RT-PCR
Reverse transcriptase PCR protocol was used with Oligo (dt) 18 primers for single chain cDNA synthesis.
Table 4. PCR conditions required for cDNA
Phase Temperature(⁰C) Time Cycle
Incubation 50 2 min 1
Enzyme Activation 95 10 min 1
Denaturation 95 15 sec
40
25 The isolated RNA of each sample is incubated in ice for 10 min at +65° C with primer addition. Then, the buffer, protector, dNTPs, DTT and reverse transcriptase enzyme are added to medium and respectively incubated at optimal conditions (10-30 min at 45-55° C, 5 min at 85° C) and then PCR procedure is carried out.
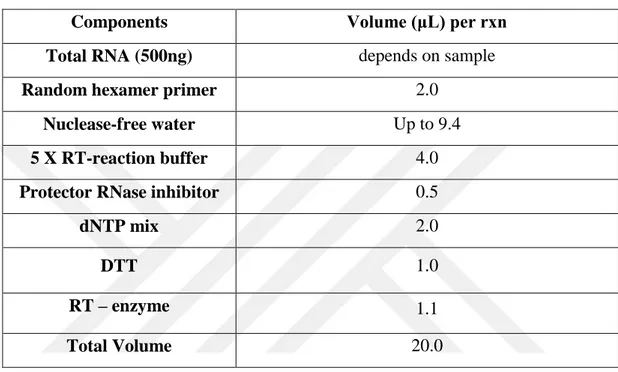
Table 5. cDNA-synthesis mix for target gene quantification
Components Volume (μL) per rxn
Total RNA (500ng) depends on sample
Random hexamer primer 2.0
Nuclease-free water Up to 9.4
5 X RT-reaction buffer 4.0
Protector RNase inhibitor 0.5
dNTP mix 2.0 DTT 1.0 RT – enzyme 1.1 Total Volume 20.0 5.3.5. Quantitative RT-PCR
Quantitative PCR analysis was performed by SYBR Green Master Mix of Roche (Switzerland). Quantitative gene expression assay for microRNAs and microRNA specific primers (KLK primers) were purchased from Exiqon Inc. (Denmark).
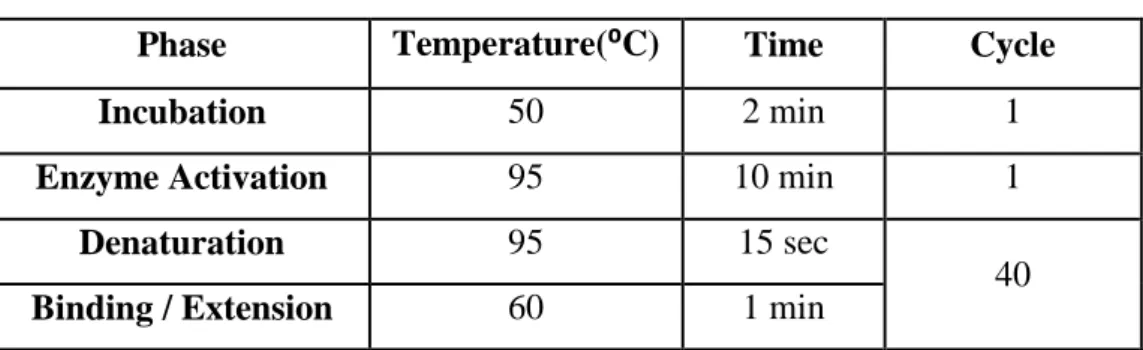
Tablo 6. Real Time PCR conditions
Program Temperature Time Cycle
Pre-incubation 95 °C 10 min 1 Amplification 95 °C 15 sec 40 60 °C 40 sec 72 °C 1 sec (reading) Cooling 95 °C 30 sec 1
26 The mix is optimized for SYBR Green reactions and contains SYBR Green I Dye, AmpliTaq Gold® DNA Polymerase, dNTPs with dUTP, Passive Reference, and optimized buffer components. It was performed in LightCycler480-II qRT-PCR. β-actin was used as an internal control.
5.3.6. Statistical Analysis
For statistical evaluations of the determined expression variations, data were plotted as mean ± standard deviation and p value was calculated from Student’s t-test. A p value of 0.05 or below was accepted statistically significant.
27
Table 7.KLK primer pairs. KLK primer pairs were designed by us in our laboratory at Biruni University. KLK1-F CAGACTTCATGCTGTGTGTCG KLK1-R TTCTCCGCTATGGTGTCCTC KLK2-F AGCCTGCCAAGATCACAGAT KLK2-R CCTTCTCAGAGTAAGCTCTAGCACA KLK3-F CGTGACGTGGATTGGTGC KLK3-R GCCGCAGACTGCCCTG KLK4-F CTCGCTAACGACCTCATGCT KLK4-R TGCAGACCTCCTCAGACACC KLK5-F TCCTCTCATTGTCCCTCTGC KLK5-R CGCAGAACATGGTGTCATCT KLK6-F GATGGTGGTGCTGAGTCTGA KLK6-R CCCACAGTGGATGGATAAGG KLK7-F CTGTCATCCATGGTGAAGAAAGT KLK7-R TTGACATCCACGCACATGA KLK8-F GTGGCAACTGGGTCCTTACA KLK8-R TGCTCTGGGCCATCTTTATT KLK9-F TCCACCTTACTCGGCTCTTC KLK9-R GCTGAGGTCCTTGTTGAAGC KLK10-F TCTCGCTCTTCAACGGCCT KLK10-R CCCTACTCGAGCCCACAGT KLK11-F GGCAACATCACAGACACCA KLK11-R CCCAGGAGATAATGCCTTGA KLK12-F TGTGTGTTCTTGGGCTCAGC KLK12-R CCCACCTGTGGTCAATAAGGAC KLK13-F GCACAAAAGAGGGTGGCAA KLK13-R CGGATCCACAGGACGTATCT KLK14-F GCCTATCCTAGAACCATCACG KLK14-R CTGGAGCTGTCCTCTGCA KLK15-F GGAAGGTGACGAGTGTGC KLK15-R TTGCGCAGGTTGTGCTCT
28
6. RESULTS
In accordance with purity measurements, RNA concentrations of the samples are given below. (Table 8)
Table.8 Sample RNA concentrations and purity of RNA
Sample No Tissue Type Tissue Status Concentration (ng/mL)
NR1 Prostate No Recurrence 1351 NR2 Prostate No Recurrence 429 NR3 Prostate No Recurrence 519 NR4 Prostate No Recurrence 303 NR5 Prostate No Recurrence 426 NR6 Prostate No Recurrence 1072 NR7 Prostate No Recurrence 644 NR8 Prostate No Recurrence 595 NR9 Prostate No Recurrence 709 NR10 Prostate No Recurrence 641 NR11 Prostate No Recurrence 350 NR12 Prostate No Recurrence 622 NR13 Prostate No Recurrence 411 NR14 Prostate No Recurrence 646 NR15 Prostate No Recurrence 971 NR16 Prostate No Recurrence 561 NR17 Prostate No Recurrence 347 NR18 Prostate No Recurrence 370 NR19 Prostate No Recurrence 743 NR20 Prostate No Recurrence 559 NR21 Prostate No Recurrence 454 NR22 Prostate No Recurrence 856 NR23 Prostate No Recurrence 453 NR24 Prostate No Recurrence 541 NR25 Prostate No Recurrence 675 NR26 Prostate No Recurrence 489 NR27 Prostate No Recurrence 765 NR28 Prostate No Recurrence 959 NR29 Prostate No Recurrence 456
29 NR30 Prostate No Recurrence 796 NR31 Prostate No Recurrence 547 NR32 Prostate No Recurrence 567 NR33 Prostate No Recurrence 863 NR34 Prostate No Recurrence 645 NR35 Prostate No Recurrence 1154 NR36 Prostate No Recurrence 596 R1 Prostate Recurrence 520 R2 Prostate Recurrence 473 R3 Prostate Recurrence 842 R4 Prostate Recurrence 806 R5 Prostate Recurrence 377 R6 Prostate Recurrence 789 R7 Prostate Recurrence 989 R8 Prostate Recurrence 760 R9 Prostate Recurrence 832 R10 Prostate Recurrence 1411 R11 Prostate Recurrence 435 R12 Prostate Recurrence 551 R13 Prostate Recurrence 964 R14 Prostate Recurrence 1118 R15 Prostate Recurrence 1165 R16 Prostate Recurrence 1287 R17 Prostate Recurrence 269 R18 Prostate Recurrence 913 R19 Prostate Recurrence 740 R20 Prostate Recurrence 311 R21 Prostate Recurrence 857 R22 Prostate Recurrence 496 R23 Prostate Recurrence 1024 R24 Prostate Recurrence 527 R25 Prostate Recurrence 634 R26 Prostate Recurrence 837 R27 Prostate Recurrence 486 R28 Prostate Recurrence 493 R29 Prostate Recurrence 572
30 R30 Prostate Recurrence 448 R31 Prostate Recurrence 589 R32 Prostate Recurrence 324 R33 Prostate Recurrence 567 R34 Prostate Recurrence 765
Gleason scores of tumor samples are given in Table 9. Table 9. Gleason scores of the tumor samples
Sample No Tissue Type Tissue Status Gleason of
Sample NR1 Prostate No Recurrence 3+4 NR2 Prostate No Recurrence 3+3 NR3 Prostate No Recurrence 4+3 NR3 Prostate No Recurrence 3+4 NR4 Prostate No Recurrence 2+3 NR5 Prostate No Recurrence 3+4 NR6 Prostate No Recurrence 3+4 NR7 Prostate No Recurrence 3+4 NR8 Prostate No Recurrence 4+4 NR9 Prostate No Recurrence 3+3 NR10 Prostate No Recurrence 3+3 NR11 Prostate No Recurrence 3+3 NR12 Prostate No Recurrence 5+5 NR13 Prostate No Recurrence 3+3 NR14 Prostate No Recurrence 3+3 NR15 Prostate No Recurrence 3+3 NR16 Prostate No Recurrence 3+4 NR17 Prostate No Recurrence 3+4 NR18 Prostate No Recurrence 3+3 NR19 Prostate No Recurrence 4+3 NR20 Prostate No Recurrence 3+3 NR21 Prostate No Recurrence 3+4
31 NR22 Prostate No Recurrence 3+3 NR23 Prostate No Recurrence 3+3 NR24 Prostate No Recurrence 3+3 NR25 Prostate No Recurrence 3+4 NR26 Prostate No Recurrence 3+4 NR27 Prostate No Recurrence 3+3 NR28 Prostate No Recurrence 4+3 NR29 Prostate No Recurrence 3+3 NR30 Prostate No Recurrence 5+4 NR31 Prostate No Recurrence 3+3 NR32 Prostate No Recurrence 3+3 NR33 Prostate No Recurrence 4+3 NR34 Prostate No Recurrence 3+4 NR35 Prostate No Recurrence 4+4 NR36 Prostate No Recurrence 3+3
R1 Prostate Early Recurrence 3+4
R2 Prostate Early Recurrence 3+4
R3 Prostate Early Recurrence 3+4
R4 Prostate Early Recurrence 2+4
R5 Prostate Early Recurrence 3+3
R6 Prostate Early Recurrence 3+4
R7 Prostate Early Recurrence 4+3
R8 Prostate Early Recurrence 3+4
R9 Prostate Early Recurrence 3+4
R10 Prostate Early Recurrence 4+4
R11 Prostate Early Recurrence 3+4
R12 Prostate Early Recurrence 3+3
R13 Prostate Early Recurrence 4+3
R14 Prostate Early Recurrence 4+5
R15 Prostate Early Recurrence 2+4
R16 Prostate Early Recurrence 4+4
R17 Prostate Early Recurrence 3+4
R18 Prostate Early Recurrence 4+3
R19 Prostate Early Recurrence 4+3
R20 Prostate Recurrence 4+3
32 R22 Prostate Recurrence 3+4 R23 Prostate Recurrence 3+4 R24 Prostate Recurrence 4+4 R25 Prostate Recurrence 3+4 R26 Prostate Recurrence 4+3 R27 Prostate Recurrence 4+3 R28 Prostate Recurrence 4+3 R29 Prostate Recurrence 3+4 R30 Prostate Recurrence 4+4 R31 Prostate Recurrence 5+4 R32 Prostate Recurrence 3+4 R33 Prostate Recurrence 4+3 R34 Prostate Recurrence 4+3
6.1. KLK Gene Expression Levels in Tissue Samples
Expression levels of the KLK gene family were shown by qRT-PCR in prostate samples (recurrent, non-recurrent and normal tissues). Recurrent, non-recurrent, and normal tissue specimens are evaluated with expression level comparison.
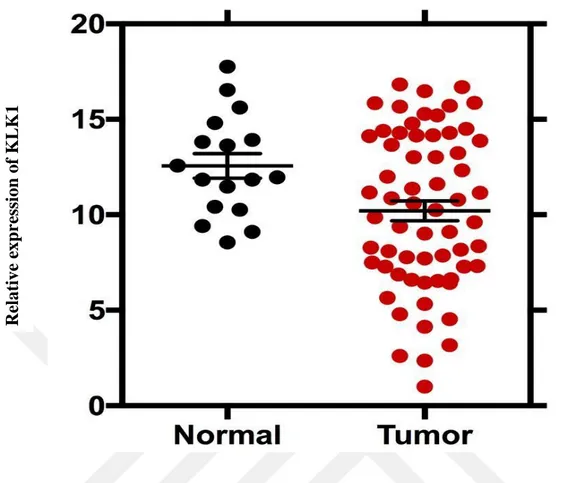
When the recurrent prostate cancer tissues and normal tissues for KLK1 gene were compared, it was determined that the level of expression in recurrent cancer tissues decreased and the p value was 0.03. In normal and non-recurrent cases, expression level in non-recurrent cancer tissue was decreased and p value was 0.03. In comparison with normal tissue and tumor (R + NR) tissue, decreased expression level in tumor tissues was observed and p value was 0.02. (Figure 6-7)
33 Figure 6. KLK1 gene expression levels. The expression levels of KLK1 gene are shown in normal, non-recurrent and recurrent prostate cancer patients. Non-recurrent and recurrent cancer patients have similar expression levels.
Re lative e xp re ssi on of KLK 1
34
Figure 7. KLK1 gene expression levels in normal and tumor tissues. KLK1 Gene expression levels of prostate cancer is relatively lower than in normal tissues.
In comparison to recurrent prostate cancer tissues and normal tissues, the KLK2 expression level of the recurrent tumor tissues was down-regulated and the p value was 0.02. There was no significant difference in expression levels between normal and non-recurrent tissues. Also, we could not determine a remarkable difference in normal tissues and tumor (R + NR) tissues gene expression levels.
Re lative e xp re ssi on of KLK 1
35 Figure 8. KLK2 gene expression levels. The expression levels of KLK2 gene are shown in normal, non-recurrent and recurrent prostate cancer patients. While normal and non-recurrent cancer patients have similar expression levels, recurrent cancer patients have lower expression levels.
Re lative e xp re ssi on of KLK 2
36 Figure 9. KLK2 gene expression levels in normal and tumor tissues. KLK2 Gene expression levels of prostate cancer is relatively lower than in normal tissues.
It was determined that comparing the recurrent prostate cancer tissues and normal tissues for the KLK3 gene, the level of gene expression in the recurrent tissues increased and the p value was 0.01. In comparison to non-recurrent prostate cancer tissues and normal tissues, KLK3 is overexpressed in non-recurrent cancer tissues and p value was determined to be 0.02. When compared with normal tissues and tumor (R + NR) tissues, increased expression level was observed in tumor tissues with a p value of 0.01. Re lative e xp re ssi on of KLK 2
37
Figure 10. KLK3 gene expression levels. The expression levels of KLK3 gene are shown in normal, non-recurrent and recurrent prostate cancer patients. Recurrent cancer patients have higher expression levels than in non-recurrent and normal tissues, respectively.
Figure 11. KLK3 gene expression levels in normal and tumor tissues. KLK3 gene expression levels of prostate cancer is higher than in normal tissues.
Re lative e xp re ssi on of KLK 3 Re lative e xp re ssi on of KLK 3
38 When the recurrent prostate cancer tissues and normal tissues for the KLK-4 gene were compared, the level of expression increased in recurrent tissues and the p value was 0.003. In comparison to normal and non-recurrent cancer tissues, the KLK4 was overexpressed in non-recurrent tissues and p value was determined to be 0.02. Up-regulated expression levels were observed in tumor tissues (R + NR) compared to normal tissues, and the p value was 0.004.
Figure 12. KLK4 gene expression levels. The expression levels of KLK4 gene are shown in normal, non-recurrent and recurrent prostate cancer patients. Recurrent cancer patients have higher expression levels than in non-recurrent and normal tissues, respectively. Re lative e xp re ssi on of KLK 4
39 Figure 13. KLK4 gene expression levels in normal and tumor tissues. KLK4 gene expression levels of prostate cancer is higher than in normal tissues.
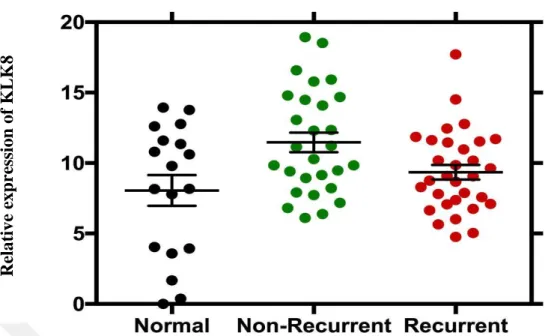
There was no significant change in KLK8 gene expression level in recurrent tissues compared to normal prostate cancer tissues, and the p value was 0.2. In comparison to normal and recurrent cancer tissues, the level of expression in non-recurrent cancer tissues increased and the p value was found 0.008. In tumor tissues (R+NR), KLK8 was overexpressed compared to normal tissues, and the p value was 0.02. Re lative e xp re ssi on of KLK 4
40 Figure 14. KLK8 gene expression levels. The expression levels of KLK8 gene are shown in normal, non-recurrent and recurrent prostate cancer patients. Non-recurrent cancer patients have tha highest expression levels compare to recurrent cancer patients.
Figure 15. KLK8 gene expression levels in normal and tumor tissues. KLK8 gene expression levels of prostate cancer is higher than in normal tissues.
Re lative e xp re ssi on of KLK 8 Re lative e xp re ssi on of KLK 8
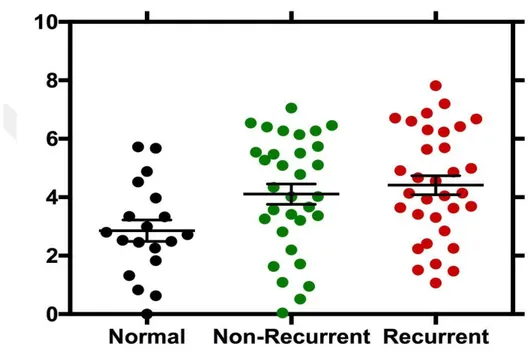
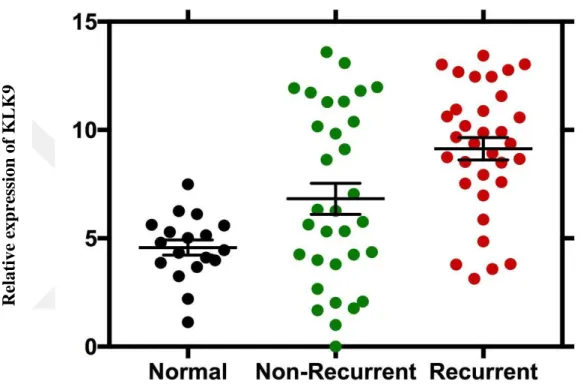
41 It was determined that the level of KLK9 gene was overexpressed in recurrent cancer tissues comparing to normal tissues, and the value of p was 0.006. When compared with normal and recurrent tissues, the level of expression in non-recurrent tissues increased and p value was found to be 0.02. There was a substantial increase in expression level in tumor tissues (R + NR) compared with normal tissues, and p value was 0.0002.
Figure 16. KLK9 gene expression levels. . The expression levels of KLK9 gene are shown in normal, non-recurrent and recurrent prostate cancer patients. Recurrent cancer patients have higher expression levels than in non-recurrent and normal tissues, respectively. Re lative e xp re ssi on of KLK 9
42 Figure 17. KLK9 gene expression levels in normal and tumor tissues. KLK9 gene expression levels of prostate cancer is significantly higher than in normal tissues.
Re lative e xp re ssi on of KLK 9
43
7. DISCUSSION
The samples we used in our study were taken from a wide range of patients and the effects of the Kallikrein gene family on prostate cancer were evaluated by determining their expression levels. Prostate cancer is the most frequently encountered cancer in men after lung cancer (Rees, et al. 2014). It often progresses very gradually and may not cause serious harm. However more aggressive types can spread quickly without treatment. Additionally, there is a risk of recurrence of the prostate cancer after chemotherapy, radiotherapy or surgical intervention. The genetic changes that causes to the development and clinical progression of prostate cancer are poorly identified. It is also limited to research genetic alterations on the onset stage of cancer tissues due to the small number of tumor cells (Wallis and Nam 2015).
Prostate-specific antigen, or PSA, is a protein produced by normal, as well as malignant, cells of the prostate gland. The PSA level in blood is often elevated in men with prostate cancer. However, a number of benign conditions can also cause a man’s PSA level to rise. The most frequent benign prostate conditions that cause an elevation in PSA level are prostatitis (inflammation of the prostate) and benign prostatic hyperplasia (BPH) (enlargement of the prostate). The PSA test can also miss prostate cancer (Gaudreau, et al. 2016).
It has recently been reported that to improve cancer prediction in biopsies, using the Prostate Cancer Gene 3 (PCA3) parameter yields significant results (Aubin, et al. 2010). This parameter is more valuable than free PSA (Haese, et al. 2008). Cancer can be detected in 50% of cases with a PCA3 score of 100 (Marks, et al. 2007) and PCA3 may reduce unnecessary biopsies by 44% (Aubin, et al. 2010). In another study, it was stated that unnecessary biopsy was reduced by 67%, whereas 9-21% could miss high-grade tumors. In a related study, it was reported that the PCA3 rise significantly increased the rates of re-biopsy cancer detection, especially if HGPIN was present (Remzi, et al. 2010).
Among the serine proteases, KLKs form a family of 15 trypsin- and chymotrypsin-like proteases (Borgoño and Diamandis 2004; Lawrence, et al. 2010). Protease activity is controlled by several mechanisms, including regulation of gene expression, activation of their inactive pro-forms (zymogens) either autocatalytically or
44 by other proteases, inhibition of their activity by endogenous protease inhibitors, and phosphorylation (Turk, et al. 2012). Thus, kallikrein-related peptidase (KLK) family members are prospective targets for treatment of prostate cancer (Sotiropoulou and Pampalakis 2012).
In humans, the kallikrein gene family was known to include only three members: the gene encoding pancreatic/renal kallikrein (KLK1), the gene encoding kallikrein 2 (KLK2) and the gene encoding prostate-specific antigen (PSA; KLK3) (Riegman, et al. 1992). It is reported that all 15 KLKs are expressed in the prostate at the mRNA level (Shaw and Diamandis 2007). However, the PSA and some of the KLK gene family members may enhance the growth of prostate cancer by stimulating cell proliferation (Williams, et al. 2011).
In our study, the expression profile of 6 genes (KLK1, KLK2, KLK3, KLK4, KLK8, KLK9) that related to prostate cancer tissues were characterized.
KLK1 is underexpressed in recurrent and non-recurrent prostate cancer tissues compare to normal prostate tissues. This is in contrast to findings by Mingxin (Zuo, et al. 2016) of KLK1 expression in the GBC (gallbladder cancer), especially in female GBC patients.
There are potent indications that the KLK2, KLK3 and KLK4 genes are expressed in various tissues, such as breast and prostate (Yousef and Diamandis 1999).
The KLK2 protein product, human kallikrein 2 (hK2) is emerging as an additional prostatic tumor marker. hK2 is responsible for the activation of PSA by cleaving its pro-form to the enzymatically active mature form (Kumar, et al. 1997). The cancer risk is also correlated with lower hK2 and higher %fPSA, both of which are associated with lower tPSA (Klein, et al. 2010). In related to prior study, KLK2 is underexpressed in recurrent prostate cancer tissues in comparison to normal tissues in our case.
PSA (KLK3) is one of the family members of human tissue kallikreins that play vital role in both normal biology and tumor development and progression (Yousef and Diamandis 2001).
KLK3 is overexpressed in recurrent and non-recurrent prostatic cancer tissues in our experiments.
45 In our study, KLK4 is found to be overexpressed in recurrent and non-recurrent prostate cancer tissues. Similarly, in another experiment, KLK4 was found to be expressed significantly in a subset of ovarian cancer tissue extracts in the ratio of 55%. Severe positive association was found between KLK4 expression and tumor grade (P =0.02) and clinical stage (P < 0.001) (Obiezu, et al. 2001).
KLK5 is overexpressed in ovarian cancer tissues (Diamandis and Yousef 2001). In another study a significant decrease is found in KLK5 expression levels in prostate cancer tissues, compared to their normal counterparts (Yousef, et al. 2002)
KLK6 is previously shown as a biomarker for ovarian carcinoma (Diamandis, et al. 2003) and also shown to be overexpressed in colorectal (Ogawa, et al. 2005) and gastric cancers (Nagahara, et al. 2005).
KLK7 mRNA was significantly lowered in either stage I or stage II breast cancer patients and higher level of KLK7 mRNA was found to be associated with better prognosis (Holzscheiter, et al. 2006; Talieri, et al. 2004). KLK7 (stratum corneum chymotryptic enzyme, HSCCE) has been shown to be expressed at abnormally high levels in ovarian cancer (Ogawa, et al. 2005).
KLK8 is upregulated in both recurrent and non-recurrent prostate cancer tissues. Interestingly, KLK8 is expressed lower in recurrent prostate cancer compared to non-recurrent cancer. The patients who have non-recurrent prostate cancer, might have a loss of KLK8 gene sequences or are affected by other factors.
In ovarian tumors, the expression of the KLK8 gene and its spliced variants indicated that the new variants were expressed very frequently. This full-length KLK8 expression is an independent and favorable prognostic marker for ovarian cancer (Magklara, et al. 2001).
KLK9 is upregulated in recurrent and non-recurrent prostate cancer tissues in our case. Furthermore, KLK9 expression is significantly higher in breast cancer patients with early stages compared with advanced stages (p = 0.039) and in patients with tumor size <2 cm compared with larger tumors (p = 0.028) (Yousef, et al. 2003). It is also reported for the first time that higher KLK9 expression has favorable prognostic value in ovarian cancer (Yousef, et al. 2001).
46 KLK11 is expressed in several human tissues. The highest levels of KLK11 were found in the prostate, followed by stomach, trachea, skin, and colon (Diamandis, et al. 2002).
It is provided that the expression of KLK13, recently identified family members of kallikreins, is significantly up-regulated in metastatic lung adenocarcinoma. While overexpression of KLK13 resulted in an increase in malignant cell behavior, knockdown of its endogenous gene expression caused a significant decrease in cell migratory and invasive properties. Functional studies further demonstrated that KLK13 is activated via demethylation of its upstream region (Chou, et al. 2011).
7 genes (KLK5-8, KLK10, KLK11, and KLK14) were analyzed in another study and they were found to be up-regulated in ovarian cancer tissues and cell lines, compared with normal ovary (Yousef, et al. 2003).
KLK12, KLK13 and KLK14 genes are downregulated in breast cancer (Diamandis and Yousef 2001).
Although KLK15 was found to be overexpressed in more aggressive forms of prostate cancer tissues in other studies, we did not determine a significant result in our case (Stephan, et al. 2003).
While, KLK1 and KLK2 genes (only in recurrent prostate cancer tissues) are down-regulated in prostatic cancer tissues, other genes (KLK3, KLK4, KLK8, KLK9) are found to be overexpressed in both recurrent and non-recurrent prostate cancer tissues in our experiment.
We could not determine a significant expression results in other KLK genes, such as KLK5, KLK6, KLK7, KLK10, KLK11, KLK12, KLK13, KLK14, KLK15.
Gene fusion and chromosomal rearrangements were previously thought to be primarily the oncogenic mechanism of hematological malignancies and sarcomas.
We suggest that the functions of KLKs include either promoting or inhibiting tumor growth and/or metastasis by regulated gene expression. In recent studies, majority of prostate cancers have affected by recurrent gene fusions which have important clinical and biological implications in the study of common epithelial tumors (Kumar-Sinha, et al. 2008). Polymorphisms, gene fusions and mutations could affect
47 the higher or lower expression levels on both non-recurrent and recurrent prostate cancers.
48
8. CONCLUSION
In conclusion, the difference in expression levels of the KLK gene family in recurrent prostate cancer has been shown for the first time by us in the literature.
For the further studies, these genes have the potential to be the prognostic marker genes for progression of the prostate cancer. It should be aimed to identify novel therapies to affect the expression levels of KLK genes.
New immonuassays are developed for new kallikrein proteins to diagnose other cancers (ovarian) and other diseases (Alzheimer’s) (Obiezu, et al. 2001). It should also be aimed to diagnose prostate cancer at early stages by detecting kallikrein proteins with newly developed immunoassay kits.