SUMMARY
COMPARISON OF THE AUTOMATED AND NON-AUTOMATED METHODS IN GSM FOR CELLULAR NETWORK MANAGEMENT
Kaçan, Baycan
Master of Science,The Information Technologies Thesis Supervisor: Asst. Prof.Dr. Adem Karahoca
August 2007
Along developement processes in GSM Networks we have seen that some management problems have come out with this progress.It can be summarized as high resource consumption and performance degradation.Reliability and Performance comparisons of Automatic Management systems and Non-automatic Managements systems in the role of GSM Network Management Systems are focused in this study. Taking time to manage and resource consumption into reference, thread based(alarm) management is investigated.
ÖZET
GSM İÇİN HÜCRESEL AĞ YÖNETİMİNDE
OTOMATİK VE OTOMATİK OLMAYAN YÖNTEMLERİN KARŞILAŞTIRILMASI
Kaçan, Baycan
Yüksek Lisans, Bilgi Teknolojileri Bölümü Tez Yöneticisi: Asst. Prof.Dr. Adem Karahoca
Ağustos 2007
Telekomünikasyon sistemlerinin gelişimi ile birlikte ortaya çıkan GSM şebekeleri ve bunların yönetim sorunları, ciddi anlamda kaynak tüketimine ve performans problemlerine sebep olmaktadırlar. Bu çalışmada GSM şebekelerinin yönetiminde kullanılan otomatik yöntemler ile otomatik olmayan yöntemler arasındaki etkinlik ve verimlilik faktörleri ele alınmaktadır. Süre ve kaynak tüketimi baz alınarak, GSM şebeke yönetiminde otomatik yazılım sistemlerinin alarm tabanlı etkinlikleri incelenmiştir.
TABLE OF CONTENTS
LIST OF TABLES __________________________________________________ vi LIST OF FIGURES _________________________________________________ vii LIST OF FORMULAS ______________________________________________ viii 1 INTRODUCTION __________________________________________________ 1 2 METHODS _______________________________________________________ 4 2.1 Manual Method ____________________________________________________ 4 2.2 Automatic Gsm Management Method __________________________________ 5 2.2.1 Alarm Collection _________________________________________________ 7 2.2.2 Alarm Presentation ________________________________________________ 8 2.2.3 Map Notification _________________________________________________ 8 2.2.4 Alarm Correlation on Clearance______________________________________ 9 2.2.5 Alarm Aggregation_______________________________________________ 10 2.2.6 Alarm Escalation ________________________________________________ 14 2.2.7 Operation Context States__________________________________________ 15 2.2.8 Alarm Object States ______________________________________________ 17 2.2.9 Alarm Object Problem Status ______________________________________ 17 2.2.10 Alarm Archiving and Purging _____________________________________ 17 2.2.11 AGM Process Architecture________________________________________ 19 2.2.12 Introducing the Discriminator Construct (DC)_________________________ 22 2.2.13 Operation Context Attributes ______________________________________ 23 2.2.14 Starting and Stopping Alarm Collection _____________________________ 23 2.2.15Modifying the Operation Context Characteristics ______________________ 24 2.2.16 Processing Error Alarm Event Arguments ____________________________ 24 2.2.17 Quality Of Service Alarm Event Arguments __________________________ 24 2.2.18 Alarm Managing________________________________________________ 24 2.2.19 Alarm Object Attributes _________________________________________ 25
3 TEST RESULTS _________________________________________________ 27 4 CONCLUSIONS _________________________________________________ 53
LIST OF TABLES
Table 2.1 : Alarm aggregation case...10
Table 2.2 : Characteristic attributes for the alarm objects...25
Table 2.3 : Alarm object status attributes attribute...26
Table 2.4 : Alarm object counter attributes attribute...27
Table 2.5 : Alarm object identifier attribute...28
Table 3.1 : Alarm filtering results with agm………...31
Table 3.2 : Minimum, maximum and average process times for problem definition………..32
Table 3.3 : Problem definition process times……….………...33
Table 3.4 : Minimum, maximum and average process times for problem solving...33
Table 3.5 : Problem solving process times ……….………..34
Table 3.6 : Total process times ………..………34
Table 3.7 : Sum of survey results for automatic and manual method..………..40
Table 3.8 : Interpretation of size of correlation………..41
Table 3.9 : Variance analysis results ……….……….…..42
Table 3.10 : Sum of survey results for agm and semi-auto method…….…………..45
Table 3.11 : Interpretation of size of correlation ……….………..47
Table 3.12 : Pairwise t-test and variance analysis results………...48
Table 4.1 : Human resources.on all regions...50
LIST OF FIGURES
Figure 2.1 Alarm Object State Diagram………...6
Figure 2.2 Alarm Object Problem Status Diagram………...6
Figure 2.3 Alarm Handling Process Architecture..………...7
Figure 2.4 Distributed Alarm Handling………....………...22
Figure 3.1 Received active alarm messages detail ….………...30
Figure 3.2 Received active alarm message properties………...32
Figure 3.3 Problem Definition Process Times for Manual and Agm Methods ……...34
Figure 3.4 Problem Solving Process Times for Manual and Agm Methods.. ...35
Figure 3.5 Total Average Process Times for Manual and Agm Methods.. ...35
Figure 3.6 Total System usage while doing Alarm processing for Manual Method……37
Figure 3.7 Total System usage while doing Alarm processing for Agm Method…….…38
LIST OF FORMULAS
Formula 3.1 : Correlation Analysis Formula..………...41
Formula 3.2 : Variance Analysis Formula………..………...43
Formula 3.3 : Variance Analysis Formula………..………...44
1. INTRODUCTION
Nowadays, mobile technologies get more and more involved in our lives from the reason of the use of mobile communication and tools increasingly. For the last decade, both in Turkey and in the world, there is a rapid transition to mobile technologies. When we consider the process of voice communication, messaging and accessing internet via GPRS, we see that mobile technologies have become an integral part of our lives. The quality and the accessibility of the service provided by the operators have become the most significant factor in this hard competition atmosphere.
The systems that we are going to mention in this thesis, suggest some methods regarding how the accessibility of the mobile services can be increased and how the quality of service can be improved. For example, in a very crowded district, lack of access for mobile communication will directly not only cause to lose money but also will lead to a negative concern regarding the image of the related operator.
As mobile coverage area expands, the management of the services mentioned above gets considerably harder. In order to achieve a particular level of quality, the thing to do is to invest but particularly in human resources. However, this case originates a serious cost in competition atmosphere.
During the last years, due to the rapid development of information technologies, solutions are offered in respect of mobile technologies just like as done in many other industries. The costs mentioned above ensure a cost return that is quite good, by allowing transition to automation with the help of information technologies.
Nowadays, the number of methods for reducing the mentioned costs is limited. The oldest methodologies operations are entirely based on technical staff which will called as the manual method (MM) in this document. The automatic GSM Management systems are the powerful alternatives than the manual method which these methods have been improved by using integrated information technologies based solutions. The details of the methods are considered in the next section.
During the early 1980s, analog cellular telephone systems were experiencing rapid growth in Europe, particularly in Scandinavia and the United Kingdom, but also in France and Germany. Each country developed its own system, which was incompatible with everyone else's in equipment and operation. This was an undesirable situation, because not only was the mobile equipment limited to operation within national boundaries, which in a unified Europe were increasingly unimportant, but there was a very limited market for each type of equipment, so economies of scale, and the subsequent savings, could not be realized. The Europeans realized this early on, and in 1982 the Conference of European Posts and Telegraphs (CEPT) formed a study group called the Groupe Spécial Mobile (GSM) to study and develop an European public land mobile system. The proposed system had to meet certain criteria:
1) Good subjective speech quality, 2) Low terminal and service cost, 3) Support for international roaming, 4) Ability to support handhald terminals,
5) Support for range of new services and facilities, 6) Spectral efficiency and ISDN compatibility.
In 1989, GSM responsibility was transferred to the European Telecommunication Standards Institute (ETSI), and phase I of the GSM specifications were published in 1990. Commercial service was started in mid 1991, and by 1993 there were 36 GSM networks in 22 countries, with 25 additional countries having already selected or considering GSM. This is not only a European standard - South Africa, Australia, and many Middle and Far East countries have chosen GSM. By the beginning of 1994, there were 1.3 million subscribers worldwide. The acronym GSM now stands for Global System for Mobile telecommunications.
The developers of GSM chose an unproven digital system, as opposed to the then standard analog cellular systems like AMPS in the United States and TACS in the United Kingdom.
They had faith that advancements in compression algorithms and digital signal processors would allow the fulfillment of the original criteria and the continual improvement of the system in terms of quality and cost. GSM recommendations try to allow flexibility and competitive innovation among suppliers, but provide enough guidelines to guarantee the proper interworking between the components of the system.
2. METHODS
Ensuring the transmission of voice or data of a given quality over the radio link is only half the problem in a cellular mobile network. The fact that the geographical area covered by the network is divided into cells necessitates the implementation of a handover mechanism. Also, the fact that the mobile can roam nationally and internationally in GSM requires that registration, authentication, location updating and alarm management exist in the GSM network.
The network management in GSM is structured in three layers.
1) Radio Resources Management : Controls the setup, maintenance, and termination of radio channels
2) Mobility Management: Manages the location updating, handovers, and registration procedures, discussed below
3) Connection Management: Handles general alarm management and provides connection services.
The management of the GSM network should be evaluated based on the data provided by the central stations. The data include the user signaling traffic levels, network configuration verification,resource access measurements, quality of service, and so on.
The Gsm network management task lists: 1) Detect an alarm burst
2) Correlate the alarms
3) Diagnose the triggering fault 4) Delete the now obsolete alarms 5) Adapt to network topology changes
6) Gain and maintain the necessary correlation knowledge.
2.1 MANUAL METHOD
In order to check the working status of the related GSM equipment, teams must be positioned at the location where the equipment operates. These teams work in shifts and
continuously perform checks on their systems for 24 hours. These checks can not be real time and whenever an interruption occurs it is recognized with a certain delay. In the cases when human resource is not adequate, the problems are either recognized with the help of the checks that are performed too late or due to the complaints of the customers. The main result of this is the fact that the company experiences a serious loss both in respect of money and prestige.
2.2 AUTOMATIC GSM MANAGEMENT METHOD
AGM Alarm Handling is based on Operation Contexts (OCs) and Alarm Objects (AOs). Operation contexts control the way that alarm collection is carried out; alarm objects enable the user to handle and manipulate alarm information through the AGM management interface.
To properly understand how to use AGM Alarm Handling it is essential that you fully understand the concept of the operation context. AGM method introduction provides this information.
AGM will carry out its alarm collection function according to how it is configured for your particular fault management requirements. As a user of AGM Alarm Handling you will therefore need to know how to:
1) Set up the alarm handling environment 2) Create and define operation contexts
3) Set the discriminator construct and scheduling package according to your fault management requirements.
4) Control alarm collection.
5) Suspend and Resume alarm collection by the operation contexts 6) Control the alarm collection behavior of the operation contexts. 7) Handle the alarms.
9) Change alarm object states through operations such as acknowledgement, termination, archiving,etc.
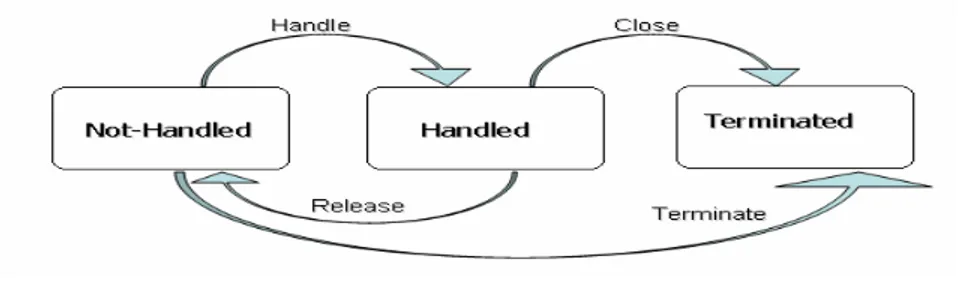
Figure 2.2 shows the state transition diagram for an alarm object.
Figure 2.1: Alarm Object State Diagram (Hp Information Systems 2004, pp.114)
An alarm object therefore has a defined set of Problem Status values in its life-cycle, as illustrated in Figure 2.3.
Figure 2.2: Alarm Object Problem Status Diagram (Hp Information Systems 2004, pp.115) An alarm represents a problem regarding some aspect of network behavior that can be investigated and dealt with by maintenance personel. As intervention proceeds, the status of the problem changes.
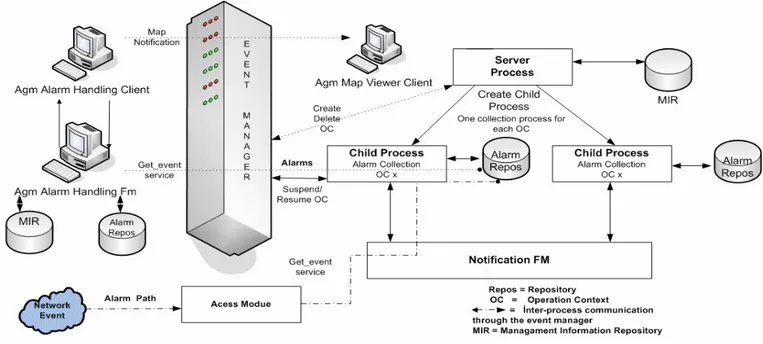
Figure 2.3: Alarm Handling Process Architecture (Hp Information Systems 2004, pp.117)
2.2.1 Alarm Collection
Alarm collection is controlled by the operation context according to how you define the Discriminator Construct and scheduling attributes of the OC. But to be able to carry out alarm collection, two other OC attributes must have the correct values. These attributes are the:
1) The Operational State, which must be Enabled 2) The Administrative State, which must be Unlocked
When these attributes have the correct values, and the scheduling attribute indicates an active period, alarm collection will gather the alarms that are filtered through by the Discriminator Construct.
Once started, alarm collection is only stopped if the Operational State changes to disabled due to a malfunction, if you change the Administrative State to locked by using the suspend directive, or when scheduling indicates an inactive period for alarm collection.
Alarm collection is a background process and does not rely on any AGM user being logged on to the system. When you enable the alarm handling function through the AGM alarm handling
client application, you simply enable the display of alarms to the Alarm Handling windows, this has no affect on the alarm monitoring and collection mechanism.
When you log on to the system and initiate alarm handling, all unacknowledged alarms, including those that have accumulated since your last login, are displayed in the alarm handling main window. (Hp Information Systems 2004)
2.2.2 Alarm Presentation
Alarm Presentation refers to the display of alarm information on the screen by the AGM Alarm handling client.
There are two types of alarm presentation, real-time and static. 1) Real-Time Alarm Presentation
The real-time presentation of alarm information takes place in the not-closed alarms window. This window is continuously updated from the alarm logging mechanism to show all alarms that are in the not-closed state.
When you perform an action on an alarm displayed in the window, such as Acknowledge, Handle or Terminate, the alarm status is no longer not nandled and the alarm may be removed from the alarm handling window.
2) Static Alarm Presentation
Alarm information which is retrieved from the repository by means of the alarms viewer window. This window provides a static display of the requested alarm information, it is not updated in real-time. Alarms in any state may be displayed in the alarms viewer window and for some alarms the state could change in the repository while you are viewing the static display. (Fares A. 2003)
2.2.3 Map Notification
Map notification refers to the indication of alarm conditions by the AGM map viewer client. Map notification changes the color of the icon (that is, the icon that represents the network element under management from which the alarm was detected). The color of the icon depends on the alarm severity. Incoming alarms may also cause the icon to oscillate or blink to attract the attention of the operator.
2.2.4 Alarm Correlation on Clearance
An alarm with a severity level of clear indicates that a problem which previously generated an alarm no longer exists. When the alarm handling fault manager detects an alarm report with a severity level of clear, it attempts to correlate it with previously received alarm reports related to the same problem.
The alarm clearance correlation takes place immediately after the discriminator construct evaluation of an incoming alarm.
Note that alarm correlation takes place whether an alarm passes the discriminator construct filter or not. After evaluation, the alarm report is converted into a pseudo-alarm or an alarm object according to whether there are correlated alarms or not. Correlation is applied to all alarms that have not been cleared or archived. A suitable DC filter must be set if you do not want to collect clearance alarms.
When an alarm with the severity clear is received, an alarm object is created provided the alarm passes the current DC filter.
When correlated alarm reports are found, the status of each correlated alarm in the alarm repository is set to cleared.
When no correlated alarms are found for a Clear severity alarm a real alarm is created with a severity of clear. The alarm is converted into an alarm object in the outstanding or not-handled state and is therefore displayed as a normal alarm in both the not-closed alarms and alarms viewer.
AGM uses two functions to correlate previously collected alarms with an alarm received with severity clear. Function one is used if correlated notification is provided in the alarm report, otherwise function two is used.
Function 1: Correlated Notification provided
Using the Source Object or the Managed Object IDs and the list of correlated IDs in the Correlated Notification ID record of the Clear severity alarm.
All alarms that have the same Managed Object ID and a Notification ID corresponding to one in the Clear alarm Notification ID list will be cleared.
Function 2: (Correlated Notification not provided)
1) Using the Managed Object, Probable Cause, Alarm Type and Specific Problems from the clear severity alarm:
a) All alarms that have the same Managed Object, Probable Cause, Alarm Type and specific problems will be cleared.
2) Using the Managed Object, Security Alarm Cause, and Security Alarm Type from the clear severity alarm:
b) All alarms that have the same Managed Object, Security Alarm Cause, and security alarm type will be cleared. (Hp Information Systems 2004)
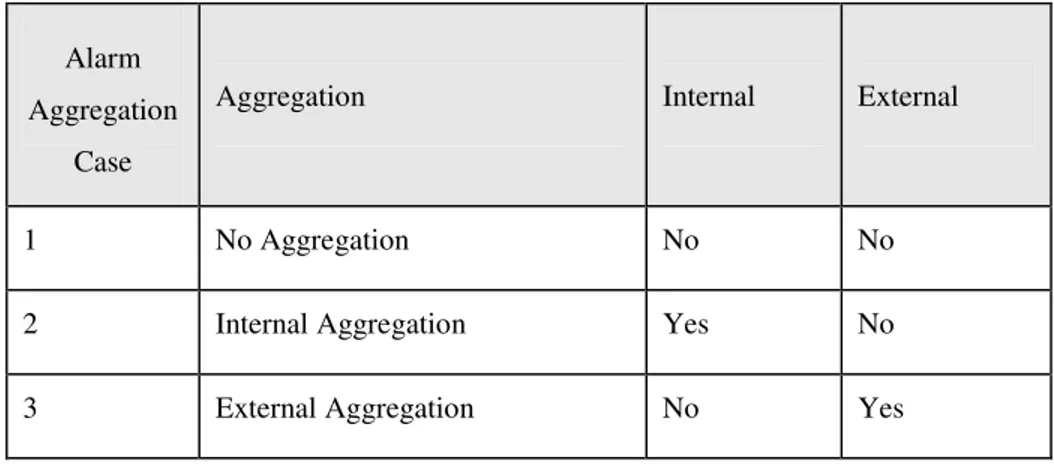
2.2.5 Alarm Aggregation
This part describes how you can control alarm behavior using the AGM alarm Aggregation function. If a network element produces many instances of the same alarm due to a recurring problem, alarm handling may become difficult due to the rate at which alarms are arriving at the user interface. To avoid an operator becoming overstretched, you can configure your AGM system to create similar alarms instead of alarm objects.
This mode of operation is known as alarm aggregation and means that only one alarm object is created and displayed in the not-closed Alarms window, and that subsequent similar alarms are created and stored as child entities of the original alarm object. This reduces the number of alarm objects displayed in the not-closed Alarms window, without loss of alarm data.
Table 2.1: The implementation of alarm Aggregation (Fares A. 2003, pp.245)
Alarm Aggregation
Case
Aggregation Internal External
1 No Aggregation No No
2 Internal Aggregation Yes No
Internal alarm aggregation is controlled by an operation context according to how the attribute aggregation Mode is set automatic or non-Automatic. The aggregation behavior can be controlled to suit the user’s needs by setting the similarity mode, severity propagation mode and reduction scope attributes. The similar alarms can be displayed in a separate similar alarms view window. Once the attributes are set, alarm aggregation proceeds automatically and no intervention is required from the operator.
In addition, alarms can be reduced externally by calling specific alarm handling fm directives from an application developed by you. External alarm aggregation can use both alarm association and alarm aggregation functions as follows:
Specific alarm object attributes are defined to associate alarm objects according to rules defined by you. Alarm association is a method that groups together alarms that have specific characteristics in common. Alarm association could be based, for example, on alarms concerning a given managed object, or on all alarms concerning a given managed object that have the same user text attribute. Grouping alarms together in this way makes them easier to handle. alarm association can be used together with alarm aggregation to control alarm behavior according to your system requirements.
Alarm objects and similar alarm directives are available for you to implement your own alarm aggregation mechanism.
External alarm aggregation allows you to control alarm behavior using an external application developed by you, or by means of another external engine. External alarm aggregation can be based on an alarm association algorithm with subsequent alarm aggregation. The alarm aggregation function creates a single original alarm object when the first of many associated alarm instances are collected by an operation context. Subsequent instances of the associated alarm are reduced to the level of similar alarms and not displayed at the AGM. Data is not lost however, and similar alarms can be displayed in a separate window.
Alarm association techniques can be used in conjunction with alarm aggregation methods to simplify the process of controlling alarms. Once alarms are associated according to specific alarm types, they are easier to group and manage. (Fares A. 2003)
If a network element produces many instances of the same alarm due to a recurring problem, alarm handling may become difficult due to the rate at which alarms are arriving at the user interface. To avoid an operator becoming overstretched, you can configure your AGM system to create similar alarms instead of alarm objects.
Alarm aggregation is controlled by the operation context according to how you set the attribute reduction mode. The aggregation behavior can be controlled to suit the user's needs by setting the similarity mode and severity propagation mode attributes.
An incoming alarm can only be considered as similar to an alarm already collected and applies only to an original alarm, that is, an alarm that is not in the terminated state or in the outstanding state, depending on the reduction scope. The alarm reduction function associates alarms reporting the same problem type, which is defined as follows:
1) Notification ID Provided
2) Alarms are considered as similar if they have the same Managed Object and the same Notification ID.
Alarms are considered as similar if they have the same Managed Object, Probable Cause, Alarm Type and Specific Problem.
When a clearance alarm correlates with an Original Alarm Object, it is added as a Similar Alarm, but the Clearance flag of the Original Alarm Object is set. The Clearance flag is removed, if a new incoming alarm is created as a Similar Alarm of this Original Alarm Object. Several consecutive Clearance alarms can be accumulated for the same Original Alarm Object, but only the first one will set the Original Alarm Clearance Timestamp and generate a alarm. Reduction Mode is settable and can be turned on while collection is active, but note that several alarms may have already been collected that are similar. In this case, the following policy is implemented:
1) New incoming alarms may be similar to several original alarms, but similarity will only be considered in relation to the most recent original alarm.
2) If similarity mode is switched from same problem type to same problem type and severity, the same handling is applied and only the most recent original alarm is used. (Jobmann, K. 2001)
2.2.6 Alarm Escalation
Each alarm object created by AGM has a severity level that is allocated by the network element when the alarm is generated. The severity levels are Indeterminate, Critical, Major, Minor, Warning, Clear and are color coded according to the severity.
Escalation means that the severity of an alarm is increased, to draw extra attention to it, if not Acknowledged by the user within a specified time interval. Escalation is a parameter of the operation context that can be set when the operation context is created, or it can be changed later if required. Escalation can be specified individually for the severity levels Critical, Major, Minor, Warning, each with different time intervals after which escalation is triggered.
Escalation causes a new alarm report to be generated for the Unacknowledged alarm with a level of severity one higher. Once an alarm has been escalated it is flagged as such and cannot be escalated a second time.
The escalation alarm when emitted:
1) Has its escalated alarm flag set to False 2) Has its severity level set to n+1
3) Has its managed object field set to operation context
4) If this or another operation context is configured to collect this type of alarm, the escalation alarm is converted into an alarm object and a color change is initiated on the Iconic Map for the operation context concerned.
When an escalated alarm object is correlated with a clear severity alarm, or is Acknowledged or terminated by the user, or when Automatic Acknowledge is active, a clear alarm is generated and the escalation alarm is cleared. When an escalated alarm object is Handled, Acknowledged or Terminated by the user, a clear alarm is generated and the escalation alarm is cleared.
The escalation alarm is also cleared, if the escalated alarm is automatically terminated by a clearance event. (Heine, G. 2002)
2.2.7 Operation Context States
Two status attributes of the operation context determine if alarm collection can be carried out. These attributes are the Operational State and the Administrative State. One provides system control over alarm collection, the other enables alarm collection to be controlled by the user. The composite state status attribute is introduced to reflect the operation context state in terms of service availability. In the first step, only the collection service is taken into account, and consequently the composite state value reflects both the admin state and the oper state values. Conversely, the availability status that qualifies the operation context operational state is not reflected in the composite state.
The operational state is governed by internal conditions within AGM, and determines whether or not the operation context is functionally available. Events which affect the Operational State state are:
1) Internal alarm handling processing failures
2) The operational state of other AGM function modules that provide services for, or are used by, the alarm handling.
The administrative state of the operation context is controlled by the user through directives that are available at the AGM management interface. These directives are:
1) Suspend
which puts the operation context into the Locked state and disables alarm collection. 2) Resume
which puts the operation context into the Unlocked state and enables alarm collection. 3) Delete
which puts the operation context into the transient state of Shutting Down as the delete operation is carried out.
The operation context composite state attribute reflects immediately the health of the instance in terms of collection service availability. The composite state is a kind of color code that eases trouble reporting. The operation context composite state value is computed from the admin state and oper state values.
The availability status is an operation context attribute that provides additional information concerning the operational state. The operational state is dependent on the availability of other modules and services. A situation could arise, where a service that is not essential becomes unavailable, and in this case the operational state could be reduced in effectiveness, but not disabled. In other words, the operational state is qualified according to the availability status of external support
For example: If AGM detects that: 1) An alarm event has been lost
2) A remote director responsible for managing entities in the collection domain has been stopped during collection of an alarm event.
It assumes that a problem has occurred that has reduced the reliability of the event collection mechanism. In this case, the availability status is set to degraded, but the operational state remains unchanged to indicate a possible collection capability of less than 100 percent.
The Availability Status remains degraded until the problem is cleared using the cleanup directive. This resets the Availability Status and its associated status condition explanation.
The Availability Status is a set of enumerated values. Each possible enumerated value is described here:
1) InTest - the Background Child process is recovering.
2) Failed - the Background Child process or one of its threads exited.
3) PowerOff, OffLine - indicates that the collection process has been stopped by use of the AGM.
4) OffDuty - indicates that the Scheduling Package is Off.
5) Dependency indicates that the Operation Context Alarm Collection service is disabled due to an error in AGM, the operating system, or the data store on which it depends.
6) Degraded indicates that the Operation Context Alarm Collection service has been degraded, but the service can continue.
7) LogFull indicates that existing Operation Contexts can be operated on, but that no new Alarm Objects can be created. (Eberspaecher & Vogel 2001)
2.2.8 Alarm Object States
Alarm reports that pass through the filtering mechanisms of an operation context become new alarm objects and are stored in the operation context repository. As an object, the alarm can be managed and acted upon in various ways by the user until the network event that generated the alarm has been investigated and resolved. At this point the alarm object becomes an item of historical data.
An alarm object therefore has a finite life-cycle, and in this cycle the object's state is changed as actions are taken on it. The initial state of a newly created alarm object is outstanding, since at this point no action of any kind has been taken on it. Four alarm state working for alarms. These states; outstanding, acknowlegment, terminated and archived.
2.2.9 Alarm Object Problem Status
An alarm represents a problem regarding some aspect of network behavior that can be investigated and dealt with by maintenance personnel. As intervention proceeds, the status of the problem changes.
At the AGM management interface, the ability to handle an alarm and to associate it with maintenance activity is only possible when the Trouble Ticket System is part of the AGM installation. (Ericsson Mobile Networks 2003)
2.2.10 Alarm Archiving and Purging
The two operation context directives Archive and Purge Alarms allow you to maintain control over the size and content of the operation context alarm repository.
By means of the archive directive you can transfer alarms to an external relational database for whatever offline processing or analysis is required by your fault management procedures.
The availability of database tools, means that you can operate on the database of your choice, on either the local AGM system or a remote system with or without AGM installed. As a general rule, it is recommended that you carry out archiving on a regular basis.
By means of the Purge Alarms directive you can delete from the operation context repository, alarms that have been investigated and are no longer required As a general rule, it is recommended that you always use the archiving function before purging alarms.
Alarm records that are no longer needed can be deleted from the Operation Context repository by means of the Purge Alarms directive.
The Purge Alarms directive deletes all the specified Alarm Objects from the Operation Context repository. Note that if a purged Alarm Object has Similar Alarms associated with it, the Similar Alarms are also deleted.
Alarm object records in a Terminated or Closed state can be exported to an external relational database by means of the archive directive.
1) Database Creation
To be able to use the Archive directive you must first create the database. 2) Performing the Archive
Once started, the archiving operation proceeds in background. It can be stopped by means of the cancel archive directive.
3) Database Cleanup
As the alarm repository fills up, you can use the Purge Alarms directive to reduce the amount of information held in the database. However, when alarms are archived, they are copied to an external SQL and to remove information from this database you will have to use SQL commands. To do this you need to understand the structure of the database tables. (Ericsson Mobile Networks 2003)
2.2.11 AGM Process Architecture
This section gives a brief explanation of the AGM process architecture, to help in the understanding of AGM operation and the use of certain utility programs. There are two categories of AGM process that need to be considered:
1) Foreground Process 2) Background Processes
Alarm and event collection management processes that run under AGM itself. The foreground process handles the directives that a user issues through the management interface. The foreground process communicates with the background processes by way of the AGM.
Background processes provide support for all users of the AGM functions and are further divided into two groups:
1) Server Process
The Alarm Handling has a single server process that handles the creation and deletion of operation context instances. The server process also creates, and performs general management of, the child processes.
2) Child Processes
Child processes are created to handle alarm collection for each operation context. There are as many child processes as there are instances of operation contexts. The child processes also manage the status of the operation contexts with which they are associated. The background processes are common to all AGM users. For example, if the alarm handling background processes are stopped, the alarm handling function is disabled for all users.
In AGM Alarm Handling there are two types of domain that are of interest. These are known as collection domains and visualization domains, each with their own type of hierarchy.
The collection domain hierarchy is associated with an operation context. A collection domain determines the scope of alarm collection, that is, it groups together all the entities from which alarms are to be collected by this operation context. Note the following with respect to collection domains:
1) A collection domain hierarchy may be located on the same director as its associated operation context or on a different director.
2) A collection domain hierarchy should be as flat as possible, avoiding entity duplication. One level is preferable, otherwise multiple notification of alarms may occur. An exception to this could be in a distributed system where you want to manage a subdomain using a remote director. The visualization domain hierarchy determines which maps will be displayed in the AGM. This provides an organization of entities such that alarm handling management is reflected through map notification. Note the following with respect to visualization domains:
1) There is no direct match between collection and visualization domains in AGM.
2) Visualization domains may be located on a different director to the collection domains as long as Entity Access Distribution is used. A collection domain hierarchy can be used for visualization, but then you should avoid entity duplication.
Distributed alarm handling enables you to:
1) Access and monitor operation contexts located on remote nodes.
2) In AGM Alarm Handling, access to remote operation contexts is based exclusively on Entity Access Distribution. This uses the Managing Director attribute, allocated at registration time, to locate the Director on which the operation context exists. This Director is designated as the Managing Director for this entity and is responsible for all call requests and responses to and from it.
3) Distribute alarm collection on different directors by locating the collection domains on one or more directors. Note that a director may be a different director to the one on which the operation context is located.
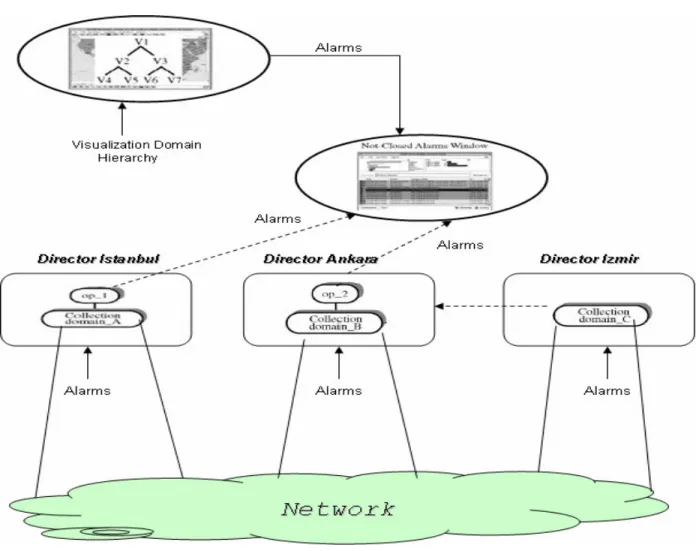
Figure 2.5 shows an example of a simple configuration including distributed operation contexts and collection domains. An operation context op_1 associated with domain_A. These two entities are located on Director Istanbul. An operation context op_2 is associated with collection domain_B, both located on Director Ankara. A collection domain (domain_C), which is a subdomain of domain_B, is located on Director Izmir. Distribution of AGM is used to distribute alarm collection of op_2 on two Directors - Ankara and Izmir, by distributing its associated domain hierarchy (domain_B and domain_C). In this configuration, the distribution of AGM allows you to use a presentation situated on any Director to:
1) Monitor transparently and in real-time, any operation context situated locally or remotely.
2) Monitor transparently and in real-time, any visualization or collection domain, its subdomains and members situated locally or remotely.
3) Access transparently any entity in the distributed system and perform management operations on it.
Distribution of AGM is used to distribute alarm collection of op_2 on two Directors Ankara and Izmir, by distributing its associated domain hierarchy (domain_B and domain_C). (Hp Information Systems 2004)
Figure 2.4: Distributed Alarm Handling (Hp Information Systems, 2004, pp.118)
2.2.12 Introducing the Discriminator Construct
This part describes how to define a Discriminator Construct filter for the filtering of alarm reports, and explains how to set up scheduling times for the automatic running of the alarm handling function. This type of filtering is considered to be high level filtering. Filtering at source or low level filtering can be carried out using Event Filters designed specifically for this purpose. The Discriminator Construct is a filter for OSI alarms and OSI events that you build by defining an arrangement of subfilters to obtain the required selectivity.
In AGM, the Discriminator Construct filter is defined in terms of two different types of subfilter to obtain the selectivity needed:
1) Blocking subfilters
That specify OSI alarms or events which are not to be converted into event record objects. 2) Passing subfilters
That specify OSI alarms or events which will be converted into event record objects.
The discriminator can consist of one or more passing subfilters, one or more blocking subfilters, or a combination of both.
The Scheduling Package enables you to specify periods for the automatic activation and running of Alarm Handling . Scheduling is an attribute that can be:
1) Defined during the creation of a new operation context
2) Changed to another value for an existing operation context by means of the set directive on this entity. (Lin, Lin & Jeng 2001)
2.2.13 Operation Context Attributes
This part describes the management operations you can perform on operation contexts. Management of the alarm handling environment is carried out by means of the operation context directives. By means of the oc directives you can examine the status of the alarm handling environment and modify the way alarm collection is carried out by an operation context. The Operation Context entity contains attributes that apply to the identification and nature of the entity, and events that apply to the internal State transitions that can occur in the entity. (Chang, Lin & Su 2000)
2.2.14 Starting and Stopping Alarm Collection
The collecting of alarms by an operation context is controlled by means of the following directives:
1) Suspend 2) Resume. 3) Suspend
The Suspend directive changes the Administrative State of the selected operation context to Locked. Alarm collection is stopped. However, most of the directives are effective Show, Set, Delete, Purge, Archive. This directive causes a Status Change event to be generated.
The Resume directive changes the Administrative State of the selected operation context to Unlocked. Alarm collection is restarted. This directive causes a Status Change event to be generated.( Wietgrefe 2002)
2.2.15 Modifying the Operation Context Characteristics
You can modify the way an operation context collects alarms by using the set directive to change the values of certain attributes. Note that this operation can be performed when the operation context is in the locked or unlocked Administrative State. Any change in the value of the attributes results in generation of the corresponding Attribute Value Change event.
All attributes are dynamically settable, but only take effect on new incoming alarms. The Alarms and any associated Similar Alarms posted before the set are not re-evaluated. It is recommended that you terminate these alarms before changing the reduction mode. In all cases, a clearance alarm will clear all original or Similar Alarms.
2.2.16 Processing Error Alarm Event Arguments
The processing error alarm event is in the Notification partition. This event is generated when a disk-full condition related to an Operation Context is detected.
2.2.17 Quality Of Service Alarm Event Arguments
The Quality Of Service Alarm event is in the notification partition. This event is generated when an Operation Context is not, or is no longer monitored by a AGM Fault Management Operator designated as a Responsible Operator. The corresponding clearance event is generated when this condition is no longer true.
2.2.18 Alarm Managing
This part explains how you can manage the alarm information. Topics covered are:
1) Alarm Object Attributes 2) Alarm Object Directives
3) Alarm Object Emitted Event Attributes
2.2.19 Alarm Object Attributes
The Alarm Object entity contains attributes that apply to the identification and nature of the entity, and events that apply to the internal state transitions that can occur in the entity. The Alarm Handling attribute partitions supported by the Alarm Object entity are:
1) Identifier Attributes 2) Characteristic Attributes
3) Status Attributes 4) Counter Attributes.
The following tables describe all the Alarm Object attributes.
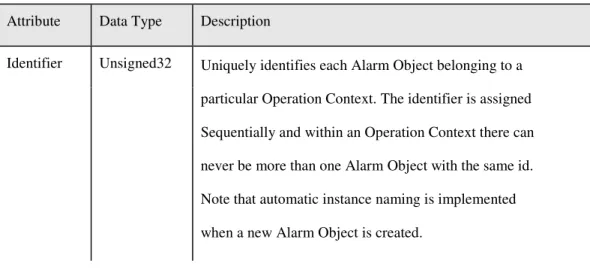
The Identifier Attribute for the Alarm Object entity is shown in Table 2.2. This attribute is not settable.
Table 2.2: Alarm Object Identifier Attribute (Ericsson Mobile Networks 2003, pp.140)
Attribute Data Type Description
Identifier Unsigned32 Uniquely identifies each Alarm Object belonging to a particular Operation Context. The identifier is assigned Sequentially and within an Operation Context there can never be more than one Alarm Object with the same id. Note that automatic instance naming is implemented when a new Alarm Object is created.
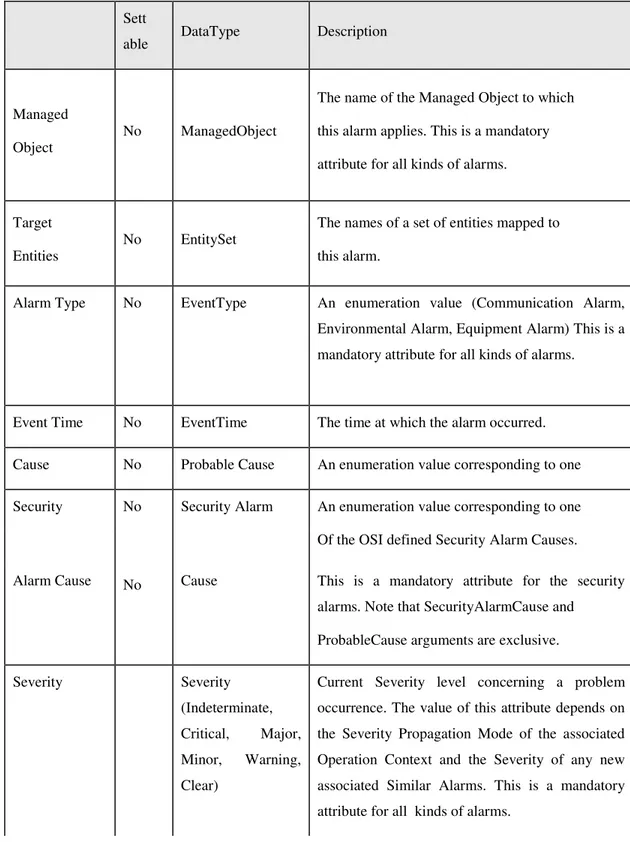
Table 2.3: Characteristic Attributes fort he Alarm Objects (Ericsson Mobile Networks 2003, pp.441)
Sett
able DataType Description
Managed Object
No ManagedObject
The name of the Managed Object to which this alarm applies. This is a mandatory attribute for all kinds of alarms.
Target Entities
No EntitySet
The names of a set of entities mapped to this alarm.
Alarm Type No EventType An enumeration value (Communication Alarm, Environmental Alarm, Equipment Alarm) This is a mandatory attribute for all kinds of alarms.
Event Time No EventTime The time at which the alarm occurred. Cause No Probable Cause An enumeration value corresponding to one Security No Security Alarm An enumeration value corresponding to one Of the OSI defined Security Alarm Causes. Alarm Cause No Cause This is a mandatory attribute for the security
alarms. Note that SecurityAlarmCause and ProbableCause arguments are exclusive.
Severity Severity
(Indeterminate, Critical, Major, Minor, Warning, Clear)
Current Severity level concerning a problem occurrence. The value of this attribute depends on the Severity Propagation Mode of the associated Operation Context and the Severity of any new associated Similar Alarms. This is a mandatory attribute for all kinds of alarms.
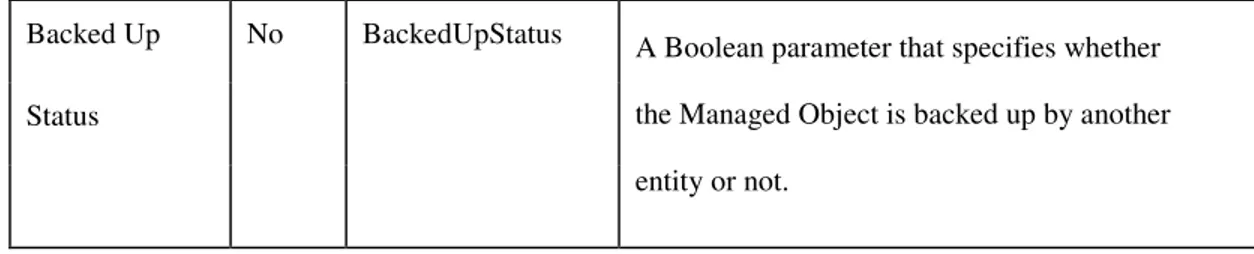
Backed Up No BackedUpStatus Status
A Boolean parameter that specifies whether the Managed Object is backed up by another entity or not.
The Status Attributes for the Alarm Object entity are shown in Table 2.4 (Ghanbari Hughes &
Sinclair 2002)
Table 2.4: Alarm Object Status Attributes Attribute (Ericsson Mobile Networks 2003, pp.443)
Data Type Description Creation
Timestamp BinAbsTim
The time at which the Alarm Object was collected. This is also used as an Alarm Object identifier. Clearance
Time Stamp BinAbsTim
Specifies the event time at which the alarm was cleared. State AlarmObject StateType (Outstanding, Acknowledged, Terminated)
An enumeration that can be changed by the user using action directives.
Previous State AlarmObject StateType (Outstanding, Acknowledged, Terminated)
An enumeration that maintains the state of the Alarm Object, prior to the invocation of the action directives.
Problem Status AlarmObject Problem StatusType (Not_handled, Handled,
An enumeration value that can be changed by the user using ACTION directives from the Trouble Ticket system or another FM .
Escalated Alarm Boolean
When set to true, this Boolean variable indicates that the Alarm Object has been Escalated because it was not Acknowledged within a specified time. Closed By EntitySet Specifies the list of Trouble Tickets for which a
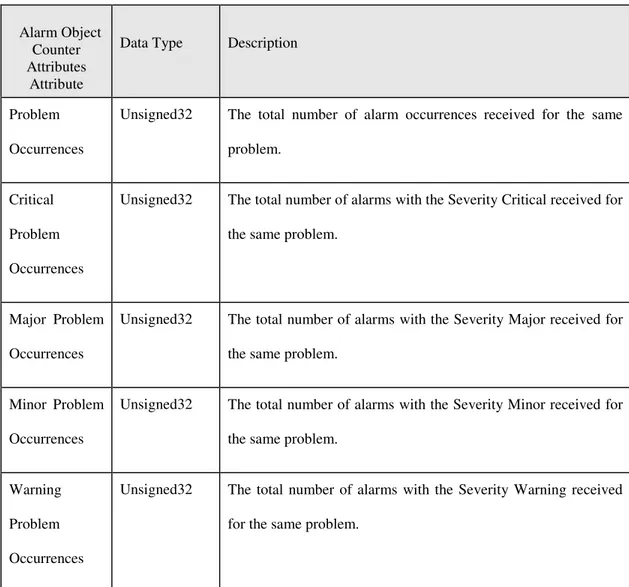
The Counter Attributes for the Alarm Object entity are shown in Table 2.5. These attributes are not settable.
Table 2.5: Alarm Object Counter Attributes Attribute (Ericsson Mobile Networks 2003, pp.444)
Alarm Object Counter Attributes
Attribute
Data Type Description
Problem Occurrences
Unsigned32 The total number of alarm occurrences received for the same problem.
Critical Problem Occurrences
Unsigned32 The total number of alarms with the Severity Critical received for the same problem.
Major Problem Occurrences
Unsigned32 The total number of alarms with the Severity Major received for the same problem.
Minor Problem Occurrences
Unsigned32 The total number of alarms with the Severity Minor received for the same problem.
Warning Problem Occurrences
Unsigned32 The total number of alarms with the Severity Warning received for the same problem.
3. TEST RESULTS
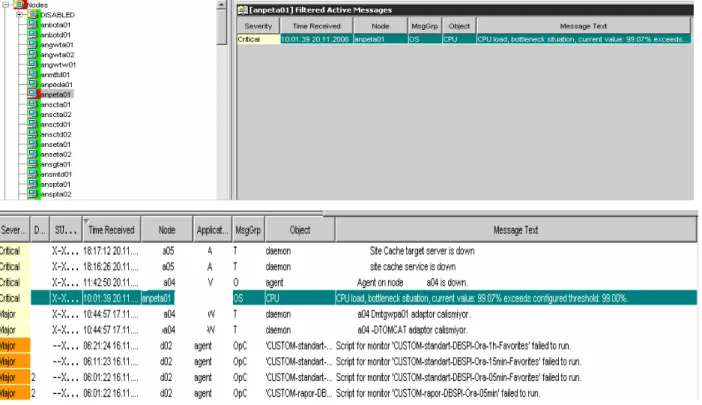
It is shown in Figure 3.1 which refraction of the system the problem subject to the alarm after the alarm filtering, which allows us to examine the alarm details in the AGM system.
It helps to detect the alarm’s severity, the time of composition thereof, the system and the section of system (cpu, memory, disk), which composed the alarm, instantaneously on the system tree by lighting red. The example shows in the details of an alarm composed that a cpu bottleneck was experienced at critical level in one of the central system. The alarm detail enables instantaneous intervention to and solution of the problem.
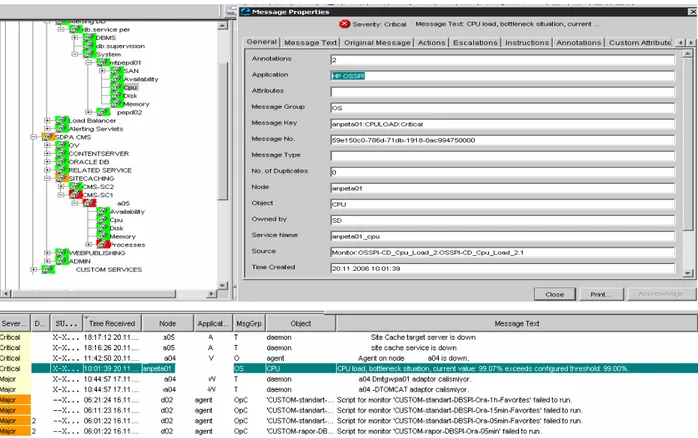
Figure 3.2: Received active alarm message properties (Hp Information Systems 2004, pp.169) You can review the processes performed by the use of Agm Alarm Filtering feature, which is not available in the manual method, and the results thereof within Table 3.1
The alarm filtering, the theoretical aspects of which are described within the thesis content, eliminates the alarms, which are under the warning type received from the centrals and the level of significance of which can be classified by defined rules, before they reach to the Agm system and saves considerable time. The defined rules reduce the traffic of the instantaneous problems (cpu peak, memory leak etc.), which are not of continuous nature and which would not lead to troubles, and enable the detection of significant problems of continuous nature.
Examining a sample system, which employs alarm filtering, it is seen that approximately 35 percent of the alarms received from two different points are eliminated after being subjected to alarm filtering. According to the number of alarms in February, approximately 1,000,000 alarms were ignored and deleted after alarm filtering process. Hence, the alarms, which would lead to real problems, were enabled to be easily detected and considerable time were saved.
Table 3.1: Alarm filtering results using Agm method
Alarm Type Month Total Alarms (Month) Avarage Alarm (Daily)
Oss Central February 858.543 30.662
Oss Central March 1.060.067 34.196
Oss Central April 967.765 32.259
Oss Central May 1.025.987 33.096
Oss Central June 1.036.074 34.536
Oss Central July 1.206.734 38.927
Oss Central Agust 1.237.393 39.916
Oss Central September 1.068.916 35.631
Average 1.057.685 34.903 Transmission February 1.311.950 46.855 Transmission March 2.367.014 76.355 Transmission April 1.534.015 51.134 Transmission May 1.823.492 58.822 Transmission June 2.756.441 91.881 Transmission July 3.395.947 109.547 Transmission Agust 4.443.915 143.352 Transmission September 4.875.942 162.531 Average 2.813.590 92.560
Enterance to Filtering ( Tap+Transient) February 1.063.797 37.993
Enterance to Filtering ( Tap+Transient) March 1.357.279 43.783
Enterance to Filtering ( Tap+Transient) April 1.419.077 47.303
Enterance to Filtering ( Tap+Transient) May 1.776.917 57.320
Enterance to Filtering ( Tap+Transient) June 1.909.890 63.663
Enterance to Filtering ( Tap+Transient) July 2.794.514 90.146
Enterance to Filtering ( Tap+Transient) Agust 2.672.067 86.196
Enterance to Filtering ( Tap+Transient) September 2.774.526 92.484
Average 1.971.008 64.861
3.234.290 Before filtering 2.170.493 After filtering (February)
Summary Table Alarm Type
Avarage Alarm (Montly)
Total Avarage Alarm (Daily)
Oss Central 1.057.685 34.903
Transmission 2.813.590 92.560
Enterance to Filtering ( Tap+Transient) 1.971.008 64.861
Total Average 5.842.283 192.323
The minimum, maximum, average process times are given in tables below for each system interaction and measurement interval. process time measured by the test is the real time elapsed from the point where the a alarm is called, until the results of the process, if any, have been placed into the process variable Table 3.2 shows minimum, maximum and average process times using both manual and agm methods.
You can review the minimum, maximum and average process times spent for the definition of the problems, which are the subjects of the alarms received from the centrals, in Table 3.2.
Such process time is the time between the alarm's reaching to the Agm and the Manual systems and being detected thereof.
Table 3.2: Minimum, Maximum and Average Process Times for Problem Definition
MANUAL AGM Alarms (Number) Minimum (Sec) Maximum (Sec) Average (Sec) Minimum (Sec) Maximum (Sec) Average (Sec) 100 120 320 220 0,0 10 6 500 120 1280 780 0,0 15 10 1000 120 2160 1370 0,0 23 16 5000 120 8640 2330 0,0 30 22 10000 120 17670 3810 0,0 42 36 40000 120 35240 5630 0,0 72 58
In Table 3.3 average response times for problem definition process times between two models in percent is given.
Table 3.3: Problem Definition Process Times
MANUAL AGM Alarms (Number) Average (Sec) Average (Sec) 100 220 6 500 780 10 1000 1370 16 5000 2330 22 10000 3810 36 40000 5630 58
In Table 3.4, Minimum, Maximum and Average Process Times for Problem Solving times between two models in percent is given.
Table 3.4: Minimum, Maximum and Average Process Times for Problem Solving
MANUAL AGM Alarms (Number) Minimum (Sec) Maximum (Sec) Average (Sec) Minimum (Sec) Maximum (Sec) Average (Sec)
100 0,0 177 125 0,0 6 4 500 0,0 710 435 0,0 8 6 1000 0,0 1270 740 0,0 12 9 5000 0,0 4800 2680 0,0 16 12 10000 0,0 9816 4720 0,0 23 19 40000 0,0 20730 12350 0,0 39 28
In Table 3.5, average response times for problem solving process times between two models in percent is given.
Table 3.5 Problem Solving Process Times
MANUAL AGM Alarms (Number) Average (Sec) Average (Sec) 100 125 4 500 435 6 1000 740 9 5000 2680 12 10000 4720 19 40000 12350 28
Table 3.6 shows total process times (sum of problem definition and problem solving) and difference between two models in percent.
Table 3.6: Total Process Times
Alarms (Number) MANUAL (Sec) AGM (Sec) 100 345 10 500 1215 16 1000 2110 25 5000 5010 34 10000 8530 55
In Figures 3.3 shows the graphs of the problem definition average process times for both methods 0 1000 2000 3000 4000 5000 6000 100 500 1000 5000 10000 40000 Ala rms P ro c e s s T im e s ( s e c o n d s ) MANUAL AGM Problem Definition Average Process Times
Figure 3.3: Problem Definition Process Times for Manual and Agm Methods
In Figures 3.4 shows the graphs of the problem solve average process times for both methods.
0 2000 4000 6000 8000 10000 12000 14000 100 500 1000 5000 10000 40000 MA NUA L A GM Proble m Solve Ave r age Pr oce s s Tim e s
P ro c e s s T im e s ( s e c o n d s ) Alar m s
Figure 3.4: Problem Solving Process Times for Manual and Agm Methods
0 2000 4000 6000 8000 10000 12000 14000 16000 18000 20000 100 500 1000 5000 10000 40000 MA NUA L A GM
Total Ave rage Proce s s Tim e s
P ro c e s s T im e s ( s e c o n d s ) Alarm s
Figure 3.5: Total Average Process Times for Manual and Agm Methods
In Figure 3.5 on the other hand, the impact of the two methods on the performance on the basis of total process times is compared. As per the figure; the tests conducted suggest that receipt of 100 alarms and of 40,000 alarms does not considerable cause differences in process times for AGM, and responses are cycled within approximately 1 minute maximum. However, the response times for manual method, as shown, reach up to 17,000 seconds. Therefore, the memory and the cpu, the system sources, lose their capacity to give responses and get considerably slower. No busy – wait process is necessary since the Agm system groups the received alarms as small packages, make up queues and process them in a parallel manner by activating all cpus. However, the manual method, due to single – point sending, causes the cpu and the memory to reach the peak values and becomes at busy_wait status.
At this point, we can examine the system behaviors at the loading moment. Below you can see the impacts of increases in alarms in CPU, memory and disk i/o movements.
Figure 3.6 shows the situation as 21,850 received alarm processes are tried to be processed simultaneously in the manual system. While the processes are sent on a single queue for problem definition, the first process, all cpus (99 percent) become overloaded and the system loses its capacity to respond. The entire process queue is filled up, the processes do not progress and, as a consequence of such peak status of the user processes, the system processes run out of source and
become hang. The memory is effectively utilized and, since the processes cannot be processed by the cpu, the memory does not yet experience any problems.
Figure 3.6: Total System usage while Alarm processing for Manual Method (Ericsson Mobile Networks 2003, pp.103)
Figure 3.7 shows the situation as 28,820 received alarm processes are tried to be processed simultaneously in the Agm system. The processes are processed in parallel manner package by package through the queue for problem definition, the first process, and they are sent respectively to each of the 8 cpus. Therefore, the equal distribution enables the cpus to process the processes with a low average load such as approximately 11 percent. During such parallel processing, no cpu and memory shortage becomes at issue; and, even though only I/O increase takes place on the disk, the increase is instantaneous and, therefore, does not lead to any adverse results.
Figure 3.7: Total System usage while Alarm processing for Agm Method (Ericsson Mobile Networks 2003, pp.103)
According to our reviews and examinations on the matter; it is concluded that, during the processing of high quantities of alarms, the Manual method behaves in an instable manner and causes the cpu to go panic or the memory to go hang, and cannot respond the requests. The Agm method, however, process and respond high quantities of processes thanks to parallel processing. At this point, it will be used by difference methods to bear comparison with every two methods so as to agree the idea. You can review fifteen interrogative survey results by thirty system engineer assess every two methods have difference experience degrees below.
The members of an expert group whose job experience is under three years and the average of their ages is 25 with the members of another expert group whose job experience is more than three years and the average of their ages is 30 wanted to rate the answers of the survey.
You can review fifteen interrogative survey results by thirty system engineers whose job experience is two years and twelve years in interval assess every two methods have difference experience degrees below:
1-It is possible to manage all equipments of GSM network from one point 2-It is possible to monitor GSM Network alarm flowing in a real time basis.
3-According to severity of alarms, automatic solution of GSM NW problems is possible. 4-Avalibility of NW equipments can be increased and downtimes goes to a minimum level.
5-By this method, also relability of problem monitoring of NW goes higher and higher while decreasing operators personal mistakes.
6-It is possible to focus real and permanent NW problems while filtering and correlating alarms.
7-While datamining of contents of alarms, it is possible to differentiate alarms using alarm escalation methods.
8-It is possible to use all human resources for managing alarm flow on each region
9-Establishing a central monitoring network, it is possible to take advantage of decrease in costs.
10-It is possible to make new alarm flow rules via system software tools.
11-It is possible to make an itegrated co-operated IP and GSM networks resulting in a better service management.
12-Using embedded alarm notification features, it is possible to obtain a proactiv approach to solve subscribers communication problems.
13-Taking advantage of Knowledge Base of problem resolution, it is possible to solve similar alarms in a shorter period preventing to expand all over subscribers.
14-Using highly scaled alarm history database, it is possible to analyze-focus permanent problem over a time period giving an opportunity of hardware planning in a more better way.
15-Its scalable structure and developement features, it is possible to decrease implementation time costs.
You can review fifteen interrogative survey results by thirty system engineer assess every two methods have difference experience degrees below
Table 3.7: Sum of Survey Results for Automatic and Manual Method
Seniority (years) Agm (X) Manual (Y)
7 99 19 9 95 22 12 98 23 8 98 20 10 99 23 6 98 22 4 99 21 2 96 21 5 96 21 7 96 21 3 98 20 4 97 23 5 96 20 6 97 23 9 96 24 3 96 21 2 98 23 7 96 22 6 99 22 3 97 20 4 97 24 5 97 22 2 97 22 6 97 23 2 98 26 5 97 21 8 96 25 3 95 25 4 96 26 4 95 26 Total 2909 671 Average 96.96667 22.3666667
Formula 3.1: Correlation Analysis Formula
] ) ( -) ][n( ) ( -) [n( ) )( ( ) ( 2 2 2 2∑
∑
∑
∑
∑
∑
∑
− y y x x y x xy nWe have a series of n measurements of X and Y written as xi and yi where i = 1, 2, ..., n used
to estimate the correlation of X and Y . The coefficient is also known as the "sample correlation coefficient". It is especially important if X and Y are both normally distributed. The correlation coefficient is then the best estimate of the correlation of X and Y .
n: observation count n=30 Σxy = 65044 Σx = 2909 Σy = 671 Σx² = 282119 Σy² = 15115 ] (671) -) ][30(15115 (2909) -) [30(282119 ) 671 )( 2909 ( ) 65044 ( 30 2 2 − = ) 3209 )( 1289 ( 1951939 1951320 − = 30 . 0 81 . 2033 619 − = − =
Table 3.8: Interpretation of the size of a correlation
Correlation Negative Positive
Small −0.29 to −0.10 0.10 to 0.29
Medium −0.49 to −0.30 0.30 to 0.49
Large −1.00 to −0.50 0.50 to 1.00
Figure 3.8: Correlation Chart for both method
It is calculated that values built up from two variable array with n=30 observation arrays. In this example, the correlation between Automatic method values and manuel methods is calculated. In this example, it can be seen that variables are negatively affected. i.e. while performance of Automatic method is increasing, Manual Method performance is decreasing. Consequently, it is clearly resulted that there is an opposite correlation between two methods.
In light of correlation analysis, It could be used pair wise t-test the results by system engineers have experience low third years with experience high third years make variance analysis to be using survey results. you can view results with formulation and hypothesis the following.
Table 3.9: Variance Analysis Results
Engineer Agm Total Agm Average Manual Total Manual Avg
0-3 Years 8 775 1454.5 178 335.5 3 years and more. 22 2134 493
30 x1-x avg -679.5 461720.25 -157.5 24806.25 x2-x avg 679.5 461720.25 157.5 24806.25 Variance 175.4461456 40.66632514 0 20 40 60 80 100 120 1 3 5 7 9 11 13 15 17 19 21 23 25 27 29 Agm (X) Manual (Y)
n1 = 22 n2 = 8
x1 = 775
x2 = 2134
Z = 3.61360145
Consider a normally distributed population. To estimate the population's variance take a sample of size n and calculate the sample's variance. An unbiased estimator of the population's variance is:
Formula 3.2: Variance Analysis Formula
2 2 2 1 2 1) ( ) ( n n x
σ
σ
σ
∆ = +Clearly for small values of n this estimation is inaccurate. Hence for samples of small size instead of calculating the z value for the number of standard deviations from the mean.
Formula 3.3: Variance Analysis Formula
x x x z ∆ − =
σ
2 1Using probabilities based on the normal distribution, calculate the t value. Formula 3.4: Pairwise T-Test Formula
2 1 ) 1 ( r n r t − − =
The probability that the t value is within a particular interval may be found using the t distribution. The sample's degrees of freedom are the number of data that need to be known before the rest of the data can be calculated.
z > t > 1,718 H0 rejected
HYPOTHESIS HO = There is no difference between two methods in terms of performance HYPOTHESIS H1 = There is huge difference between two methods in terms of performance.
(3.2)
(3.3)