1
Abatement of Pollutant emissions in Nigeria: A task before Multinational
Corporations
Edmund Ntom UDEMBA
Faculty of Economics Administrative and Social sciences, Istanbul Gelisim University, Istanbul, Turkey
[email protected] [email protected]
Christopher Oko AGHA Department of General Studies, Federal Polytechnic of Oil and Gas, Bonny Island, Rivers State, Nigeria.
[email protected] Correspondence: Email: [email protected];
[email protected]; [email protected].
Tel: +905357808713
WhatsApp: +2347039678122; +905357808713
Funding
We hereby declare that there is no form of funding received for this study.
Compliance with Ethical Standards
We wish to disclose here that there are no potential conflicts of interest at any level of this study.
Abstract
Following the global alertness and consciousness over the increasing warming and heating on the ground of climate change, over 200 countries including Nigeria have committed themselves in reducing this global phenomenon. Nigeria being among the countries placed with individual country’s task and also known as a one-economy operating county because of its oil and gas gifting, is subject to investigation of its efforts and result in decarburization of its economy and environment. The oil and gas sector of Nigeria has been identified as the major sector where the
2
heavy utilization of energy is centered on through mining and exploration activities of these foreign companies who have investments and stakes in the main stream sector. This is the major reason of adopting FDI as a major variable to test the performance of the environmental condition of the country. To effectively carry this research, the authors, adopt, cointegration test and the linear ARDL test to unveil the true picture of the foreign investors impact on carbon emission reduction. Among the findings is the positive but not significant interaction between economic growth and carbon emission which infer the capability of the economic operation to initiate the degradation in the environment via pollutant emission. Energy use depict inducement to carbon emission with positive association with carbon emission. FDI established both negative and positive relationship with carbon emission at initial stage and lag 1 respectively. All the variables point towards carbon emission increase in the country which call for serious attention towards decarburization of the country to fall in line with the agreed policy of Paris formation.
Keywords: Multinational corporations; FDI; carbon emissions; economic growth; Nigeria.
JEL Codes: C32, C33, Q43, Q58
1. Introduction
The basis of this paper “Abatement of Pollutant emissions in Nigeria: A task before Multinational Corporations” to ascertain the current happenings and technologies applicable in the sequestration of CO2 emission by multinational corporations. In developed nations as well as in developing nations whose economies are extractive based, the way of life today is completely dependent on abundant supplies of energy (Bridge, G. 2008). Nigeria economy is significantly based on oil sector whose companies’ operational activities are purely mining and extractions. The process of refining the products is harmful to the environmental performance of the country. The exploration of crude oil and flaring of natural gases constitute heavy pollutant emission into the environment. Most times oil spillage is witnessed within the geographical location of the extraction. This spillage constitute pollution both to the soil where farming activities take place, and the water bodies. The toxic nature of the spillage is capable of rendering the farming lands infertile, and shorten the life span of water animals and fishes. Often times the companies operating in this oil industry are less concern with the negative environmental effect of their activities. They jettison the laid down regulation guiding the extractive activities in the industry because of lack of strict monitoring from the appropriate authorities.
3
Figure1: The negative environmental impact of the crude oil extraction and spillage in Nigeria. Source: Legit
In the present task placed before every country in emission reduction, it is worth investigating the role of the multinational companies operating in the country’s oil industry towards emission reduction. Most of these companies are multinational industries investing into the industry, and this is more reason the current paper considers Foreign Direct Investment (FDI) as among the indicators to determine the environmental performance of Nigeria. This is a concept to proxy the multinational investors into the oil industry as FDI because more than 80 percent of the foreign investment in Nigeria are majorly into oil industry. Many authors and literature have researched on this topic as it concerns reducing pollutant emission of various country and limited for the case of Nigeria. To the best of the authors knowledge, little or none has been done on the area of researching the effectiveness of Nigeria as a nation towards emission reduction with focus on the operational activities of multinational companies. More distinguishing factor that contributes to the uniqueness of our study is the adoption of Foreign Direction Investment (FDI) as a proxy to multinational companies. This we conceived as it connects to the investment inflow from abroad who are mostly operational in the main stream or oil and energy sector of the country. The overwhelming expectation of the masses is that most of the multinational companies are pollution inherent in operation. Thus, the objective of this paper is to ask pertinent questions as it concerns to multinational corporations with focus on (main stream sector) operating in Nigeria to ascertain their sensitivities on their operational hazards in the environment like; Are they actually responsive? In what ways? what are the evidence? What could have actually made them less conscious of the environmental health in the first place? what are the factors that necessitated this pollution by the multinational corporations operating in Nigeria. To proceed with the studies, the rest of the parts are structured as follow: section 2. (literature review and theory). Section 3. (Methodology and data). Section 4. (Empirical findings and analyses). Section 5. Conclusion and policy framework.
2. Lıterature revıew
In the time past, several works have researched on the association between carbon emission and the selected variables (oil production, GDP, electricity production and FDI) without a generalized opinion on what should be considered as a unified opinion. Some are of opinion that negative
4
relationships exist while others are in support of positive relationship among the chosen variables. The current will expose some the works with their findings and conclusions.
In the work of Fatai et al., (200) on New Zealand where he applied 1960 -1999 data with the help of granger causality and Yamamotos and ARDL techniques to investigate the associatıon among employment, total energy consumptıon ( i.e. disaggregated in oil,electricity and gas) and GDP, they found no causal relationshıp between total energy consumption and real GDP, but the real gdp causes oil and electricity consumption.Bekun and Agboola, (2019) found along run equilibrium amongst the electricity consumption, gross domestic product per capita and carbon emission. Also, among the findings in the work of Emir, & Bekun, (2019) is the positive relationship between economic growth and energy consumption. Among their findings is the one way transmission from elicity to gross domest product. In the work of Balcilier et al., (2019), cointegration equaton was established among the economic growth and enegy consumption. Wang et al., (2017) investigated the link betwen electricity and economic growth and found that economic growth is impacted by the electricity consumption. A study for portugal was done by Shahbaz et al., (2017), they found that causality is runnig from electricity consumption to economic growth justifying electricity energy generated growth. Balsalobre-Lorente et al., (2018) in their study on EU-5 countries reveals that electricity energy consumption induce environment quality positively. Kahouli (2018) explored the impact of electricity consumption towards the econonic performance of the Mediterranean countries, and they found a hypothsis supporting the positive impact of electricity consumption to economic growth. Aslo,the it was revealed in the work of Apergis, & Payne, (2010) the existence of long run equilibrium between the energy consumption and economic growth. Jumbe (2004) did a cointegration and causality work on the Malawi economy where he found bi-directıonal causality between the GDP and the electricity and also GDP causes electricity consumption from error correctıon tests. Morimoto and Hope (2004) in their causality study on Sri Lanka found electricity production causing GDP. Oh and Lee tested the relationship between GDP and electricity consumption with the help of granger causality and error correction, they found bi-directional causal transmitting among them.In the same style, a study of Taiwan economy by Yang (2000) with granger causality found electricity consumption causes real GDP. Shiu and Lam (2004) researched on Chına economy and electricity consupmtion causing GDP. Several other studies found economic growth causes electricity consumption such as (Ghosh, 2009; lee and Chang, 2008; Mehrara,2007; and Narayan and Singh, 2007),while others such as Altınay and Karagol, 2005; Squalli, 2006 found the reverse.
The relationship between the energy consumption and carbon emissions has been researched in many literature. Udemba, (2019) in his work titled “ Triangular nexus between FDI. Internal tourism and energy consumption in Chinese economy: accounting for environmental quality” found a unidirectional causality trnsmiting from energy use to the carbon dioxide. In the work of Apergis e al. (2010), which was utiized to research the causal link amongst carbon dioxide emission and green energy consumption, they found that green energy has influence on carbon emissions in the long run but inluences the carbon emissions in the short run. Also, a one way transmission was found amongst the green energy and carbon emissions in the case of Malaysia Shahbaz, (2015). The relationship between energy consumption and carbon emissions was examined by Ajmi et al., (2013) for the case of G7 countries. They found altered granger causality
5
among the chosen countries, it was discovered a two-ways transmission for the case of USA and a one-way tansmission was found for the case of France from enery consumption to carbon emission. Menyah and Rufael (2010) applied granger causality investigatiion to study the causal connection amongst energy consumption , nuclear energy and carbon emission for the case of United States. They found no causality amongst the green energy consumption and the carbon emission. Soytas et al., (2001) researched on the causal relationship amongst energy consumption and carbon emission for the case of USA and their findings revealed a one-way causal link amongst energy consumption and carbon emission.
Still in attempt to study on the effect energy – greehouse gas emissions, Other scholars have equally investigated on the relationship between energy consumption and economic growth. This was done by classifying the relationsship into conversion, growth and feeback hypothesis. The conversion hypothesis was observed and validated by (Destek and Sarkodie, 2019; Dong et al., 2018; Magazzino, 2016; Menyah and Wolde-Rufael, 2010; Cheng and Lai, 1997 and Aboseddra and Baghestani, 1989). They found a one way directional causal transmssion runing from economic growth to enrgy consumption, while the growth hypothesis was found and validated running from energy consumption to economic growth by ( Udemba, 2019b; Bekun et al., 2019 b; Balsalobre-Lorente et al., 2018; Adams et al., 2018; Destek and Aslan, 2017; Inglesi-Lotz, 2016; Hamit-Haggar, 2016;Ozturk and Bilgili, 2015; Bilgili and Ozturk, 2015; Tang et al., 2016;Yildiim et al., 2012; Soytaset al., 2001; Rafiq and Salim, 2011 and Stern, 1993). The feedback hypothesis was equally established by the works of ( Liu et al., 2018; Wang et al., 2016 and Glasure, 2002). The exceptional case of independent or neutrality hypothesis was found by Ozturk and Acaravci, 2010 and Rafiq and Salim, 2009. The scholars such as Chang et al., (2014), Chandran and Tang (2013), Chiou-Wei et al., (2008), Tang, (2008) , have done their reserarch on the link between energy consumption and economic growth on ASEAN-5 countries and found that hike in energy consumption increseas economic growth thereby support the growth hypothesis. Likewise some findings from Yildrim et al., (2014), Hwang and Yoo, (2014), Islam et al, (2013) and Chiou-Wei et al., (2008) suggest that increase in economic growth leads to increase in energy consumption which validate the conversion hypothesis in ASEAN-5 countries.Also, on the part of feedback hypotheis where the interdependence amongt the energy consumption and economic growth exist, some other scholars such as Kyophilavog et al, (2015), Yildrim et al., (2014), Jafariet a., (2012), Chandran and Tang (2013), Chang et al., (2013), Akkemik and Goksal (2012), and Yu and Choi (1985) have worked on the link between energy consumption and economic growth and validate the hypothesis in ASEAN-5 countries
3. Data and Methodology
3.1. Data
The authors applied Nigerian annual data from 1981- 2018 for a detailed estimation and analyses of their study. Data were sourced from 2019 World Bank Development Indicators (WDI) and were all expressed in logarithm form except the Foreign Direct Investment (FDI) which is already expressed as percent to gdp. Data were sourced based on the selected variables: GDP=GDP per
6
capita (constant 2010 US$), FDI=Foreign direct investment, net inflows (% of GDP), EU=Energy use (kg of oil equivalent per capita).
3.2. Methodology
The current paper the following methods in the course of the analyses for efficient estimation and policy construction, they are: Statistical explanation, unit root test, optimal lag selection, dynamic autoregressive distributed lag (ARDL) AND long-path Granger causality test. The normality and alignment of the data was tested with the Jarque-bera, skewness and kurtosis from the statistical explanation, while the unit root test was estimated in confirmation of the stationarity stand of the variables and the order of integration which aided our choice of approach in this current investigation. Applications such as Augmented Dickey Fuller, (ADF, 1979), Philip- perron (1990), Kwiatkwoski Philips-Schmidt-Shin (KPSS 1992) were used for the unit root testing. Structural break test by Zivot and Andrew, (1992) was utilized to ascertain the permanent shock that might be influential on the stationarity of the variables. The optimal lag selection was done with Akaike Information Criterion (AIC). Dynamic autoregressive distributed lag (ARDL) with bound testing for long path analysis (Pesaran at al., 2001) are adopted in estimation and empirical analyses of this work for the confirmation of the long path association among the selected variables.
3.3. Model Specification
The current study hypothesized that the environmental quality of Nigeria is impacted by the selected variables (gdp, fdi and energy use) with the focus on the impact of the multinational corporations via foreign direct investment. For this reason, the authors adopt a linear modelling in giving a direct and clear effect of the variables to environmental quality of Nigeria. The environmental quality s proxy by carbon emissions (C02 ) and it is considered as the dependent variable while others are the independent variables. Because, the authors wish to investigate on the linear impact of the variables to the environmental quality, the model specification of this work is based on the ARDL approach to identify the linear interactions among the selected variables with the focus on carbon emission.
The specification followed Pesaran and Shin, (1998) and Pesaan et al., (2001) proposed linear ARDL and Bound testing model with error correction as follows:
(∆ 02 ) = + 0 + + + + ∑ ∆ 02 + ∑ ∆ + ∑ ∆ + ∑ ∆ + + (1) (∆ ) = + 0 + + + + ∑ ∆ 02 + ∑ ∆ + ∑ ∆ + ∑ ∆ + + (2) (∆ ) = + 02 + + + + ∑ ∆ 02 + ∑ ∆ + ∑ ∆ + ∑ ∆ + + (3)
7
(∆ ) = + 02 + + + + ∑ ∆ 02 +
∑ ∆ + ∑ ∆ + ∑ ∆ + + (4)
Eqs.(14) are specified to estimate the linear ARDL long run relationships between the selected variables. The variables are C02 (carbon emissions), FDI (foreign direct investment), GDP (economic growth) and EU (energy use) and are all in logarithm form except the FDI which is in percentage to GDP already. The symbol denotes the 1st difference of the considered variables in this study while the 1 and 1 represent the long run and short run coefficients for the variables. The ECMt-1 shows the speed of adjustment over a period of time in establishment of the long run, while i stand for 1, 2,3, etc. Bound test via F-statistics is utilized in this work to determine if there is the existence of cointegration relationship amongst the variables. This is achieved by comparing the critical value of both upper and lower bounds with the value of the F-statistics. If the F-statistics is greater than the upper bound, it means that there is existence of cointegration which establishes the long run association among the variables. But If the F-statistic is less than the upper bound, it means that there is no cointegration among the variables, while inconclusive is established where the value of F-statistics falls in between the lower and upper bounds. This is expressed in hypothesis manner. The null hypothesis is saying that there is no cointegration while the alternative hypothesis is saying that there is cointegration. This is expressed as follows: H0 : 1 =2 =3 =4= 0 (when F-stats both bounds) against H1 : 1 =2 =3 =40 (when F-statsboth bounds).
4. Empirical result and discussion
The empirical estimations and the results with their interpretations are shown and discussed in this section. The first step taken in this study is the estimation of descriptive statistics and the stationarity test supported with structural break analyses as well. Optimal lag length was tested with Akaike Information Criterion (AIC) as the selection standard because of its uniqueness feature that places it above other criteria (Shahbaz and Rahman, 2012). The Bound test was performed as cointgration was detected and this paved way for the estimation of the investigation of linear interaction amongst the variables through the ARDL approach. We performed different kinds of diagnostic tests ranging from serial correlation, heteroscedasticity and CUSUM tests to infer the robustness of our estimation.
4.1. Descriptive statistics
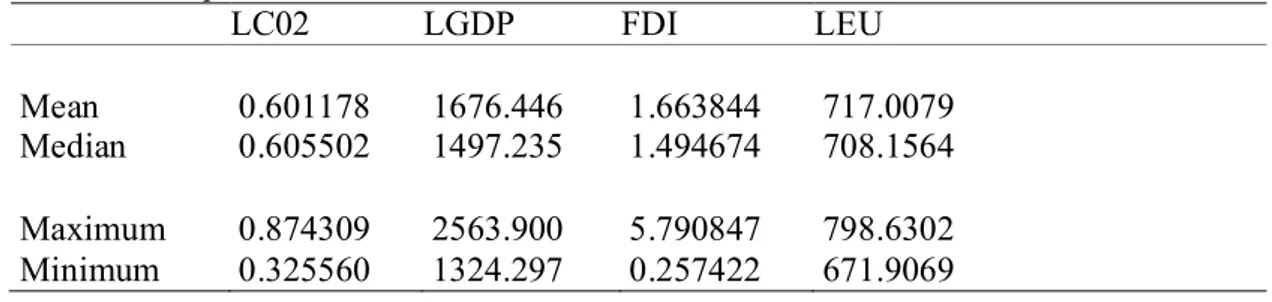
Table 1. Descriptive Statistics of the variables
LC02 LGDP FDI LEU
Mean 0.601178 1676.446 1.663844 717.0079 Median 0.605502 1497.235 1.494674 708.1564 Maximum 0.874309 2563.900 5.790847 798.6302 Minimum 0.325560 1324.297 0.257422 671.9069
8 Std. Dev. 0.178115 387.7530 1.281700 35.63806 Skewness -0.095440 0.991746 1.563612 0.579263 Kurtosis 1.733430 2.597423 5.395335 2.160871 Jarque-Bera 2.324233 5.803100 21.98265 2.898953 Probability 0.312823 0.054938 0.000017 0.234693 Sum 20.44005 56999.16 56.57069 24378.27 Sum Sq. Dev. 1.046929 4961629. 54.21092 41912.36 Observations 34 34 34 34
Source: Authors compilation
From the result of the descriptive statistics as it is displayed in Table 2, we deduced that all the variables have higher mean except the case of carbon emission. We also found normality from the test with the observation of the Jarque-bera and Kurtosis respectively, hence all the variables shows numbers less than 3 with the exception of the FDI in confirmation of the light tail. The variables are not significant except for the case of gdp and fdi.
4.2. Stationarity test
Following the order of our analyses, unit was performed to ascertain the trend and stationarity of the selected variables which can influence our choice estimation approach. There is always a need to test the stationarity of the variables in a times series data which are expose to shocks in the economy for the time chosen for the investigation. For the effectiveness and robustness of our analyses, we compliment the conventional approaches (such as augmented dickey-fuller (ADF, 1981), Philip perron, (1990), kwiatkwosi Philips-schmdt-shi(kpss, 1992) ) towards the testing of unit root with Zivot and Andrew, 1992 structural break test. The idea behind this is to expose the permanent shock that took place in the economy within the selected time period for this research which the mentioned conventional unit root test approaches could not detect. Most times, the shocks are not accounted for and instead the traditional unit root test will consider the shock as stationarity which will affect the findings with biasedness and error. From the traditional unit root test, we found a mixed order l(0&1) of integration from both ADF, PP and KPSS, while we found shocks that affected the economy with impact on the policies of the country in the following years; 1993 for economic growth, 1995 for FDI, 2000 for Carbon emission and 2012 for energy use. As of 1993 and 1994 periods, the economic performance and growth of Nigeria suffered some shocks from excesses of external debts and debt services which amounted to 33.6 billion U.S dollars equivalent to 120% of the total GDP as the external debt, and 4.7 billion U.S dollars equivalent to 38% and 17% of both export receipts and GDP respectively. This is among the shocks that impacted the economic growth as identified by the Zivot and Andrew structural break test. Within
9
the period of 1995/1999 and 2001, the Nigerian economy experienced a massive shock from the service sector with the liberalization policy which saw to the entrance of some foreign companies into the telecommunication with the reign of Global System for Mobile (GSM). Although, this could be termed positive to the economic performance but it has a structural effect to the economy which could have affected the trend in the selected variable. As for the energy production and use in the country, a significant shock was noticed with the period of 2011 and 2014 with the activities of the militants group in the region where the crude oil exploration majorly takes place. The production level of the crude was reduced to 866.2 million barrels, 704.45 and 708.10 million barrels in 2011, 2013 and 2014 respectively (Saheed et al., 2015). This could be seen impacted both the energy use and economic performance of Nigeria ad probably left a shock which needs to be accounted while measuring the trend of the variables. Furthermore, the environmental impact of the both the production and usage of energy sources such as crude oil was noticed in mid 1980s and still effective till 2000 and till date. This impact was noticed when the flaring of the natural gas was initiated because of the lack of market with high cost of refining activities and this equally amount to a shock on the environment. The results of both ADF, PP, KPSS and Zivot and Andrew are presented in Tables 3 and 4 as follows;
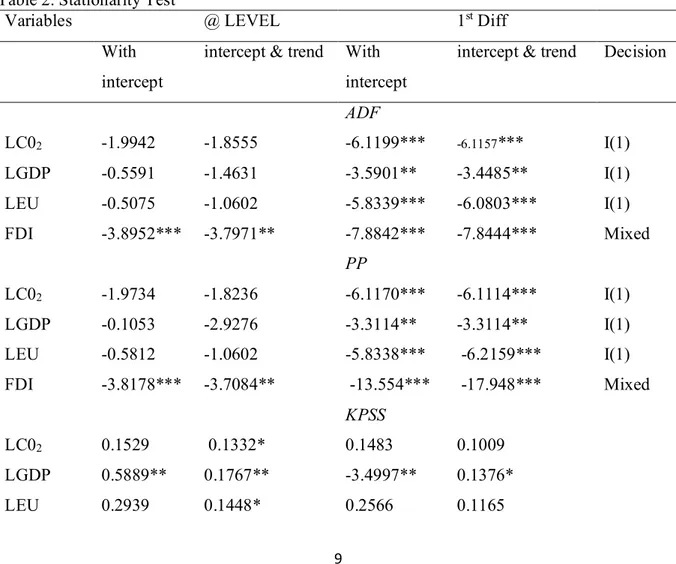
Table 2. Stationarity Test
Variables @ LEVEL 1st Diff
With intercept
intercept & trend With intercept
intercept & trend Decision
ADF LC02 -1.9942 -1.8555 -6.1199*** -6.1157*** I(1) LGDP -0.5591 -1.4631 -3.5901** -3.4485** I(1) LEU -0.5075 -1.0602 -5.8339*** -6.0803*** I(1) FDI -3.8952*** -3.7971** -7.8842*** -7.8444*** Mixed PP LC02 -1.9734 -1.8236 -6.1170*** -6.1114*** I(1) LGDP -0.1053 -2.9276 -3.3114** -3.3114** I(1) LEU -0.5812 -1.0602 -5.8338*** -6.2159*** I(1) FDI -3.8178*** -3.7084** -13.554*** -17.948*** Mixed KPSS LC02 0.1529 0.1332* 0.1483 0.1009 LGDP 0.5889** 0.1767** -3.4997** 0.1376* LEU 0.2939 0.1448* 0.2566 0.1165
10
FDI 0.1533 0.1424* 0.3502* 0.2747***
Notes: a: (*) Significant@ 10%; (**) Significant @ 5%; (***) Significant @ 1%( b): P-value
according to (1) Maclean et al., (1996) one-sided p-values (2) KPSS (1992)
Source: Authors computation
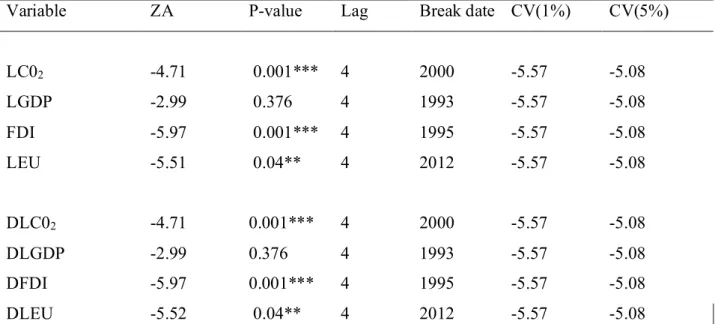
Table 3. Structural break test
Variable ZA P-value Lag Break date CV(1%) CV(5%)
LC02 -4.71 0.001*** 4 2000 -5.57 -5.08 LGDP -2.99 0.376 4 1993 -5.57 -5.08 FDI -5.97 0.001*** 4 1995 -5.57 -5.08 LEU -5.51 0.04** 4 2012 -5.57 -5.08 DLC02 -4.71 0.001*** 4 2000 -5.57 -5.08 DLGDP -2.99 0.376 4 1993 -5.57 -5.08 DFDI -5.97 0.001*** 4 1995 -5.57 -5.08 DLEU -5.52 0.04** 4 2012 -5.57 -5.08
Notes: a: (*) Significant at the 10%; (**) Significant at the 5%; (***) Significant at the 1%( b):
P-value according to (1) Maclean et al., (1996) one-sided p-P-values
Source: Authors computation
4.3. Linear ARDL, cointegraton and diagnostic tests
Table 6 contains the output of the linear ARDL estimation, cointegration and some of diagnostic tests. First, we deduced that 89.2% (R2 =0.892) of the dependent variable (carbon emission) was explained by the selected independent variables (gdp, fdi and energy use). Hence, economic growth, foreign investments and energy use explain 89.2% of carbon emission while the error term in the model explains the remaining variation in carbon emission (10.8%). The Durbin Watson (DW) test of the estimation is 2.399 which is well above the yardstick of ascertaining the absence of autocorrelation in the model. This points out that the variables selected in the model can explain the variation in carbon emission in the absence of autocorrelation. Also, for the diagnostic test, we find nonappearance of heteroscedasticity in our model and a good fit of CUSUM and CUSUM square for our model. The red lines of both cusum and cusum square are well bounded with the blue lines of the two test as shown in figure 1&2. The findings show the reliability and stability of our model is ascertained. Additionally, the F-stats indicates the existence of strong cointegration (the existence of long run relationship). This is confirmed from the comparison of the F-stats with the upper bound at 1% which shows that F-stats is greater than the critical value of upper bound
11
even at 1%. This inform the choice of the authors in pursuance of the remaining investigation with linear ARDL approach to ascertain both the linear relationship of the variables on both short and long run. The results of the mentioned estimations and the linear ARDL are all present in the Table 6 below. Included in the estimation is the optimal lag selection which aided the authors in lag selection for the estimation of the model. Akaike Information Criterion (AIC) as a selection criterion was considered for the optimal selection based on its advantage over other criteria (Shahbaz and Rahman, 2012). The optimal lag is 3 which the authors considered good as to compare with the sample size of the model. The result of the optimal lag is available on request. The error correction model shows a negative coefficient (-0.503) and also significant at 1% which confirms that long run relationship exists among the variables. This implies the speed of adjustment towards long run path is 50.3%. Both the short run and long run linear relationship from ARDL estimation as they appeared on the table are interpreted and explained with references as follow: A positive but not significant relationship is established between carbon emission and economic growth both in the short run and long run. Numerically, a one percent increase in economic growth will lead to 0.00002 increase in carbon emission. The impact is very in-signified considering the coefficient and the non-significant nature. This is not far-fetched from the findings of the structural break because of excessive debts and debt servicing obligation on the economic performance of the country which is capable of slowing down the economic growth. This is in line with EKC hypothesis which exposes three stages of economies with the expected practice in economic performance and Impact of each stage on the environment. Most developing economies are assumed to be operating at the first stage which is characterized with rise in economic growth with poor environmental performance. The countries are said to be in competitive mode of trying to meet up with the developed economies but with one sided policy of promoting economic growth without reciprocating the policy to better environment. This finding affirms the findings of EP Mesagan, (2015) for Nigeria; Bello, A. K., & Abimbola, O. M. (2010) for Nigeria. udemba E.N, (2019) for China; Udemba et al., (2019) for Indonesia. Surprisingly the relationship between foreign direct investment and carbon emission is negative and significant relationship. This is somewhat contending with the finding on the economic growth because foreign direct investment especially on the main stream is among the determinants of the Nigerian economy, so it is expected that foreign direct investment will move in the same direction with economic growth. Also, this finding raises some silent question for the case of Nigeria where most of the foreign investments are targeted to oil sector which according to public opinion increases pollutant emissions via natural gas flaring operations. More so, the activities of the multinational companies in energy sector of the economy as it regards to their operation in oil exploration, performance, and neglect to their corporate social responsibilities to the environment of their operation are perceived to be negligible to the expectations of the masses. Numerically, a one percent increase in foreign investment leads to a decrease in carbon emission by -0.030. But the a priori condition is established in lag 1 where the relationship changed to positive. This simple means the deviation from the agreed terms of operation as defined to them by the Nigeria policy makers before the commencement of operation. Maybe, there was adherence to the policy as it concerns operational
12
regulation to maintain good environmental quality at the initial stage but tend to deviate because of relaxation of strict monitoring. Numerically, a one percent increase in foreign investment leads to 0.094 increase in carbon emission. This finding supports the findings of Bello, A. K., & Abimbola, O. M. (2010) for Nigeria. udemba E.N, (2019) for China; Soysa and Neumayer (2004); Bi.G.B et al., (2006) and Tamazian et al., (2009). Finally, the authors establish positive relationship between energy use and carbon emission. This is expected from such a developing economy that has a proven record of highly dependent on oil sector where lots of energies are utilized via production that includes mining and refining. Hence, a one percent increase in energy utilization leads to increase in carbon emission at the rate of 0.003 and 0.013 respectively for short run and long run. This finding is in consonance with the findings of Al-mulali and Ozturk, (2015) for the 14 MENA; Ozturk, et al., (2016) for the case of 144 countries; Bekun, F. V., Alola, A. A., & Sarkodie, S. A. (2019) for 16 EU countries; Akadiri, A. C., Saint Akadiri, S., & Gungor, H. (2019a) for Saudi Arabia; Sarkodie, S. A., & Strezov, V. (2019) for developing countries. Table 4. Linear ARDL model of LC02
Variables Coefficients SE t-statistics P-value
Short-path D(LGDP) 0.00002 0.000274 0.080978 0.9364 D(FD) -0.030 0.009 -3.300 0.0045*** D(FDI(-1)) 0.094 0.020 4.573 0.0003*** D(LEU) 0.003 0.0008 4.183 0.0007*** CointEq(-1)* -0.503 0.089 -5.672 0.0000*** Long-path LGP 0.00002 0.000339 0.065387 0.9486 FDI -0.261087 0.051694 -5.050638 0.0001*** FDI(-1) 0.004709 0.014923 0.315593 0.7562 LEU 0.012576 0.003744 3.358862 0.0040*** C -6.805828 2.193984 -3.102040 0.0069**
13
R2 0.892166
Adj.R2 0.811291
D.Watson 2.399
Bound test(Long-path)
F-statistics 5.146625** K=3,@ 1% I(0)bound=3.65 I(1)bound=4.65 Wald test(short-path)
F-statistics 11.03139
P-value 0.000014***
Diagnostic tests Serial Correlation test
F-statistics 2.741061 R-square 16.08779 P-value 0.0759 Heteroscedasticity Test F-statistics 2.496947 R-square 18.90500 P-value 0.9739
Note: *, **, *** Denotes rejection of the null hypothesis at the 1%, 5% and 10% Sources: Authors computation
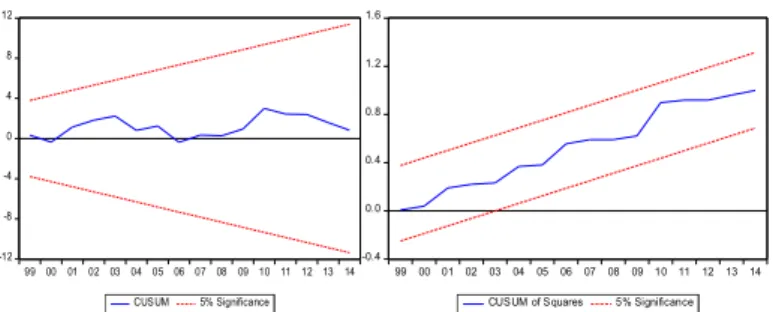
4.4. Diagnostic tests (CUSUM and CUSUM of squares)
The red lines of both cusum and cusum square are well bounded with the blue lines of the two test as shown in figure 1&2. The findings show the reliability and stability of our model is ascertained.
14 -12 -8 -4 0 4 8 12 9900 0102030405060708 091011 1213 14 CUSUM 5% Significance -0.4 0.0 0.4 0.8 1.2 1.6 99 00 01 02 03 0405 06 07 08 0910 11 12 13 14 CUSUM of Squares 5% Significance
Figure 2: CUSUM residual graphical plot Figure 3: CUSUM square residual graphical plot
5. Conclusion and Policy implication
Following the global alertness and consciousness over the increasing warming and heating on the ground of climate change, over 200 countries including Nigeria have committed themselves in reducing this global phenomenon. To see to the effectiveness and achievement of this joint task, Paris Agreement of November 2015 was considered a good ground for the reduction of the temperature rise from pre-industrial levels well below 20C and even strengthen the effort towards achieving the limit of the increase to 10 C. Also, countries are encouraged to undertake individual energy policies targeted towards carbon abetment, and a shift from crude or non-renewable energy sources to a cleaner energy economic operations by adopting renewable energy sources. Nigeria being among the countries placed with this individual country’s task and also known as one-economy operating county because of its oil and gas gifting is subject to investigation of its efforts and result in decarburization of its economy and environment. To effectively access the country’s achievement in this perspective, it is vital to consider the sector that is active and has been impacting both the economy and the environment through the operations of the foreign companies. The oil and gas sector of Nigeria has been identified as the major sector where the heavy utilization of energy is centered on through mining and exploration activities of these foreign companies who have investments and stakes in the main stream sector. Following the operational activities of these industries in oils and gas industry and their capability of polluting the environment, the authors raised the following questions to ascertain their commitment in curbing emissions in Nigeria: Are they actually responsive? In what ways? what are the evidence? What could have actually made them less conscious of the environmental health in the first place? what are the factors that necessitated this pollution by the multinational corporations operating in Nigeria This is the major reason of adopting FDI as a major variable to test the performance of the environmental condition of the country. To effectively carry this research, the authors, adopt different econometric and empirical approaches (such as combing for data of the related and important indicators, stationarity test, structural break test, cointegration test and the linear ARDL test) to unveil the true picture of the foreign investors impact on carbon emission reduction. At the end of estimations which thoroughly expose the true state of the interactions that exist among the selected variables in abatement of carbon emissions in the country, the authors come to agreement that the
15
multinational companies have not been stable in reducing the carbon emission. Hence, the finding from the interaction between the FDI and carbon emission exposes that at initial stage, the multinational firms in the country have actually curtailed the upsurge of the pollutant emissions. subsequently, the authors found that the increase in foreign investors activities have picked up the carbon emission depicting deviation from the initial effort to curb emissions. Among the findings is the positive but not significant interaction between economic growth and carbon emission which infer the capability of the economic operation to initiate the degradation in the environment via pollutant emission. The energy use depict inducement to carbon emission which is well expected from the angle of energy use considering the excessive utilization of energy by the foreign firms operating in the main stream sector of the country. All the variables point towards carbon emission increase in the country which clearly answer in affirmation to the questions raised by the authors thereby indicting the foreign investors of being capable of promoting emissions in Nigeria through their mining and explorative activities. This call for serious attention on the activities of the foreign investors towards decarburization of the country to fall in line with the agreed policy of Paris formation.
The policy framework of the country should be based on invoking the country’s regulatory measures as spelt in the federal government gas flaring regulation Act which places parameters in the mining, exploration and flaring of oil and natural gases in the country. The conditions and attached fines in times of deviation from the stipulated rules should be revisited so as to suppress the illegal activities that undermine the effort to maintain carbon emission free environment. Again, Nigeria has potential for easy shift from non-renewable to renewable energy sources. Building on already available hydropower through dams in the country, more sources like solar photovoltaics and wind power will aid the country in decarburization and maintain green energy and good economic performance. Nigeria is strategic for solar concentration installation and geothermal energy looking at the weather structure of the country with high temperature. Nigeria can align itself for the recent development of Ocean power which is in its demonstration stage considering its location and surrounded by water body.
Conclusively, the policy makers in Nigeria will attract more applause from both local and international communities if they can build on the highlighted policies in this work with reference to the findings from our study.
References
Abosedra, S., & Baghestani, H. (1989). New evidence on the causal relationship between United States energy consumption and gross national product. The Journal of Energy and Development, 285-292.
Abosedra, S., Dah, A., & Ghosh, S. (2009). Electricity consumption and economic growth, the case of Lebanon. Applied Energy, 86(4), 429-432.
16
Adam, D., & Markiewicz, R. (2009). Energy from earth-coupled structures, foundations, tunnels and sewers. Géotechnique, 59(3), 229-236.
Adams, S., Klobodu, E. K. M., & Apio, A. (2018). Renewable and non-renewable energy, regime type and economic growth. Renewable Energy, 125, 755-767.
Ajmi, A. N., El Montasser, G., & Nguyen, D. K. (2013). Testing the relationships between energy consumption and income in G7 countries with nonlinear causality tests. Economic Modelling, 35, 126-133.
Akadiri, A. C., Saint Akadiri, S., & Gungor, H. (2019). The role of natural gas consumption in Saudi Arabia's output and its implication for trade and environmental quality. Energy policy, 129, 230-238.
Akkemik, K. A., & Göksal, K. (2012). Energy consumption-GDP nexus: Heterogeneous panel causality analysis. Energy Economics, 34(4), 865-873.
Al-Mulali, U., Saboori, B., & Ozturk, I. (2015). Investigating the environmental Kuznets curve hypothesis in Vietnam. Energy Policy, 76, 123-131.
Altinay, G., & Karagol, E. (2005). Electricity consumption and economic growth: evidence from Turkey. Energy economics, 27(6), 849-856.
Apergis, N., Payne, J. E., Menyah, K., & Wolde-Rufael, Y. (2010). On the causal dynamics between emissions, nuclear energy, renewable energy, and economic growth. Ecological Economics, 69(11), 2255-2260.
Apergis, N., & Payne, J. E. (2010). Renewable energy consumption and economic growth: evidence from a panel of OECD countries. Energy policy, 38(1), 656-660.
Balcilar, M., Bekun, F. V., & Uzuner, G. (2019). Revisiting the economic growth and electricity consumption nexus in Pakistan. Environmental Science and Pollution Research, 26(12), 12158-12170.
Balsalobre-Lorente, D., Shahbaz, M., Roubaud, D., & Farhani, S. (2018). How economic growth, renewable electricity and natural resources contribute to CO2 emissions?. Energy Policy, 113, 356-367.
Bekun, F. V., & Agboola, M. O. (2019). Electricity consumption and economic growth nexus: evidence from Maki cointegration. Eng Econ, 30(1), 14-23.
17
Bekun, F. V., Alola, A. A., & Sarkodie, S. A. (2019). Toward a sustainable environment: Nexus between CO2 emissions, resource rent, renewable and nonrenewable energy in 16-EU
countries. Science of the Total Environment, 657, 1023-1029.
Bello, A. K., & Abimbola, O. M. (2010). Does the level of economic growth influence environmental quality in Nigeria: a test of environmental Kuznets curve (EKC)
hypothesis. Pakistan Journal of Social Sciences, 7(4), 325-329.
Bi, G. B., Song, W., Zhou, P., & Liang, L. (2014). Does environmental regulation affect energy efficiency in China's thermal power generation? Empirical evidence from a slacks-based DEA model. Energy Policy, 66, 537-546.
Bilgili, F., & Ozturk, I. (2015). Biomass energy and economic growth nexus in G7 countries: Evidence from dynamic panel data. Renewable and Sustainable Energy Reviews, 49, 132-138. Chandran, V. G. R., & Tang, C. F. (2013). The impacts of transport energy consumption, foreign direct investment and income on CO2 emissions in ASEAN-5 economies. Renewable and Sustainable Energy Reviews, 24, 445-453.
Chang, H., & Wu, H. (2013). Graphene-based nanocomposites: preparation, functionalization, and energy and environmental applications. Energy & Environmental Science, 6(12), 3483-3507. Chang, Y., Huang, R., & Masanet, E. (2014). The energy, water, and air pollution implications of tapping China's shale gas reserves. Resources, conservation and recycling, 91, 100-108.
Cheng, B. S., & Lai, T. W. (1997). An investigation of co-integration and causality between energy consumption and economic activity in Taiwan. Energy economics, 19(4), 435-444. Chiou-Wei, S. Z., Chen, C. F., & Zhu, Z. (2008). Economic growth and energy consumption revisited—evidence from linear and nonlinear Granger causality. Energy Economics, 30(6), 3063-3076.
Dahl, J. K., Buechler, K. J., Finley, R., Stanislaus, T., Weimer, A. W., Lewandowski, A., ... & Schneider, A. (2004). Rapid solar-thermal dissociation of natural gas in an aerosol flow reactor. Energy, 29(5-6), 715-725.
Destek, M. A., & Aslan, A. (2017). Renewable and non-renewable energy consumption and economic growth in emerging economies: Evidence from bootstrap panel causality. Renewable Energy, 111, 757-763.
18
Destek, M. A., & Sarkodie, S. A. (2019). Investigation of environmental Kuznets curve for ecological footprint: the role of energy and financial development. Science of the Total Environment, 650, 2483-2489.
Dickey, D. A., & Fuller, W. A. (1979). Distribution of the estimators for autoregressive time series with a unit root. Journal of the American statistical association, 74(366a), 427-431. Dong, K., Sun, R., Jiang, H., & Zeng, X. (2018). CO2 emissions, economic growth, and the environmental Kuznets curve in China: What roles can nuclear energy and renewable energy play?. Journal of cleaner production, 196, 51-63.
Dooley, J. J. (2008). US federal investments in energy R&D: 1961-2008 (No. PNNL-17952). Pacific Northwest National Lab.(PNNL), Richland, WA (United States).
Emir, F., & Bekun, F. V. (2019). Energy intensity, carbon emissions, renewable energy, and economic growth nexus: new insights from Romania. Energy & Environment, 30(3), 427-443. Fatai, K., Oxley, L., & Scrimgeour, F. G. (2003). Modeling and forecasting the demand for electricity in New Zealand: a comparison of alternative approaches. The energy journal, 24(1). Glasure, Y. U. (2002). Energy and national income in Korea: further evidence on the role of omitted variables. Energy economics, 24(4), 355-365.
Hamit-Haggar, M. (2016). Clean energy-growth nexus in sub-Saharan Africa: Evidence from cross-sectionally dependent heterogeneous panel with structural breaks. Renewable and Sustainable Energy Reviews, 57, 1237-1244.
Hwang, J. H., & Yoo, S. H. (2014). Energy consumption, CO 2 emissions, and economic growth: evidence from Indonesia. Quality & Quantity, 48(1), 63-73.
Inglesi-Lotz, R. (2016). The impact of renewable energy consumption to economic growth: A panel data application. Energy Economics, 53, 58-63.
Islam, M. R., Mekhilef, S., & Saidur, R. (2013). Progress and recent trends of wind energy technology. Renewable and Sustainable Energy Reviews, 21, 456-468.
Jafari, Y., Ismail, M. A., Othman, J., & Mawar, M. Y. (2015). Energy consumption, emissions and economic growth in Bahrain. Chinese Journal of Population Resources and
Environment, 13(4), 297-308.
Jefferson, M. (2006). Sustainable energy development: performance and prospects. Renewable energy, 31(5), 571-582.
19
Jumbe, C. B. (2004). Cointegration and causality between electricity consumption and GDP: empirical evidence from Malawi. Energy economics, 26(1), 61-68.
Kahouli, B. (2018). The causality link between energy electricity consumption, CO2 emissions, R&D stocks and economic growth in Mediterranean countries (MCs). Energy, 145, 388-399. Kwiatkowski, D., Phillips, P. C., Schmidt, P., & Shin, Y. (1992). Testing the null hypothesis of stationarity against the alternative of a unit root. Journal of econometrics, 54(1-3), 159-178. Lee, C. C., & Chang, C. P. (2008). Energy consumption and economic growth in Asian economies: a more comprehensive analysis using panel data. Resource and energy Economics, 30(1), 50-65.
Liu, Z., Hao, H., Cheng, X., & Zhao, F. (2018). Critical issues of energy efficient and new energy vehicles development in China. Energy Policy, 115, 92-97.
Magazzino, C. (2016). The relationship between CO2 emissions, energy consumption and economic growth in Italy. International Journal of Sustainable Energy, 35(9), 844-857. Mehrara, M. (2007). Energy consumption and economic growth: the case of oil exporting countries. Energy policy, 35(5), 2939-2945.
Menyah, K., & Wolde-Rufael, Y. (2010). CO2 emissions, nuclear energy, renewable energy and economic growth in the US. Energy Policy, 38(6), 2911-2915.
Mesagan, E. P. (2015). Economic growth and carbon emission in Nigeria. The IUP Journal of Applied Economics, 14(4), 61-75.
Morimoto, R., & Hope, C. (2004). The impact of electricity supply on economic growth in Sri Lanka. Energy Economics, 26(1), 77-85.
Narayan, P. K., & Singh, B. (2007). The electricity consumption and GDP nexus for the Fiji Islands. Energy Economics, 29(6), 1141-1150.
Neumayer, E., & de Soysa, I. (2004). Trade Openness. Foreign Direct Investment and Child Labor.
Nnaji, C. E., Uzoma, C. C., & Chukwu, J. O. (2010). The role of renewable energy resources in poverty alleviation and sustainable development in Nigeria. Continental Journal of Social Sciences, 3(31), 31-37.
Ozturk, I., & Acaravci, A. (2010). CO2 emissions, energy consumption and economic growth in Turkey. Renewable and Sustainable Energy Reviews, 14(9), 3220-3225.
20
Ozturk, I., & Bilgili, F. (2015). Economic growth and biomass consumption nexus: Dynamic panel analysis for Sub-Sahara African countries. Applied Energy, 137, 110-116.
Ozturk, I., Al-Mulali, U., & Saboori, B. (2016). Investigating the environmental Kuznets curve hypothesis: the role of tourism and ecological footprint. Environmental Science and Pollution Research, 23(2), 1916-1928.
Perron, P. (1990). Testing for a unit root in a time series with a changing mean. Journal of Business & Economic Statistics, 8(2), 153-162.
Pesaran, M. H., & Shin, Y. (1998). An autoregressive distributed-lag modelling approach to cointegration analysis. Econometric Society Monographs, 31, 371-413.
Pesaran, M. H., Shin, Y., & Smith, R. J. (2001). Bounds testing approaches to the analysis of level relationships. Journal of applied econometrics, 16(3), 289-326.
Rafiq, S., & Salim, R. (2011). The linkage between energy consumption and income in six emerging economies of Asia. International Journal of Emerging Markets.
Rafiq, S., & Salim, R. A. (2009). Temporal causality between energy consumption and income in six Asian emerging countries. Applied Economics Quarterly, 55(4), 335.
Saheed, Z. S., Sani, I. E., & Idakwoji, B. O. (2015). Impact of public external debt on exchange rate in Nigeria. International Finance and Banking, 2(1), 15-26.
Sarkodie, S. A., & Strezov, V. (2019). Effect of foreign direct investments, economic development and energy consumption on greenhouse gas emissions in developing countries. Science of the Total Environment, 646, 862-871.
Shahbaz, M., Benkraiem, R., Miloudi, A., & Lahiani, A. (2017). Production function with electricity consumption and policy implications in Portugal. Energy Policy, 110, 588-599.
Shahbaz, M., Lean, H. H., & Shabbir, M. S. (2012). Environmental Kuznets curve hypothesis in Pakistan: cointegration and Granger causality. Renewable and Sustainable Energy Reviews, 16(5), 2947-2953..
Shahbaz, M., Loganathan, N., Sbia, R., & Afza, T. (2015). The effect of urbanization, affluence and trade openness on energy consumption: A time series analysis in Malaysia. Renewable and Sustainable Energy Reviews, 47, 683-693.
21
Shieh, S. H., & Yang, P. S. (2000). Community structure and functional organization of aquatic insects in an agricultural mountain stream of Taiwan: 1985-1986 and 1995-1996. ZOOLOGICAL STUDIES-TAIPEI-, 39(3), 191-202.
Shindell, D. T., Schmidt, G. A., Miller, R. L., & Mann, M. E. (2003). Volcanic and solar forcing of climate change during the preindustrial era. Journal of Climate, 16(24), 4094-4107.
Shiu, A., & Lam, P. L. (2004). Electricity consumption and economic growth in China. Energy policy, 32(1), 47-54.
Soytas, U., Sari, R., & Ozdemir, O. (2001). Energy consumption and GDP relation in Turkey: a cointegration and vector error correction analysis. Economies and business in transition: facilitating competitiveness and change in the global environment proceedings, 1, 838-844. Squalli, J., & Wilson, K. (2006). A bounds analysis of electricity consumption and economic growth in the GCC. Economic Policy Research Unit Working Paper, (06-09).
Stern, D. I. (1993). Energy and economic growth in the USA: a multivariate approach. Energy economics, 15(2), 137-150.
Tamazian, A., Chousa, J. P., & Vadlamannati, K. C. (2009). Does higher economic and financial development lead to environmental degradation: evidence from BRIC countries. Energy
policy, 37(1), 246-253.
Tang, C. F., Tan, B. W., & Ozturk, I. (2016). Energy consumption and economic growth in Vietnam. Renewable and Sustainable Energy Reviews, 54, 1506-1514.
Tang, T., & Bhamra, T. (2008). Changing energy consumption behaviour through sustainable product design. In DS 48: Proceedings DESIGN 2008, the 10th International Design
Conference, Dubrovnik, Croatia.
Udemba, E. N. (2019). Triangular nexus between foreign direct investment, international tourism, and energy consumption in the Chinese economy: accounting for environmental quality. Environmental Science and Pollution Research, 26(24), 24819-24830.
Udemba, E. N., Güngör, H., & Bekun, F. V. (2019). Environmental implication of offshore economic activities in Indonesia: a dual analyses of cointegration and causality. Environmental Science and Pollution Research, 26(31), 32460-32475.
22
Wang, Y., Ma, J., Xu, Y., Wu, F., & Zhou, P. (2017). The electrical activity of neurons subject to electromagnetic induction and Gaussian white noise. International Journal of Bifurcation and Chaos, 27(02), 1750030.
Yildirim, E., Saraç, Ş., & Aslan, A. (2012). Energy consumption and economic growth in the USA: Evidence from renewable energy. Renewable and Sustainable Energy Reviews, 16(9), 6770-6774.
Yıldırım, E., Sukruoglu, D., & Aslan, A. (2014). Energy consumption and economic growth in the next 11 countries: The bootstrapped autoregressive metric causality approach. Energy Economics, 44, 14-21.
Yu, E. S., & Choi, J. Y. (1985). The causal relationship between energy and GNP: an international comparison. The Journal of Energy and Development, 249-272.
Zivot, E. (1992). Ve Andrews DWK (1992)“Further Evidence on the Great Crash, the Oil Price Shock and the Unit-Root Hypothesis”. Journal of Business&Economic Statistics, 10(3), 24-44.