Abstract - The global construction industry is predicted to grow rapidly over the next decades by developing globalization, urbanization, and infrastructure renewal. Global Construction 2020 forecasts that China, USA, India, Japan, and Canada will have the most contribution to construction development. Sustainability analyses (analysis of environmental, economic, and social) of construction sectors are highlighted by increasing trend in this industry. In this study, we analyze environmental impact, particularly carbon footprints, of five leading construction markets using a global carbon footprint accounting tool based on the World Input-Output Database (WIOD). To this end, we examine direct and indirect carbon emissions within sector itself and at national and global scales employing scope-based carbon footprint, production-consumption scope-based, and global impact distribution analyses. According to these analyses, we identified the notable hotspots where carbon reduction is required. This way, governments are able to manage and reduce carbon footprints on parts, which are increasingly important in the construction sector.
Keywords – Construction Supply Chains, Global Carbon Footprint Analysis, Scope-Based Carbon Footprint Analysis, World Input-Output Database, Emerging Construction Markets.
I. INTRODUCTION
Sustainable development become a fundamental issue for countries in today’s ever-changing world. Researches provide different definitions for sustainable development. However, the most comprehensive one is defined by a report in Bruntland Commission in 1987 which states that sustainable development is dealing with the today’s needs in a way that it will not impact negatively impact the ability of future generation to meet their needs as well [1]. The importance of “Green Economy” is increasing in world growing economies alongside of sustainable development. By reducing environmental pollution and ecological problems, economic welfare and social well-being will be increased [2]. In other words, sustainable development leads to environmental development and as a consequent improves the social welfare by increasing in the rate of employment and income, reducing environmental pollution and greenhouse gas emissions, and improving the protection of ecological balance and efficiency of energy and resources. Sustainable development and green economy were introduced by John Elkington for the first
time in 1997 with the term of triple-bottom-line, which means sustainable development improves the environmental, economic, and social dimensions simultaneously [3]. Construction sector is one of the major industries of the countries’ economy throughout the world that results in a rise in gross domestic product (GDP) [4]–[6]. Construction will be one of the most dynamic industrial sectors at the heart of global economic growth, leading to the evolution of societies around the world in the following decades. The average construction growth is going to be 67% worldwide by 2020, 5.2% growth per year [7]. China, USA, India, Japan, and Canada are predicted to have strong contributions to construction growth in 2020 [7]. China and India are the leading countries in this growth. Increase in population size is the main reason, which gives rise to USA and Canada construction market. Japan will have the slowest growing rate in construction development but it will still be one of the main regions with high contribution to this industry [7].
In this context, it important to analyze the environmental, economic and social impacts of construction sectors for these five leading countries both in the supply chain and inside the sector itself [8], [9]. This research aims to evaluate the environmental impacts of construction sectors of world major construction markets; China, USA, India, Japan, and Canada. This research determines the parts in which environmental impacts are more intense both in the supply chain and inside the sector itself with the aim of improving the environmental efficiency of the construction sector. This sustainability analyses and similar researches by monitoring the direct and indirect effects of the national and global environmental impacts, guide decision makers in sustainable development policies.
Global climate change is one of the significant results of human being’s unsustainable manner [10]. Global climate changes lead to many challenges related to natural environment, agriculture, water supplies, transportation systems, and more specifically human health and safety [11]–[13]. Greenhouse Gases (GHGs), especially Carbon dioxide (CO2), are the main factor responsible for climate change. Thus, in sustainability analysis, the environmental effects among the sustainability impacts need to be analyzed in a comprehensive way. Life Cycle Assessment (LCA) is a practical method for sustainability assessment [14], [15]. LCA is widely used for evaluating 1Department of Industrial Engineering, Faculty of Engineering, Bilkent University, Ankara, Turkey
2Department of Mechanical and Industrial Engineering, College of Engineering, Qatar University, Doha, Qatar 3Qatar Transportation and Traffic Safety Center, College of Engineering, Qatar University, Doha, Qatar
the ecological implications of products or systems considering their entire life cycle [16]–[20]. Although this traditional Life Cycle Analysis has been used in many researches, it has been rapidly transformed into the 'Life Cycle Sustainability Analysis' method in order to measure the social and economic impacts in addition to environmental ones. This new framework was first proposed by Kloepffer [21], which integrates three dimensions of sustainable development into Life Cycle Analysis [22]–[27]. LCA method allows for a detailed sustainability analysis on a product basis, however they do not consider the supply chain-based indirect impacts [28]. In this context, the Economic Input-Output Analysis developed by Wassily Leontief accounts for all direct impacts inside the industry as well as indirect impacts in the supply chains, using the monetary flows between the industries involved in the economy [29]. Using the input-output analysis, Economic Input-Output Life Cycle Assessment (EIO-LCA) tool was developed at the end of the 90's [30]. The weakest aspect of this model is focusing on specific environmental factors such as energy usage, water consumption, and carbon footprint in single-zone analyzes [31]. Therefore, different programs were developed by Australia, the UK and Japan to analyze the sustainability by integrating economic input-output tables with socio-economic and environmental indicators [32]. Detailed version of these models which is called the 'Triple-Bottom-Line Economic Input-Output Analysis' was developed by Kucukvar for sustainability analysis of USA in 2012 [33]. The social, economic and environmental impacts of US households, public sector consumption and investment, private sector investments have also been analyzed by this model [34].
While the input output models for single domain are widely used in sustainability analysis, global input output models are gaining worldwide importance. Multi Region Input Output (MRIO) models have become an important modeling technique for global-level sustainability analysis [35]. Several multiregional database such as EXIOPOL, GRAM), GTAP, OECD and World Input-Output Database are commonly applied global databases for MRIO analyses production and service sector [36].
II. METHODOLOGY A. Global Input-Output Analysis:
The input-output analysis (I-O) is used to analyze the environmental, economic and social interactions throughout the sectors inside a region or between different regions all around the world [37]. Economic input-output analysis estimates the direct and indirect monetary flows between sectors of national economies. Although single-zone input-output method has been used by many researches, there is little international sustainability analysis done by using global input-output method. Global multinational input-output method considers the territorial and global impacts of intercountry and sector trade [29]. The I-O analysis includes world input-output
tables (WIOD). This comprehensive database includes input-output flows across 35 different industries of 40 major countries in the world between 1995 and 2011 [38]. In a typical MRIO model, the ARS
ij represents the direct requirement matrix. In this matrix, each row indicates the total direct inputs required to produce a unit of output per sector. In other words, this matrix presents the input from sector i of country R need for industry j in country S. Here, R and S are equal to one of 40 countries whereas i and j represent one of the 35 different sectors of each country in the global WIOD database. By using Leontief’s input-output theory, the total environmental impacts of sectors are quantified. For more information about the input-output modeling, please refer to [29]: In this paper, sustainability analysis is carried out using Global Carbon Accounting Tool (G-CAT). This tool, which is developed by the Sustainable Analytics Research Group at Qatar University, allows users to conduct practical sustainability analysis. There are five steps in this model as follows:
Step 1: Select model year: The user may select any year to analyze between 2000 and 2009. Step 2: Select one of the production or service
sector to analyze: In this step, user determines which production or service sector he/she wants to analyze. For example, if the user wants to conduct a sustainability analysis of the construction industry, he will select the 'Construction' industry from the list.
Step 3: Enter the amount of economic activity in the sector as million dollars ($M): In this step, the user enters the economic activity in the sector as million dollars. For example, if the user wants to analyze the effects of per $M in the construction sector, in the model he/she enters $M after selecting construction industry in step 3 of the. This step aimed at bringing out the effects of sector itself and the supply chain if we get per $M dollar of construction investment.
Step 4: Indicator selection: At this stage, the user selects the indicator that he/she wants to analyze. At this time, only carbon footprint analysis is available. It will be possible to calculate various economic, environmental and social impacts in the versions of the model that will be developed over the years. For example, if the user wishes to analyze the social impacts of the construction industry, he/she chooses one of the social indicators, such as income, work accident, or tax.
Step 5: Run model and get the results: This step is the last step of the enhanced model and the user runs the model to get the results. The results will be presented with a national and global carbon footprint of the sectors, and the impacts of all sectors will be quantified.
The model output is performed through three different analyses: Scope-based Carbon Footprint Analysis: This analysis will enable the user to calculate the carbon footprint of scope 1, 2 and 3 of the production and service sectors. This analysis was developed by WBCSD & WRI and is used by the European Union Environmental Commission to monitor the carbon footprint of different sectors. In the results section, a scope-based analysis of the construction sector is presented in detail. According to this analysis, scope 1 includes on-site emissions of sector itself, scope 2 is the carbon emissions caused by power consumption indirectly (Electricity, steam, heat), and scope 3 covers all carbon emissions in the supply chain.
B. Production and Consumption-based Analysis: This analysis enables the user to compare the sustainability impacts of the production and service sectors in concerning country. In this analysis, the emissions caused directly by the industry itself and the emissions caused by the indirect routes (i.e. the entire supply chain) are examined separately. The output of the program presented in the conclusions is the distribution of the direct and indirect effects of the carbon footprint of the construction sectors of top five construction markets in the world.
C. Global Impact Distribution Analyses:
This analysis enables the user to determine the location of the national and global impacts of the concerning production and service sectors. It explores how much carbon emissions are caused in and out of the country due to the production of any industry. In this study, it is analyzed how much carbon emission is caused in every country on the global scale as a result of economic activity of the construction sector in top five construction markets in the world.
III. RESULTS
The comprehensive carbon footprint results of the construction industry of China, USA, India, Japan, and Canada are presented in this section. Results are achieved from three different analyses of the developed G-CAT model between 2000 and 2009. These analyses were presented as scope-based carbon footprint, production-consumption based impact analysis and global impact analysis.
A. Scope-based Analysis:
Scope-based analysis is the most common and accepted method used in reports in the business world [39-42]. This analysis allows the comparison of different countries and different sectors in accordance with standards. Fig 1 displays how scope-based carbon footprint related to construction sector of leading countries in this sector has been changed. The average carbon emissions for each of
these countries has been calculated in scope scale between 2000 and 2009. According to the analysis, the main emissions of construction sector is in the supply chain (scope 3) for all of studied countries. Since the emissions in the sector are more concentrated in the supply chain, the decisions made in the supply chain are very influential in the sector's emissions for all these countries. The carbon emissions produced by the industry itself (due to construction activities within the site) is significant for Japan, Canada, and USA in comparison to China and India. On the other hand, indirect emissions related to energy consumption (scope 2) is high for China and India compared to others.
Fig 1. Scope-based analysis of top construction markets B. Production and Consumption-based Analysis: Same as the scope-based analysis, the production-consumption based carbon footprint (see Fig 2), shows how the average direct and indirect carbon emissions of the construction sector of top construction regions have been changed. The direct emissions in this analysis correspond to the Scope 1 emissions in the previous scope-based analysis. Indirect emissions are shown in two parts, inside and outside the country (Global). Japan produces the highest carbon emissions directly while China has the lowest amount of carbon generated directly. The highest carbon emissions produced indirectly within country belongs to China whereas Canada has the lowest emission indirectly. This is while China has the lowest emissions released indirectly outside of the China and Canada is responsible for the highest ones. Fig. 2 also indicates the rates that each country is able to control over the carbon emissions within sector itself and its domestic suppliers based on regulations (the blue and orange areas of the construction sector in each country). Carbon emissions of both the construction sector and the suppliers inside each country can be more controlled by policies. For this reason, China, India, and USA should perform serious environmental policies to reduce the carbon emissions inside their regions respectively.
0% 10% 20% 30% 40% 50% 60% 70% 80% 90% 100%
China USA India Japan Canada Scope 1 Scope 2 Scope 3
Fig 2. Production vs consumption-based analysis of top construction markets
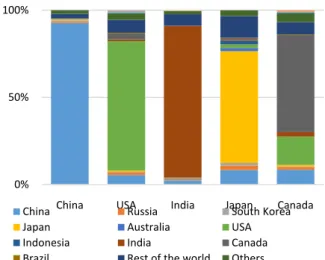
C. Global Impact Distribution Analysis:
Global impact analysis shows which countries, on the global scale, are indirectly affected by the construction sector carbon emissions due to the construction activities inside each country. Fig 3 shows top 10 countries with the highest carbon emissions due to the production of the construction sector in each of considered countries. Among these countries, those that are outside of the 40 countries defined by the WIOD are categorized as the rest of the world. In addition, countries which are among WIOD list but outside of these 10 countries shown with the name of “others”. With the help of this analysis, it has been shown that for the construction sector of China, Rest of the World, Others, and Russia are the major countries having impact on the carbon emissions of China. Rest of the world, China, others, and Canada are the countries with the highest carbon emissions in the supply chain of the United States construction sector. Rest of the World, China, others, and Russia are responsible countries for carbon emission of construction sector of India. For Japan, Rest of the World, China, others, and Russia and finally for Canada, United States, China, Rest of the World, others, and India have the significant role in carbon emission amount.
Fig 3. Global impact distribution analysis of top construction markets
V. CONCLUSION
This study applied global input-output analysis by using G-CAT to calculate the national and global carbon footprint of the construction industry in world top construction markets. We focused on construction industry since it is one of the main industries which has a continuosly growth worldwide. Nowadays, countries’ industrial strategy is towards investing on construction sector that can deliver significant boost in economy. China, USA, India, Japan, and Canada are predicted to have the largest global share in construction market in 2020. Scope-based, production-consumption based, and global impact analyses show how sector's average carbon emissions have been changed between 2000 and 2009. Carbon emissions related to scope 2 and 3 correspond to the great portion of total emissions of the industry. The main emissions for construction sector is centralized in supply chain for all countries. In addition, emissions produced by construction activities within the industry is significant for Japan, Canada, and USA. On the other hand, carbon emissions related in scope 2 is higher for China and India in comparison to the others. Japan produces the highest carbon emission directly while China has the lowest amount of carbon generated directly. China produces the highest carbon emissions indirectly outside of construction sector but inside the country whereas Canada has the lowest emission indirectly within the region. On the other hand, China’s emissions released indirectly by other countries’ construction sector is the lowest while Canada is responsible for the highest amount. For Canada, with the highest indirect emission in global scale, the associated countries in its supply chain are USA, China, and rest of the world. All of these findings discover spots where the policies should be implemented not only in the construction sector itself but also in the national and global supply chain to reduce the carbon emissions. By setting joint strategies and commitments among leading countries in this industry, governments should together to have a long-term vision and decrease the carbon emissions and as a consequence 0% 10% 20% 30% 40% 50% 60% 70% 80% 90% 100%
China USA India Japan Canada Direct Indirect Indirect(Global)
0% 50% 100%
China USA India Japan Canada
China Russia South Korea
Japan Australia USA
Indonesia India Canada
to control the global climate change over the coming years. In the future research, the authors are suggesting using several MRIO databases such as Eora, WIOD, OECD and EXOBASE 3.4 simultaneously and estimate environmental footprints and socioeconomic impacts of world’s leading construction markets [43-45].
REFERENCES
[1] Brundtland Commission, “Our Common Future,” Apr. 1987.
[2] U. Birleşmiş Milletler Çevre Programı (United Nations Environmental Programme, “Towards a green economy,” 2011.
[3] M. Kucukvar, Life Cycle Sustainability Assessment Framework for the U.S. Built Environment, Doctoral dissertation, Uni. of Central Florida, Orlando, 2013. [4] D. Crosthwaite, “The global construction market: a
cross-sectional analysis,” Constr. Manag. Econ., vol. 18, no. 5, pp. 619–627, 2000.
[5] Tatari O, and Kucukvar M, Eco‐Efficiency of Construction Materials: A Data Envelopment Analysis, J.
Constr. Eng. Manag., vol. 138, no. 6, pp. 733–741, 2012.
[6] O. Tatari and M. Kucukvar, “Sustainability Assessment of U.S. Construction Sectors: Ecosystems Perspective,” J.
Constr. Eng. Manag., vol. 138, no. 8, pp. 918–922, Aug.
2012.
[7] UNEP, “Global Construction 2020: A global forecast for the construction industry over the next decade to 2020,” 2011.
[8] M. Kucukvar, G. Egilmez, and O. Tatari, “Evaluating environmental impacts of alternative construction waste management approaches using supply-chain-linked life-cycle analysis.,” Waste Manag. Res., vol. 32, no. 6, pp. 500–508, 2014.
[9] N. C. Onat, G. Egilmez, and O. Tatari, “Towards greening the U.S. residential building stock: A system dynamics approach,” Build. Environ., vol. 78, pp. 68–80, Aug. 2014. [10] Park YS, Egilmez G, Kucukvar M. Emergy and end-point impact assessment of agricultural and food production in the United States: A supply chain-linked Ecologically-based Life Cycle Assessment. Ecol. Ind., 62:117-37. Mar. 2016.
[11] T. Ercan, N. C. Onat, and O. Tatari, “Investigating carbon footprint reduction potential of public transportation in United States: A system dynamics approach,” J. Clean.
Prod., vol. 133, pp. 1260–1276, 2016.
[12] M. Noori, Y. Zhao, N. C. Onat, S. Gardner, and O. Tatari, “Light-duty electric vehicles to improve the integrity of the electricity grid through Vehicle-to-Grid technology: Analysis of regional net revenue and emissions savings,”
Appl. Energy, vol. 168, pp. 146–158, Apr. 2016.
[13] Alirezaei M, Onat N.C., Tatari O, and M. Abdel-Aty, “The Climate Change-Road Safety-Economy Nexus: A System Dynamics Approach to Understanding Complex Interdependencies,” Systems, vol. 5, no. 1, p. 6, 2017. [14] J. B. Guinee, “Handbook on life cycle assessment
operational guide to the ISO standards,” Int. J. Life Cycle
Assess., vol. 7, no. 5, pp. 311–313, Sep. 2002.
[15] Onat N.C., Noori M, Kucukvar M, Zhao Y., Tatari O., and Chester M, “Exploring the suitability of electric vehicles in the United States,” Energy, vol. 121, pp. 631–642, 2017.
[16] N. C. Onat, M. Kucukvar, and O. Tatari, “Towards Life
Cycle Sustainability Assessment of Alternative Passenger Vehicles,” Sustainability, vol. 6, no. 12, pp. 9305–9342, Dec. 2014.
[17] Y. Zhao, N. C. Onat, M. Kucukvar, and O. Tatari, “Carbon and energy footprints of electric delivery trucks: A hybrid multi-regional input-output life cycle assessment,” Transp. Res. Part D Transp. Environ., vol. 47, pp. 195–207, 2016.
[18] N. C. Onat, M. Kucukvar, and O. Tatari, “Conventional, hybrid, plug-in hybrid or electric vehicles? State-based comparative carbon and energy footprint analysis in the United States,” Appl. Energy, vol. 150, pp. 36–49, Jul. 2015.
[19] N. C. Onat, M. Kucukvar, and O. Tatari, “Uncertainty-embedded dynamic life cycle sustainability assessment framework: An ex-ante perspective on the impacts of alternative vehicle options,” Energy, vol. 112, pp. 715– 728, 2016.
[20] T. Ercan, N. C. Onat, O. Tatari, and J.-D. Mathias, “Public transportation adoption requires a paradigm shift in urban development structure,” J. Clean. Prod., 2016.
[21] W. Kloepffer, “Life cycle sustainability assessment of products,” Int. J. Life Cycle Assess., vol. 13, no. 2, pp. 89– 95, 2008.
[22] N. C. Onat, M. Kucukvar, O. Tatari, and G. Egilmez, “Integration of system dynamics approach toward deepening and broadening the life cycle sustainability assessment framework: a case for electric vehicles,” Int. J.
Life Cycle Assess., vol. 21, no. 7, pp. 1009–1034, Jul.
2016.
[23] N. C. Onat, M. Kucukvar, and O. Tatari, “Integrating triple bottom line input–output analysis into life cycle sustainability assessment framework: the case for US buildings,” Int. J. Life Cycle Assess., vol. 19, no. 8, pp. 1488–1505, Aug. 2014.
[24] N. C. Onat, S. Gumus, M. Kucukvar, and O. Tatari, “Application of the TOPSIS and intuitionistic fuzzy set approaches for ranking the life cycle sustainability performance of alternative vehicle technologies,” Sustain.
Prod. Consum., vol. 6, pp. 12–25, 2016.
[25] M. Kucukvar, M. Noori, G. Egilmez, and O. Tatari, “Stochastic decision modeling for sustainable pavement designs,” Int. J. Life Cycle Assess., Feb. 2014.
[26] N. C. Onat, “Integrated sustainability assessment framework for the U.S. transportation,” University of Central Florida, 2015.
[27] N. C. Onat, M. Kucukvar, O. Tatari, and Q. P. Zheng, “Combined application of multi-criteria optimization and life-cycle sustainability assessment for optimal distribution of alternative passenger cars in U.S.,” J.
Clean. Prod., vol. 112, pp. 291–307, 2016.
[28] M. Kucukvar and O. Tatari, “Towards a triple bottom-line sustainability assessment of the US construction industry,” Int. J. Life Cycle Assess., 2013.
[29] R. E. Miller and P. D. Blair, Input–output analysis:
foundations and extensions, 2nd ed. Cambridge, UK:
Cambridge University Press, 2009.
[30] Carnegie Mellon University Green Design Institute, “Economic Input-Output Life Cycle Assessment (EIO-LCA),” 2008. [Online]. Available: http://www.eiolca.net/index.html.
[31] Kucukvar, M. and Samadi, H, Linking national food production to global supply chain impacts for the energy-climate challenge: the cases of the EU-27 and Turkey. Journal of Cleaner Production, 108, pp.395-408,
Dec.2015.
[32] Onat NC, Kucukvar M, Halog A, Cloutier S. Systems thinking for life cycle sustainability assessment: a review of recent developments, applications, and future perspectives. Sustainability. 9(5):706, April. 2017.
[33] M. Kucukvar and O. Tatari, “Towards a triple bottom-line sustainability assessment of the U.S. construction industry,” Int. J. Life Cycle Assess., vol. 18, no. 5, pp. 958–972, Feb. 2013.
[34] Kucukvar M, Egilmez G, Onat N.C., and H. Samadi, “A global, scope-based carbon footprint modeling for effective carbon reduction policies: Lessons from the Turkish manufacturing,” Sustain. Prod. Consum., vol. 1, pp. 47–66, 2015.
[35] E. G. Hertwich and G. P. Peters, “Carbon Footprint of Nations: A Global, Trade-Linked Analysis,” Environ. Sci.
Technol., vol. 43, no. 16, pp. 6414–6420, Aug. 2009.
[36] E. Dietzenbacher, B. Los, R. Stehrer, M. Timmer, and G. De Vries, “The Construction of World Input–Output Tables in the Wiod Project,” Econ. Syst. Res., vol. 25, no. 1, pp. 71–98, 2013.
[37] W. Leontief, “Environmental Repercussions and the Economic Structure: An Input-Output Approach,” Rev.
Econ. Stat., vol. 52, no. 3, pp. 262–271, 1970.
[38] M. P. Timmer, “The World Input-Output Database (WIOD): Contents, Sources and Methods,” WIOD
Working Paper Number 10, 2012. [Online]. Available:
http://www.wiod.org/publications/papers/wiod10.pdf. [39] Onat NC, Kucukvar M, and O. Tatari, “Scope-based
carbon footprint analysis of U.S. residential and commercial buildings: An input–output hybrid life cycle assessment approach,” Build. Environ., vol. 72, pp. 53–62, 2014.
[40] Shaikh MA, Kucukvar M, Onat NC, Kirkil G. A framework for water and carbon footprint analysis of national electricity production scenarios. Energy., 139:406-21. Nov. 2017.
[41] Gumus S, Kucukvar M, Tatari O. Intuitionistic fuzzy multi-criteria decision making framework based on life cycle environmental, economic and social impacts: The case of US wind energy. Sustainable Production and Consumption,1;8:78-92, Oct. 2016.
[42] Lee KH. Integrating carbon footprint into supply chain management: the case of Hyundai Motor Company (HMC) in the automobile industry. Journal of cleaner production. 19(11):1216-23, Jul. 2011.
[43] Alsamawi A, Murray J, Lenzen M. The employment footprints of nations: Uncovering master servant relationships. Journal of Industrial Ecology, 18(1):59-70. Feb. 2014.
[44] Lenzen M, Geschke A, Abd Rahman MD, Xiao Y, Fry J, Reyes R, Dietzenbacher E, Inomata S, Kanemoto K, Los B, Moran D. The Global MRIO Lab–charting the world economy. Economic Systems Research; 29(2):158-86, Apr. 2017.
[45] Tatari O, Kucukvar M, Onat NC. Towards a triple bottom line life cycle sustainability assessment of buildings. In Science for Sustainable Construction and Manufacturing Workshop, Vol. 1, p. 226, Feb. 2015.