CHEMICAL CHARACTERIZATION OF SINOPEAN ARCHAEOLOGICAL COMMON WARE
A THESIS
SUBMITTED TO THE DEPARTMENT OF CHEMISTRY AND THE INSTITUTE OF ENGINEERING AND SCIENCES
OF BILKENT UNIVERSITY
IN PARTIAL FULFILLMENT OF THE REQUIREMENTS FOR THE DEGREE OF
MASTER OF SCIENCE
By
TUĞBA ARZU ÖZAL AUGUST 2004
I certify that I have read this thesis and that in my opinion it is fully adequate, in scope and in quality , as thesis of degree of Master of Science
Prof. Dr. Hasan N. Erten (Principal Advisor)
I certify that I have read this thesis and that in my opinion it is fully adequate, in scope and in quality , as thesis of degree of Master of Science
Asst. Prof. Dr. Dominique Tezgör-Kassab
I certify that I have read this thesis and that in my opinion it is fully adequate, in scope and in quality , as thesis of degree of Master of Science
Prof. Dr. Hale Göktürk
Approved for the Institute of Engineering and Sciences
Prof. Dr. Mehmet Baray
ABSTRACT
CHEMICAL CHARACTERIZATION OF SINOPEAN
ARCHAEOLOGICAL COMMON WARE
TUĞBA ARZU ÖZAL M.S. in Chemistry
Supervisor: Prof. Dr. Hasan N. Erten August 2004
Chemical characterization of archaeological common wares is important in order to make quantitative explanations about history and trade relations of nations. Chemistry uses a microscopic point of view by applying spectroscopic methods rather than macroscopic studies that archaeologists usually deal in the structural analysis. The present study is done on the common ware samples which were made of raw clays from Demirci, Sinop, Black Sea Coast of Turkey, because of the geopolitical importance of this region having trade routes.
Elemental and mineralogical analyses of the clay-originated common ware samples found in the archaeological excavations and of the clay taken from Demirci region, which locates at almost 15 km southern of Sinop, were made. While the elemental compositions of the samples were obtained by the spectroscopic method, Ray Fluorescence (XRF), the mineral structures were investigated by Powder
X-method. Furthermore, the characteristic reactions (dehydroxylation, decomposition, transformation) that the clays experienced between the temperatures 50 and 1000 oC were determined by Thermal Gravimetric Analysis (TGA). Characterizations of the Sinopean samples were made and the similarity and differences between other samples from different regions were investigated. Besides the provenance characterization, the distinctions between the production and firing techniques were observed.
In addition to the experimental studies, chemometric techniques using statistical methods such as the standard clustering method and principal component analysis (PCA) was also applied to identify the groupings in the set of samples.
As a result of this study, it is observed that the raw clays and ceramic samples have minerals of montmorillonite, quartz, feldspars, pyroxene, calcite and hematite at different amounts. From the mineralogical and elemental data, it is concluded that the color variations are resulted from the calcium element occurring in pyroxene mineral. In the light colored samples, amount of this element and mineral is high whereas it is low in red colored ones.
From the interpretation of elemental data by statistical methods, it is observed that a classification among the Demirci samples is possible according to the function of the pottery. In addition, classification among ceramics from two different regions is possible by the interpretation of chemical analysis, even though the ceramics have the same morphological properties of the same period.
Keywords: X-Ray fluorescence spectroscopy, Powder X-Ray diffraction, Thermal gravimetry, Fourier transform infrared, common ware, Cluster Analysis, Principal Component Analysis, Sinop, clay
ÖZET
SİNOP ARKEOLOJİK GÜNLÜK SERAMİKLERİNİN
KİMYASAL KARAKTERİZASYONU
TUĞBA ARZU ÖZAL Kimya Bölümü Yüksek Lisans Tez Yöneticisi: Prof. Dr. Hasan N. Erten
August 2004
Arkeolojik günlük kullanım kaplarının kimyasal karakterizasyonu tarih ve ulusların ticari ilişkilerini sayısal olarak açıklamak açısından önemlidir. Kimya spektroskopik metodların uygulanmasıyla mikroskopik bir bakış açısı kullanırken, arkeolojistler genellikle yapısal analizlerin uygulandığı makroskopik çalışmalar yaparlar. Bu çalışma Türkiye’nin Karadeniz kıyısında yer alan Sinop Demirci kökenli killer kullanılarak yapılmış günlük kullanım eşyaları üzerine yapılmıştır. Bunun nedeni ise ticaret yollarını üzerinde bulundurmuş bu yörenin jeopolitik önemidir.
Sinop ilimizin yaklaşık 15 km güneyinde bulunan Demirci yöresinden alınmış killerin ve arkeolojik kazılarda bulunmuş olan kil kökenli günlük kullanım kaplarının elementel ve mineralojik analizleri yapılmıştır. Örneklerin elementel komposizyonları X-Işını Floresans (XRF) spektroskopik yöntemiyle elde edilmişken,
IR) spekroskopik metoduyla incelenmiştir. Ayrıca killerin 50 ve 1000 Co arasında geçirdikleri karakteristik reaksiyonlar (dehidroksilasyon, dekompozisyon, transformasyonlar) Termal Gravimetrik Analiz (TGA) ile belirlenmiştir. Sinop örneklerinin karakterizasyonu yapılmış ve farklı bölgelere ait diğer örneklerle arasındaki benzerlik ve farklılıklar araştırılmıştır. Köken karakterizasyonun yanısıra üretim ve pişirme teknikleri incelenmiştir.
Deneysel yöntemlere ek olarak standart kümeleme yöntemi ve temel bileşenlerine ayırma (PCA) gibi istatistiksel methodları uygulayan kemometrik teknikler de örnekler arasındaki gruplanmaları belirlemek için kullanılmıştır.
Bu çalışmanın sonucu olarak, kil ve seramik örneklerin değişen miktarlarda montmorillonit, kuvarz, feldspar, piroksen, kalsit ve hematit minerallerini içerdikleri gözlemlenmiştir. Mineralojik ve elementel data kullanılarak renk değişikliklerinin piroksen minerali içinde bulunan kalsiyum elementinden kaynaklandığı söylenebilir. Açık renkli örneklerde bu elementin miktarı yüksekken kırmızı renklilerde azdır.
Elementel dataların istatistiksel metodlarla yorumlanması sonucunda Demirci örnekleri arasında seramiğin kullanımına bağlı olan bir sınıflandırmanın mümkün olduğu görülmüştür. Ayrıca kimyasal analizlerin yorumlanmasıyla iki farklı yöreden olan seramikler arasında seramikler aynı dönemin şekilsel özelliklerine sahip olsa bile sınıflandırma yapmak mümkündür.
Anahtar Kelimelers: X-Işını Floresans Spektroskopisi, Toz X-Işını Kırınımı, Termal gravimetri, Fourier transform kızıl ötesi, günlük kullanım kapları, KümelemeYöntemi, Temel Bileşenlerine Ayırma Yöntemi, Sinop, kil
ACKNOWLEDGEMENT
I would like to express my deep gratitudes to Prof. Dr. Hasan N. Erten for his encouragement and supervision throughout the course of this study.
I wish to thank Asst. Prof. Dr. Dominique Tezgör-Kassab who has provided me appreciable encouragement, support, and assistance in archaeological concepts and offered fine suggestions during this study.
I also want to thank Abdullah Zararsız and Mehmet Kaplan from Nuclear Research and Training Center of Turkish Atomic Energy Authority, Ankara for providing the XRF facility and for their valuable guidence in XRF Spectroscopy analyses.
I would also like to thank Sergey Vnukov for his advices and his approaches which improve my vision throughout this study.
I am very gratefull to all the department members and my friends for their continuous moral support during my life in Bilkent University.
I reserve my thanks for my love Baran whose unceased sacrifice and support kept me going on.
I would like to express my endless thanks to my family, especially to my mum for supporting me all through my life with her endless love, guidance and encouragement.
TABLE OF CONTENTS
1. INTRODUCTION 1
1.1- Importance of Sinopean Ceramics...………...1
1.2- The Objective………8
1.3- Methods used for Characterization in Literature………10
1.4- Techniques used in The Present Study………...12
1.4.1- X- Ray Fluorescence (XRF)………..13
1.4.2- Powder X- Ray Diffraction (PXRD)……….15
1.4.3- Fourier Transform Infra Red (FTIR) Spectroscopy………...16
1.4.4- Thermal Gravimetric Analysis (TGA)………...17
1.4.5- Statistical Methods……….19
1.4.5.1- Principal Component Analysis (PCA)...20
1.4.5.2- Cluster Analysis...21
1.5- Clay used as Raw Materials ………...22
1.6- Samples...23
2. EXPERIMENTAL 28
2.1- Elemental Analysis by X-Ray Fluorescence (XRF)………...28
2.2- Identification of Minerals By Powder X-Ray Diffraction (PXRD)……....32
2.3- Fourier Transform Infra Red (FT-IR) Spectroscopy Analysis…………...33
2.4- Thermal Gravimetric Analysis (TGA)………34
2.5- Scanning Electron Microscope (SEM)...34
3. RESULTS AND DISCUSSION 35
3.1- Elemental Characterization by X-Ray Fluorescence (XRF)………...…...35
3.2- Mineralogy by Fourier Transform Infra Red (FT-IR) Spectroscopy……..41
3.3- Mineralogy by Powder X-Ray Diffraction (PXRD)………...43
3.4- Reaction Observations by Thermal Gravimetric Analysis (TGA)……….52
3.5- Scanning Electron Microscope (SEM)...53
3.6- Statistical Interpretation...55
LIST OF FIGURES
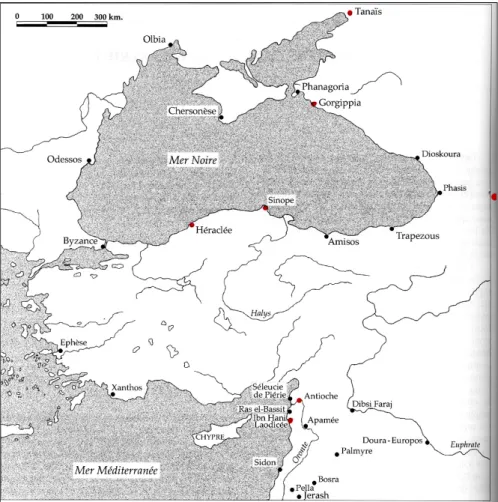
1.1 Map showing the location of Sinop...2
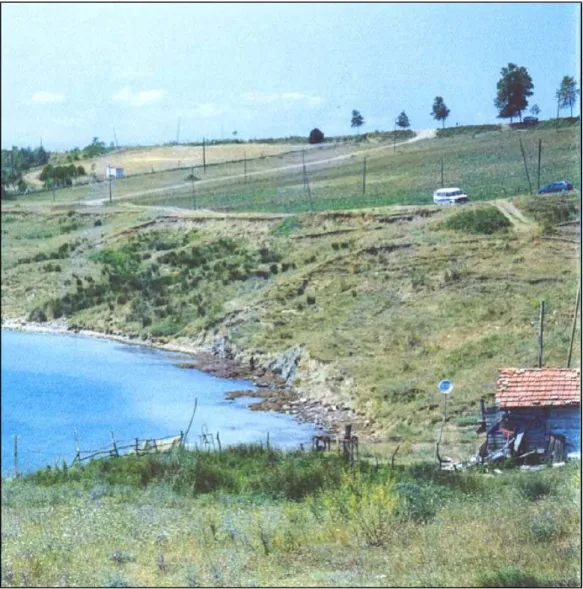
1.2 Demirci valley, excavated area under the investigations...3
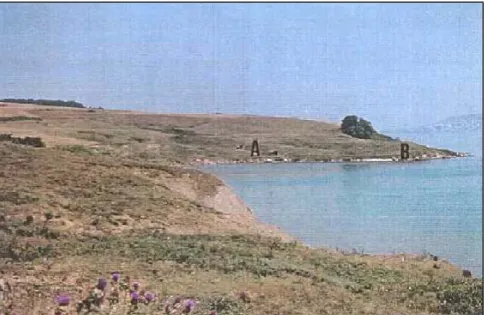
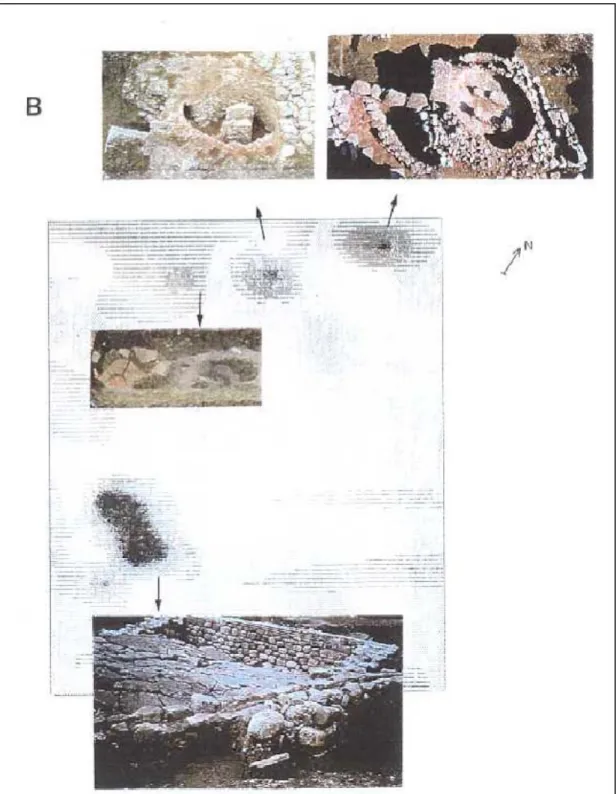
1.3 Photograph of the excavation field, zone A and B...4
1.4 Plan of the excavation field, zone A and B...4
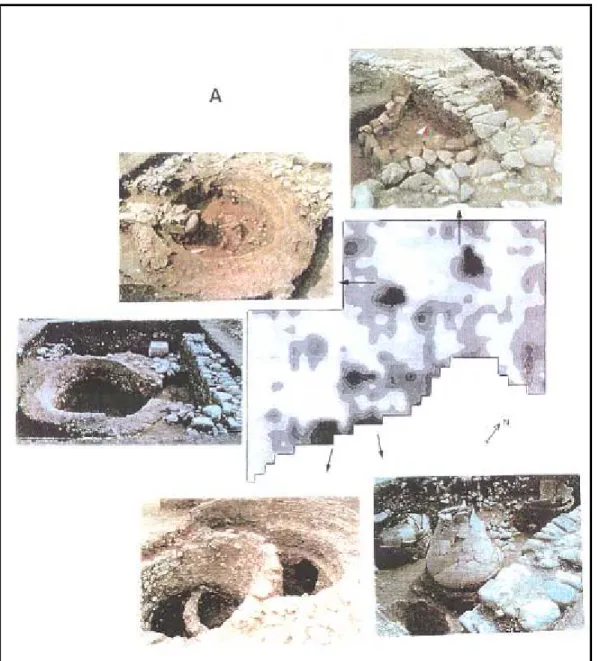
1.5 The geographical survey map of the excavation field, Demirci, Zone A...5
1.6 The geographical survey map of the excavation field, Demirci, Zone B...6
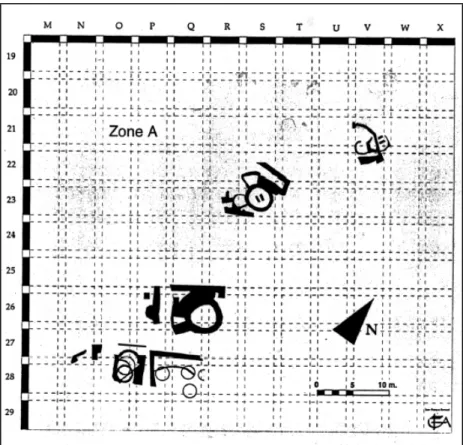
1.7 The plan of Zone A...7
1.8 The plan of Zone B...7
1.9 X- Ray Fluorescence Phenomenon...14
1.10 Bragg Equation...16
1.11 Schematic diagram of TGA...18
1.12 Mass-change versus temperature curve...19
1.13 Photograph of Dm 222.cw.r...24
2.1 Schematic diagram of XRF...29
2.2 XRF outputs as counts at different energy levels for Dm128 rc sample...30
2.3 XRF outputs as counts at different energy levels for sample Dm 37ck.b at three different conditions (a), (b), (c)...32
2.4 Schematic diagram of PXRD...33
3.1 FTIR spectra of the archaeological common ware samples...42
3.2 FTIR spectra of the clay samples...43
3.3 2 theta versus intensity graph of clay samples obtained in PXRD analyses.44 3.4 The PXRD patterns of pink and white colored common wares and white amphora...47
3.5 The PXRD patterns of some red colored common wares...48
3.6 The PXRD patterns of some red and layered common wares...49
3.7 The PXRD patterns of red colored amphora...51
3.8 Temperature versus differential of weight (Dtg) graph for clay samples obtained by the TG analyses...52
3.9 SEM views of Dm 99 rc at 1 and 10 micron scales, respectively...53
3.12 SEM views of Dm 42 ck.r at 1 and 10 micron scales, respectively...54
3.13 Principal component 1 versus 2 obtained from SAS program...57
3.14 Principal component 1 versus 2 obtained from SAS program...58
LIST OF TABLES
1.1 Ceramic and raw clay samples...25
3.1 Element concentrations of the archaeological ceramics obtained by XRF analyses...37
3.2 Element concentrations of the raw clays obtained by XRF analyses...40
3.3 Principal Components from the output of PCA for Figure 3.9...56
3.4 The element concentrations for the Sagalossos ceramics...60
3.5 The SAS System The CLUSTER Procedure Average Linkage Cluster Analysis...63
3.6 Two-Cluster Solution\ by cluster...65
1. INTRODUCTION
1.1- Importance of Sinopean CeramicsSinop, where Demirci is located at, has been an important historical center since it is located at the natural port of a trade route. It is on the Black Sea coast of Turkey, at the Northern part of Turkey as shown in Figure 1.1 . Because it was the most secure and the most active port of the Black Sea in the past, it attracted the attention of different centers of the antique world. In the excavations, remains were found as old as Bronze Age. During the Archaic period with the rising population, new colonies were settled at the Anatolian coasts. They formed their own markets and these colonies, one of which was Sinop, became an important trade center.
In addition, many sites were documented in the Demirci valley, ranging from the Chalcolithic to Ottoman (19th c. A.D.) in date. The most extensive period of settlement was the Classic - early Byzantine (about 4th BC - 7th c. A.D.). This extensive settlement pattern must reflect the expansion of agricultural exploitation of the valley in support of the industrial facilities on the coast. Similar results have been observed in other parts of the Roman world, when long prosperity, improved infrastructure and the increased security of long Roman military domination encouraged widespread rural settlement. [1]
Figure 1.1: Map showing the location of Sinop.
A concentration of pottery kilns along the Sinop peninsula probably supported the storage and distribution of agricultural products in the inner valley. The inner valley appears to have been producing goods for export. Perhaps the farmers of the inner Demirci valley , which is shown in Figure 1.2, produced food that was consumed as part of the broader regional economy, they consumed primarily local goods and commodities. The most important trade goods were wine and olive oil for which amphorae were used as containers. These were the ceramic containers made of clays and they had their specific shape for each center since it was like a label showing the quality of wine or the oil. [1]
Figure 1.2: Demirci valley, excavation field.
The workshop of Demirci was settled 15 kilometers South of Sinop and was an active production center between the 3rd and the 6th c. AD. As a result of excavations, a typology of the amphorae and common wares, which were produced there, could be established. [2]
The Demirci valley was an excellent place to begin systematic investigations because a Roman industrial settlement at its mouth has been under investigation by Dr. D. Kassab-Tezgör in collaboration with the Sinop Museum for several years
Figure 1.3: Photograph of the excavation field, zone A and B.
Figure 1.4: Plan of the excavation field, zone A and B.
The geographical survey maps of the excavation field, Demirci, zone A and B had been obtained as shown in Figure 1.5 and 1.6. These maps were obtained prior to the excavations by GPRS (Geographical Position Remote Sensing) methods. By the help of these, positions of the kilns were determined and excavated accordingly.
The shaded areas on Figure 1.5 and Figure 1.6 shows the positions of archaeological excavation areas as indicated by the arrows in figures.
Figure 1.6: The geographical survey map of the excavation field, Demirci, Zone B.
According to the maps shown above, the plan of these two zones A and B, Figure 1.7 and 1.8, were drawn after the excavations to show the results. The field is divided into squares (as in the plans) to be able to make clear definitions of the locations for the samples taken from the excavation area.
1.2- The Objective
The objective of this study is to investigate the ancient ceramics, especially the common ware samples, originated from Demirci. Chemical analyses were done in this study to make comparisons between common wares, cooking pots and local raw clays.
All the common wares were functional, but since the cooking pots were used for cooking purposes, they should be stronger because of function. This makes the cooking pots have different characteristics from the other common wares. One of the aims of this study is to find out the reasons for these variations in the ceramics. In a previous study, the characterization and provenance determinations of amphora, tubulures, and tiles were done by I. R. Türkmen in 2003 in our laboratories in Bilkent University, Chemistry Department. In that study, amphoras were the origin of the study. [3] In our study, we mainly focused on common wares.
In addition to the identification and characterization of common wares, one other purpose of this study is to see whether scientific methods used in archaeometry correlates with the conclusions obtained by simple archaeological observations in morphology, shape and color.
The characterization of the ceramics made in Sinop has importance because the earliest container production centers of the Black Sea region were Sinop and Pontian Heraclea and they established close economic links with Greek colonies of the Black Sea coast from the early 4th century BC. Sinopean and Heraclean wine and oil were very popular and ceramic containers of the centers were widely spread all over the region. Amphorae produced in different centers that are influenced by the technique and the shape of Sinopean and Heraclean containers, may be considered an evidence of the popularity of these goods. Such replicas had a commercial character usually and were made to facilitate the wine trade for different producers. Besides the trade relations, some scientists suppose that similar features of the vessels were the result of close interaction of potters or that some craftsmen migrated had taken a direct part
in setting up the amphorae manufacture in several places of the northern and eastern coasts. There is a hypothesis about migration of several Sinopean potters to Colchis in the middle 4th century BC, but there are not direct evidences of it.[4] To be able to discuss about this latter hypothesis, common wares should be investigated first. The reason is that common wares are thought not to take part in trades as extensively as amphorae. Common wares and especially the cooking pots generally belong to the archeological excavation fields where they were found. As a result, chemical characterization of the common wares and their comparison with the clay of the area are found to be helpful for the discussions.
In archaeology, grouping and historical classification of the ceramics are generally done according to the appearance of the clay, the shape and morphological properties. However, this kind of classification in some cases may give misleading results and accordingly wrong conclusions. For example, sometimes it may occur that the same shape (type) of ceramic may appear to be produced in two different places (two different origins with different clay compositions according to the different rock formations) when a potter moves from one place to another, because they usually conserve the method of production. Once sensible, functional forms are established they tend to remain the same over a long period of time. Major changes in form appear to have been caused by shifts in the source of supply from one period to another.
The samples investigated in this study have characteristic forms showing the period of production. Despite the fact that they were found as small fragments, from the features, such as curvature, articulated neck, and potential variations of rim, estimations about the full body of the ceramic samples can be done. The Roman and Early Byzantine Pottery have some characteristic forms also. To illustrate, the common ware and amphorae fragments found in excavations at the Mediterranean coasts, such as Anemurium, were investigated and depending on the specific features
Archaeological ceramics produced in Demirci region have diversity in color; while some are pink and white, some are red in color. The differentiation and similarities of color is related with the origin of raw clay, the production technique, and firing temperature. By the chemical characterization techniques applied, the reasons for different colorations can also be found.
1.3- Methods used for Characterization in Literature
In order to characterize the potteries, archaeometrists use different methods. The widely used methods are petrological and chemical methods. Petrology and typology is a common method for archaeologists. The analysis of ceramic fabrics has been revolutionised by the adoption of petrological techniques. These enable visually similar wares to be differentiated, for example by the recording of the quantities of certain ‘heavy minerals’ present in the clay, or by the counting of grains of specified minerals present in a thin section. The allocation of fabrics to sources may be achieved by comparison with kiln-associated fabrics, or with geological samples.
A major disadvantage of petrological analysis is its cost in terms of time and money, which effectively restricts its application. Furthermore, the differentiation of visibly-similar wares is not always successful. It would be difficult to justify the use of petrological techniques to differentiate visibly dissimilar wares, and the use of visual techniques is a necessary prelude to the use of these techniques.
Although it is time and money consuming, in literature it is easy to find examples of successive petrographic characterizations. For example, there is a recent study that blue-and-white pottery from Iran dating to between about AD 1550 and AD 1700 were subjected to petrographic analysis in order to characterize groups which may be attributed to production at specific centres. Five discrete groups were characterized, and these are tentatively attributed to the historically known principal centres of ceramic production. [6]
However, despite the widespread use of petrological analysis some scientists had discussions about how reliable is the point counting which is simply counting the minerals on thin sections applied in petrology. The most used statistical references for point counting show that there are some problems with its use. This is where the concept of "300 points ought be good enough" was expressed in the petrographic literature.[7, 8]
Modern analytical techniques for elemental analysis such as X-Ray Fluorescence (XRF) becomes very important for classifying the origin of materials because they can simultaneously determine several trace elements (variables) in the same sample at very low concentrations. Determination of the elemental compositions can be combined with statistical methods such as principal component analysis used for provenance studies of archaeological ceramics.[9-11] The element concentrations of each sample, can be used as raw data to find the correlation between each pair of elements. This kind of analysis gives an idea about the elemental exchanges within the mineral structures. However, for a statistical analysis to be meaningful there should be many samples from each group of pottery differing in either provenance or structure. Otherwise, some possible errors due to some outliers may cause wrong results in classification. In our studies, we have used more than 50 samples not to have misleading results.
In the literature, XRF studies similar to the one in this study were applied before, such as the Energy Dispersive X-Ray Fluorescence (EDXRF) study of Tupi-Guarani archaeological ceramics. [12] The main objective of that study was to characterize the ceramic paste, as well as the superficial layer of the ceramic fragments, in order to get qualitative information about the pigment composition of the plastic decoration. To make characterization EDXRF methodology was employed to obtain the ceramic paste composition, as well as the superficial layer of
From the critical review of the literature on provenance study of archaeological pottery presented by Kuleff and Djingova, for elemental analysis, the most sophisticated techniques are neutron activation analysis (NAA), ICP-AES, proton-induced X-ray emission, atomic absorption spectrometry, XRF and secondary ion mass spectrometry. [16] On the basis of the literature survey, 23 elements (Al, Ca, Ce, Co, Cs, Cr, Cu, Fe, Hf, La, Mg, Mn, Na, Ni, Rb, Sc, Si, Sm, Sr, Ti, Th, V and Zr) are established to be the most important for the classification of the historical pottery.
Furthermore, application of the thermal gravimetric analyses (TGA) and identification of some specific reactions of some clay types in certain temperature range, allows the comparison of the amounts of minerals like calcite, which has a great influence in color. The thermal behavior of limestone and monocrystalline calcite tempers in a clay matrix and their use in ancient pottery was examined before by Fourier transform infrared spectroscopy (FTIR) and thermospectrometry by Shoval et al. [17]
Scanning electron microscopy (SEM) is another widely used method for the characterization of ceramics. The usefulness of SEM in clay studies is much enhanced by the provision of an add-on energy dispersive X-ray analysis system. Not only can a rapid qualitative analysis of a morphological feature of interest be obtained but with appropriate specimen conditions quantitative chemical analysis is possible and elemental distribution maps may be obtained. In this method, because the electron beam carries a charge, the sample has to be coated with a very thin coat of gold enabling any charge to drain off. The advantages of SEM over conventional microscopy include very high resolution and greater depth of field.
1.4- Techniques used in The Present Study
In this thesis work, chemical characterization is achieved by the determination of the elemental and mineral composition of the archaeological samples found in the excavations.
1.4.1- X- Ray Fluorescence (XRF)
X-ray fluorescence is one of the applications in analytical chemistry for concentration determination of elements. The main advantages of XRF are its inherent specificity and sensitivity. [18]
Each of the atomic elements present in a sample produces a unique set of characteristic X-rays that is a fingerprint for that specific element. Energy Dispersive X-Ray Fluorescence (EDXRF) analyzers determine the chemistry of a sample by measuring the spectrum of the characteristic X-rays emitted by the different elements in the sample when it is illuminated by high energy photons (X-rays or gamma rays).
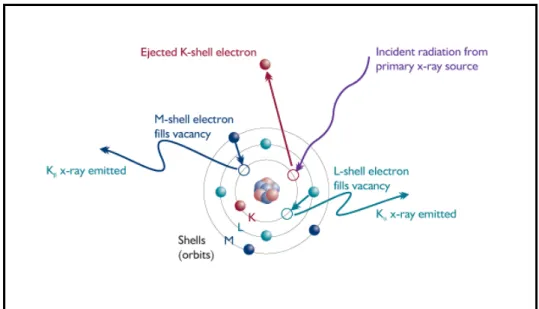
A fluorescent X-ray is created when a photon of sufficient energy strikes an atom in the sample, dislodging an electron from one of the atom's inner orbital shells (lower quantum energy states). The atom regains stability, filling the vacancy left in the inner orbital shell with an electron from one of the atom's higher quantum energy orbital shells. As it is shown in Figure 1.9 , the electron drops to the lower energy state by releasing a fluorescent X-ray, and the energy of this fluorescent X-ray (typically measured in electron volts, eV) is equal to the specific difference in energy between two quantum states of the dropping electron.
Figure 1.9: X- Ray Fluorescence Phenomenon
Because the quantum states of each electron orbital shell in each different type of atom (each of the atomic elements) is different, the energies of the fluorescent X-rays produced by different elements are also different. When a sample is measured via XRF, each element present in the sample emits its own unique fluorescent X-ray energy spectrum. By inducing and measuring a wide spectrum of the range of different characteristic fluorescent X-rays emitted by the different elements in the sample, XRF analyzers can rapidly determine the elements present in the sample and their relative concentrations,in other words, the elemental chemistry of the sample.
By measuring the characteristic fluorescence X-rays emitted by a sample, up to 30 or more elements may be quantified simultaneously. However, it is important to note that light element XRF analysis is best performed in a vacuum chamber in a laboratory environment. The X-rays with energies below 2 keV - including the characteristic X-rays of all elements lighter than sulphur - are largely absorbed in air within a short distance. In tightly controlled lab conditions, XRF may be used to measure elements as light as beryllium and boron in highly uniform samples.
Energy dispersive spectrometers are used to analyze the fluorescent spectra and provide rapid concentration estimates for one or more pre-calibrated elements. Since all elements of the X-ray spectrum are collected and processed simultaneously
instead of sequentially, Energy Dispersive (ED) systems can usually complete analysis much faster than their equivalents. [19] This is why, elemental composition of the Sinopean ancient ceramics and raw clays were determined by the feasible Energy Dispersive X-Ray fluorescence (ED-XRF) measurements.
1.4.2- Powder X- Ray Diffraction (PXRD)
X-Ray Diffraction technique was applied to figure out the mineralogical composition of the archaeological common wares and the clay minerals used during the production of these ceramics. X-Ray diffraction is the principal tool for the identification of crystalline soil minerals.
The diffraction pattern of a pure substance is like a fingerprint of the substance. In other words, for a pure substance there is only one specific pattern that it always gives. When there is a mixture of substances, as in the composition of clay or ceramic, each substance (minerals) produces its pattern independent of others present.
The theory of operation of XRD is that when X-ray radiation passes through matter, the radiation interacts with the electrons in the atoms, resulting in scattering of the radiation. If the atoms are organized in planes (i.e. the matter is crystalline) and the distances between the atoms are of the same magnitude as the wavelength of the X-rays, constructive and destructive interference will occur. This results in diffraction where X-rays are emitted at characteristic angles based on the spaces between the atoms organized in crystalline structures called planes. Most crystals can have many sets of planes passed through their atoms. Each set of planes has a specific interplanar distance and will give rise to a characteristic angle of diffracted X-rays. The relationship between wavelength, atomic spacing (d) and angle was solved geometrically by Bragg as it is shown in the Figure 1.10.
Figure 1.10: Bragg Equation
If the wavelength is known (depends on the type of X-ray tube used) and the angle can be measured (with a camera or diffractometer) then the interplanar distance can be calculated from the Bragg equation. A set of d-spaces obtained from a single compound will represent the set of planes that can be passed through the atoms and can be used for comparison with sets of d-spaces obtained from standard compounds.
In this study, mineral compositions were determined by the peak fit (search-match) method to the well-defined mineral positions and intensities by Power X-Ray Diffraction (PXRD) method. In this method powders of crystalline materials diffract X-rays. PXRD provides less information than single crystal diffraction, but since it is much faster and simpler method, it is widely used. The identity of the clay fraction and powdered ceramics can be confirmed by powder diffraction. Moreover, the peak area can be related to the amount of each component present in the analyzed sample. In addition, XRD spectra of the clay samples can provide information about the possible structural changes taking place in clay lattice during firing.
1.4.3- Fourier Transform Infra Red (FTIR) Spectroscopy
Fourier Transform Infrared (FTIR) spectroscopy was also used as a complementary method to determine mineral structures and the similarities and diversities between the clays and the common wares. Since the infrared absorption
spectroscopy is rapid, economical and nondestructive method universally applicable to structural analysis, the technique is so versatile that it can be used both as a source of the physical parameters of crystal lattice determinations, and as a means of eliciting purely empirical qualitative relationships between specimens. It is an intrinsically simple technique that deserves to be more widely used in clay mineralogy and soil science.
The absorption of infrared radiation by clay minerals depends critically on atomic mass, and the length, strength and force constants of inter atomic bonds in the structure of these minerals. It is also controlled by the constraints of the overall symmetry of the unit cell, and the local site symmetry of each atom within the unit cell. In addition, the absorption of infrared radiation is also strongly influenced by the degree of crystalline order (Lazarev, 1974) and the size and the shape of the mineral particles (Farmer and Russell, 1966; Rendon and Serna, 1981; Serna et al., 1982). Absorption bands of adsorbed molecular water appearing at 3400 and 1630 cm-1 and C-H absorption bands at 2850-2960 cm-1, which arise from organic
contaminants, can be minimized by pretreatment. [20]
1.4.4- Thermal Gravimetric Analysis (TGA)
Thermal Gravimetric Analysis (TGA) is used to examine the process of mass changes as a function of time, temperature and other environment conditions that may be created within the apparatus as shown in Figure 1.11. Temperature changes by the heat applied in the high temperature furnace. Then the sample undergoes some reactions according to the conditions created in the closed apparatus by purging an oxidizing or inert gas. As a result, the balance senses the differentiations occurring in mass and they are processed by software on a computer.
Figure 1.11: Schematic diagram of TGA
Thermogravimetry (TG) differs slightly from other thermal analysis techniques in that recorded data includes the change in sample mass as a function of temperature. The change in mass versus temperature curve provides information concerning the thermal stability and composition of the initial sample, as well as the thermal stability and composition of any intermediate compounds that may be formed when a specimen is heated or cooled under uniform conditions. To produce this information, the sample must evolve a volatile product, which can originate by various physical or chemical processes.
In a single-stage reaction, like that shown in Figure 1.12 , two temperatures are selected off of the mass-change versus temperature curve: Ti, the inital temperature
at which the cumulative mass-change reaches a magnitude that the thermobalance can detect, and Tf, the final temperature at which the cumulative mass-change first
Figure 1.12: Mass-change versus temperature curve
The TGA data is also represented in its first derivative or differential thermal gravimetry (DTG) format. In this format it is easier to identify the reactions occuring during heating.
1.4.5- Statistical Methods
Statistical treatment of the analytical data is a widely used approach in archaeology and in all other sciences. Since it is difficult to deal with thousands of variables obtained from the experimental results, statistical analyses are used as complementary methods for the interpretation of the data obtained by chemical analysis. For this purposes special software packages were improved. The main applications of factor analytic techniques are to reduce the number of variables and to detect structure in the relationships between variables, that is to classify variables.
In this study, two of the statistical methods; principal component analysis and cluster analysis, were applied. These two methods are the most commonly used ones for the archaeological purposes.[21-24] The experimental data are used in both
1.4.5.1- Principal Component Analysis (PCA)
When multivariate data are collected it is common to find some correlated variables. One implication of these correlations is that there will be some redundancy in the information provided by the variables. In the extreme case of two perfectly correlated variables (x and y) one is redundant. Knowing the value of x leaves y with no freedom and vice versa. Principal Components Analysis (PCA) exploits the redundancy in multivariate data, enabling us to pick out patterns (relationships) in the variables and reduce the dimensionality of a data set without a significant loss of information.
PCA is one of a family of related ordination or projection techniques that includes Factor Analysis and Principal Co-ordinates Analysis. It covers standard deviation, covariance, eigenvectors and eigenvalues.
Principal component analysis is a mathematical procedure that transforms a number of (possibly) correlated variables into a (smaller) number of uncorrelated variables called principal components. The objective of principal component analysis is to reduce the dimensionality (number of variables) of the dataset but retain most of the original variability in the data. The first principal component accounts for as much of the variability in the data as possible, and each succeeding component accounts for as much of the remaining variability as possible.
This procedure performs Principal Component Analysis on the selected dataset. A principal component analysis is concerned with explaining the variance covariance structure of a high dimensional random vector through a few linear combinations of the original component variables. Consider a p-dimensional random vector X = ( X1, X2, ..., Xp ). k principal components of X are k (univariate) random
p kp k k k k p p p p X l X l X l X l Y X l X l X l X l Y X l X l X l X l Y + + + = = + + + = = + + + = = ... ... ... 2 2 1 1 ' 2 2 22 1 21 ' 2 2 1 2 12 1 11 ' 1 1 M
The principal components are linear combinations of the original variables which maximize the variance of the linear combination and which have zero covariance (and hence zero correlation) with the previous principal components.
It can be proven that there are exactly p such linear combinations. However, typically, the first few of them explain most of the variance in the original data. So instead of working with all the original variables X1, X2, ..., Xp, you would typically
first perform PCA and then use only first two or three principal components, say Y1
and Y2, in subsequent analysis.
As a result, instead of dealing with numbers of data, as in our case the data consists of hundereds of concentration data of different elements for differnt samples, application of statistical methods such as PCA is the most feasible method to observe the classes and subclasses that may occur as an output data plot of first principal component versus second principal component. Because of its feasibility PCA has a widespread application in different science fields, such as food and chemical engineering, atmospheric science and even by psychologists. [25-28]
1.4.5.2- Cluster Analysis
Cluster analysis classifies a set of observations into two or more mutually exclusive groups based on combinations of internal variables. The purpose of cluster analysis is to discover a system of organizing observations. Cluster analysis seeks to identify a set of groups which both minimize within-group variation and maximize
Cluster analysis starts with a data matrix, where objects are rows and observations are columns. A table is constructed where the numbers in the table are measures of similarity or differences between the two observations.
By the output of cluster analysis obtained by a software, a dendogram is drawn. A dendrogram is a tree diagram often used to represent the results of a cluster analysis in which lines indicate the degree of similarity or dissimilarity between cases.
Since it is easier to recognize the similarities and variations in a picturized form, interpretation of the spectroscopic data by the statistical analysis methods is a very feasible way for chemists. [29] Besides the feasibility of application to chemistry, cluster analyses have also been used for social sciences because of its simplicity. [30]
1.5- Clay used as Raw Materials
Raw clays were used for the manufacture of the common wares in history. Even today they are used as raw materials for the ceramics that is the mostly used material for kitchen and fine wares. For each kind of clay there is a specific temperature for baking, that is vitrification. This is the hardening, tightening and finally the partial glassification of the clay. Vitrification results from fusions or melting of the various components of the clay. The strength of fired clay is increased by the formation of new crystalline growth within the clay body. These lace the structure together, giving it cohesion and strength. Thus, it is very important to reach the vitrification temperature. Potters work with clays with vitrification temperature range as wide as possible. They generally know the properties of the local raw clay they used very well. This is why potters do not want to use a new raw material. However, sometimes to have different properties for usage, such as resistance to heat for cooking pots, some temper may be added to the raw clay used in production. It is another problem to differentiate between natural inclusions and a temper.
1.6- Samples
Samples used in this thesis project are the ceramics from the excavation of Demirci taken from Sinop Museum with permission to be investigated and the raw clays taken from the excavation fields. The ceramic samples and the raw clays are all from the same origin, Demirci.
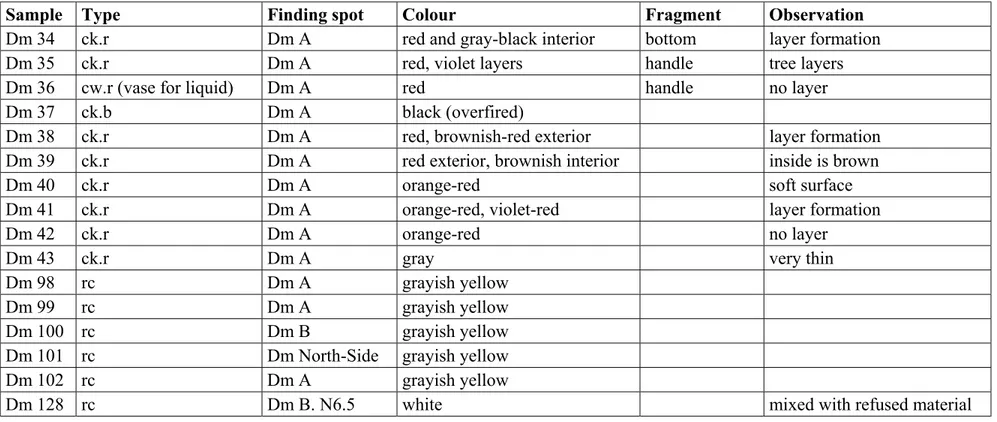
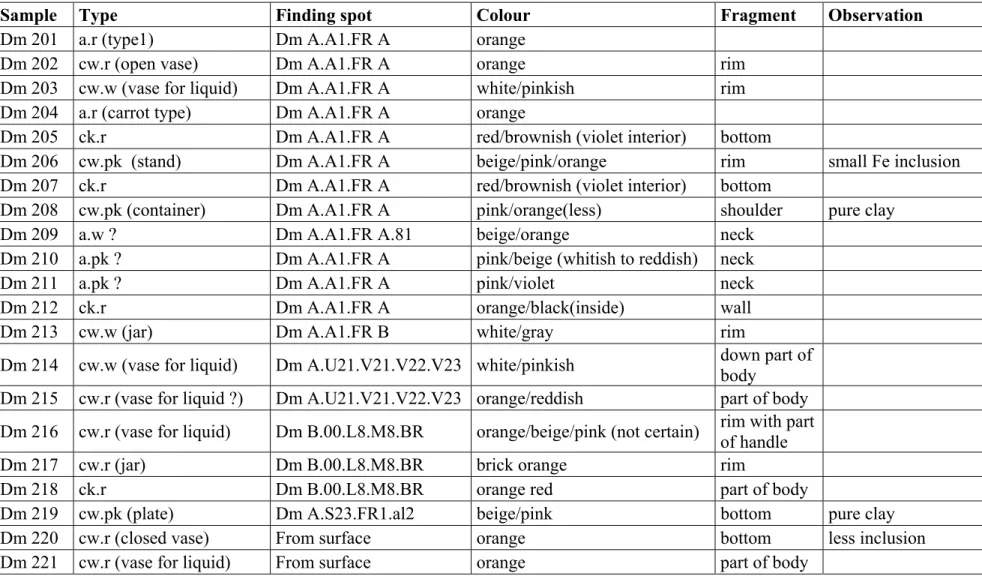
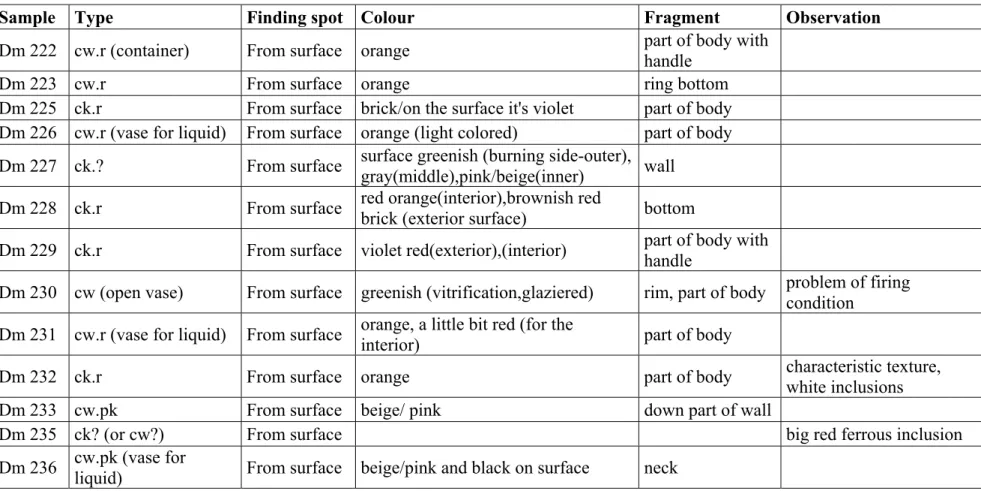
Descriptions of the samples are given in the Table 1.1. In the table, sample names are given such as ‘Dm 222’. The ‘Dm’ stands for the sample location, Demirci. While cataloguing, some numbers were used for identification. The samples used in this study are numbered from Dm 34 to Dm 43 and from Dm 201 to Dm 236. In addition to these ceramic samples, the raw clays were numbered from Dm 98 to Dm 102, and one more clay sample was numbered as Dm 128. Since there are other ceramic samples, especially amphoras, used in a previous study, other numbers were used for those samples used in the previous study.In the table, ‘type’ indicates whether ceramics are amphora, commonware, cooking pot or raw clay. These types are indicated as ‘a’, ‘cw’, ‘ck’, ‘rc’, respectively. Furthermore, identification of the sample is given in paranthesis in the type coloumn when available. In the type column, color is abbreviated as ‘r’ for red, ‘w’ for white, ‘pk’ for pink and ‘b’ for black (overfired) samples.
In the ‘finding spot’ column different zones in the excavation field of Demirci are indicated. The abbreviations used for the finding spots stands as codes used for locations in different zones in the excavation area. For example, Dm A.A1.FR A means the zone A, A1 square, the kiln FR (fırın) while Dm B.00.L8.M8.BR means the zone B, excavated in 2000, between the squares L8 and M8, the vehicle way (abbreviated as BR, from the French word). For further considerations, refer to the plans of zone A and B given on page 7.
appendix for identification. In the Figure 1.12, Dm 222 is shown to illustrate and summerize what the abbreviations stand for.
Abbreviations:
The first letters of the sample name denote sample’s finding spot: Dm: Demirci (Sinop)
The numbers that come next are the sample-numbers used for cataloguing. The letters that come after the sample-number denote the type and color of the
sample: a: amphora rc: raw clay cw: common ware ck: cooking pot
The letters that come after the type denote the color of the sample: r: red w: white pk: pink b: black Eg: Dm 222.cw.r Finding spot : Demirci, from surface Sample number :222
Tpye: common ware Color: red (red clay)
Table 1.1: Ceramic and raw clay samples
Sample Type Finding spot Colour Fragment Observation
Dm 34 ck.r Dm A red and gray-black interior bottom layer formation
Dm 35 ck.r Dm A red, violet layers handle tree layers
Dm 36 cw.r (vase for liquid) Dm A red handle no layer
Dm 37 ck.b Dm A black (overfired)
Dm 38 ck.r Dm A red, brownish-red exterior layer formation
Dm 39 ck.r Dm A red exterior, brownish interior inside is brown
Dm 40 ck.r Dm A orange-red soft surface
Dm 41 ck.r Dm A orange-red, violet-red layer formation
Dm 42 ck.r Dm A orange-red no layer
Dm 43 ck.r Dm A gray very thin
Dm 98 rc Dm A grayish yellow
Dm 99 rc Dm A grayish yellow
Dm 100 rc Dm B grayish yellow
Dm 101 rc Dm North-Side grayish yellow
Dm 102 rc Dm A grayish yellow
Table 1.1(continued): Ceramic and raw clay samples
Sample Type Finding spot Colour Fragment Observation
Dm 201 a.r (type1) Dm A.A1.FR A orange
Dm 202 cw.r (open vase) Dm A.A1.FR A orange rim
Dm 203 cw.w (vase for liquid) Dm A.A1.FR A white/pinkish rim Dm 204 a.r (carrot type) Dm A.A1.FR A orange
Dm 205 ck.r Dm A.A1.FR A red/brownish (violet interior) bottom
Dm 206 cw.pk (stand) Dm A.A1.FR A beige/pink/orange rim small Fe inclusion Dm 207 ck.r Dm A.A1.FR A red/brownish (violet interior) bottom
Dm 208 cw.pk (container) Dm A.A1.FR A pink/orange(less) shoulder pure clay
Dm 209 a.w ? Dm A.A1.FR A.81 beige/orange neck
Dm 210 a.pk ? Dm A.A1.FR A pink/beige (whitish to reddish) neck
Dm 211 a.pk ? Dm A.A1.FR A pink/violet neck
Dm 212 ck.r Dm A.A1.FR A orange/black(inside) wall
Dm 213 cw.w (jar) Dm A.A1.FR B white/gray rim
Dm 214 cw.w (vase for liquid) Dm A.U21.V21.V22.V23 white/pinkish down part of body Dm 215 cw.r (vase for liquid ?) Dm A.U21.V21.V22.V23 orange/reddish part of body Dm 216 cw.r (vase for liquid) Dm B.00.L8.M8.BR orange/beige/pink (not certain) rim with part of handle Dm 217 cw.r (jar) Dm B.00.L8.M8.BR brick orange rim
Dm 218 ck.r Dm B.00.L8.M8.BR orange red part of body
Dm 219 cw.pk (plate) Dm A.S23.FR1.al2 beige/pink bottom pure clay
Table 1.1(continued): Ceramic and raw clay samples
Sample Type Finding spot Colour Fragment Observation
Dm 222 cw.r (container) From surface orange part of body with handle
Dm 223 cw.r From surface orange ring bottom
Dm 225 ck.r From surface brick/on the surface it's violet part of body Dm 226 cw.r (vase for liquid) From surface orange (light colored) part of body
Dm 227 ck.? From surface surface greenish (burning side-outer), gray(middle),pink/beige(inner) wall Dm 228 ck.r From surface red orange(interior),brownish red brick (exterior surface) bottom Dm 229 ck.r From surface violet red(exterior),(interior) part of body with
handle
Dm 230 cw (open vase) From surface greenish (vitrification,glaziered) rim, part of body problem of firing condition
Dm 231 cw.r (vase for liquid) From surface orange, a little bit red (for the
interior) part of body
Dm 232 ck.r From surface orange part of body characteristic texture, white inclusions Dm 233 cw.pk From surface beige/ pink down part of wall
2. EXPERIMENTAL
Elemental and mineral composition of the archaeological common ware and clay samples were investigated by power Ray diffraction and energy dispersive X-Ray fluorescence (ED-XRF) spectroscopy. TGA and FTIR methods were also used in order to investigate the mineral structures of the samples. Prior to the analyses, samples except raw clays were first washed with distilled water in order to eliminate the impurities present on the surface of the ceramics coming from the burial environment. After having been dried completely, they were grounded in a mortar with a pestle. Five gram powder samples were prepared for all the bulk analyses.
2.1- Elemental Analysis by X-Ray Fluorescence (XRF):
The XRF analyses of the samples were done with a high performance Oxford ED-200 EDXRF system located at the Nuclear Research and Training Center of the Turkish Atomic Energy Authority, Ankara. Thirty elements (Mg, Al, Si, P, S, K, Ca, Ti, V, Cr, Mn, Fe, Co, Nd, Sm, Cu, Zn, Ga, As, Se, Rb, Sr, Zr, Pb, Th, Sb, Cs, Ba, La, Ce) were determined throughout the analyses, but only the ones with error less than 20% were included.
The schematic diagram of the experimental setup for the XRF measurements is given in the following figure. In Figure 2.1, as it is shown XRF pellets were positioned in front of a Si (Li) detector and irradiated with X-rays originating from a Rh target. The tube power was 50 W and the maximum current was 1000 µA. Eight different sediment and soil standards were used for the calibration during the measurements and the spectra were acquired and analyzed using Oxford Xpert Ease software.
Figure 2.1: Schematic diagram of XRF
In the XRF studies, first of all counts at different energy levels are obtained. Software processes the counts for specific energy levels of specific elements and give out the results as element concentrations. However, since the energy range changes according to the atom number of an element, the energy range appropriate for a heavy element may not be appropriate for a light element. As a result, for different groups of elements different conditions are used during the analysis. These
To illustrate, the peak at the characteristic energy level for calcium (Ca) is high for the Dm 128rc sample as shown in Figure 2.2. This indicates high concentration of this element in the sample.
Figure 2.2: XRF outputs as counts at different energy levels for Dm128rc sample
In the following figure, Figure 2.3, different graphs showing the counts at different energy levels are given. For one sample, Dm 37 ck.b, to illustrate three of the conditions are shown. For example, to determine the concentration of element silicium (Si) neither the graph in Figure 2.3 part (a) nor (b) was used. The appropriate condition for the Si element is the condition at which the graph in figure 2.3 (c) is obtaned. These conditions are named according to the methodology which varies for different sample types.
(c)
Figure 2.3: XRF outputs as counts at different energy levels for sample Dm 37ck.b at three different conditions (a), (b), (c).
2.2- Identification of Minerals by Powder X-Ray Diffraction (PXRD):
PXRD analysis was carried out using a Rigaku Miniflex model instrument as schematically illustrated in Figure 2.2. X-rays are produced by bombarding metal foil made of Cu with electrons accelerated by high voltage applied in order to emit polychromatic radiation. This radiation is filtered by another metal foil made of Ni in the case of Cu source to produce monochromatic radiation which is Cu Kα1, 2
Figure 2.4: Schematic diagram of PXRD
The source consisted of unfiltered Cu K-alpha radiation, generated in a tube operating at 30 kV and 15 mA. Spectra were recorded with 2 theta values ranging from 2 to 50 degrees with a scanning rate of 2 degrees per second. The d-spacing values related with the peak positions in the spectra, were calculated by using the Bragg equation. The mineral compositions of the samples were only qualitatively determined following a search-match procedure by matching the d-spacing values to the minerals that they belong to.
2.3- Fourier Transform Infra Red (FT-IR) Spectroscopy Analysis:
FTIR spectra are obtained by using Bomem Hartmann and Braun MB-102 model FTIR spectrometer with totally 64 scans and 2 cm-1 resolution. As a pretreatment method, before taking the spectra, KBr and the samples in powder state were put into an oven at 150 Co temperature for 24 hours, and after then they were kept in desiccators to cool down. The aim of this pretreatment is to minimize the absorption that may result from the physically adsorbed water molecules in the samples. If a pretreatment does not apply, the O-H vibrations may lead misleading
2.4- Thermal Gravimetric Analysis (TGA):
Thermal gravimetric analyses were done between the temperatures 50 and 1000 Co with a heating rate of 10 Co per second by using Setaram TG DTA/DSC instrument. The sample mass was varied between 20-30 mg, and alumina holders are used since they are resistant to high temperature applied in the analysis. The dynamic experiments were carried out in nitrogen atmosphere with a flow rate of approximately 80mL per minute.
2.5- Scanning Electron Microscope (SEM)
Scanning electron microscopic views of four representative samples were taken. The powder forms of the four samples; Dm 99 rc, Dm 203 cw.w, Dm 36ck.r, and Dm 42 ck.r were used. Since the ceramics were made of clay, to make them inductive there was a pretreatment. In this pretreatment, the powders stuck on sticky carbon bands were covered with gold. After that the SEM views were taken at different scales of 1 and 10 microns. The surface views were obtained to observe the particles and their sizes.
3. RESULTS and DISCUSSION
3.1- Elemental Characterization by X-Ray Fluorescence (XRF):Elemental concentrations of the samples measured by means of XRF analyses are given in Table 3.1 and Table 3.2. In table 3.1, elemental compositions of archaeological ceramics are given while in table 3.2 element concentrations of the raw clay samples are tabulated.
From the investigations of the Table 3.1 and Table 1.1, it is observed that calcium (Ca) is the most important element having influence on color, and its amount varies according to the usage of the ceramic. In the cooking pots, the amount of Ca is around 1-2 % and these ceramic samples have color ranging from red to brownish (dark colors). However, in the common wares and amphora, which are used for purposes other than cooking, the concentration of Ca is higher than 4 % (between 4 and 9 %). Among the latter group of ceramics, color occurs lighter than orange, which is pink to white, at the Ca concentrations around 6 and higher. The higher the amount of Ca, the lighter the color is. For example, when it is more than 8 %, as it is in Dm 213, the color appears to be totally white. There are some outliers from this conclusion. Most probably this is related with the firing conditions, such that overfired Dm 37 has 6.18 % Ca but it has black color.
Even though the Ca has the most influence on color, other elements also have importance. To illustrate, Dm 201 and Dm 208 have almost the same Ca amount (5.6
When Table 3.1 and 3.2 are compared, that is the comparison between ceramics and raw clays; it is observed that in some of the ceramics amount of Ca is more than the amount of Ca in raw clays. Thus, it can be concluded that in white ceramics, some of which has higher Ca than raw clays, calcite might be added from Dm 128 or the excess Ca came from the micritic calcite coming from the burial environment. Considering the results of the other mineralogical analyses, high concentration of Ca in Dm128 originates from the high amount of calcite in it. Since Dm 128 is almost pure calcite, it is totally different than other local raw clays. On the contrary, in cases where there is less Ca than in raw clays, it may be thought that there was leaching process applied during production. However, SEM analysis is required to see whether the Ca came from the micritic calcite from the burial environment or not.
Furthermore, in some of the ceramic samples the layer formation was observed due to the color differences. In these samples the elements varying in amount are not Ca or Fe. The concentrations of some major elements (Mg, Si, K, etc.) differ to small extent and concentrations of some minor elements (Ni, V, Cu, Zn, Rb, Sr) vary in higher extent in between the different layers of a ceramic sample.
The concentration of iron, Fe, which has a great impact on the color of ceramics, was found to be approximately 4% for all samples. This may be an explanation for the occurrence of the similar colors. In addition, it is known that iron element is found in yellow color in oxidizing environment and in red color in reducing environment. Hence, while the color of the common wares varies in red color, the raw clays, which had been used in the production of these common wares, have yellow color. In Dm 128 clay sample, while the percent concentration of iron element was too low, the calcium is dominant so that color of this clay is white. Moreover, elements like copper (Cu), cobalt (Co), chromium (Cr), titanium (Ti), nickel (Ni), and vanadium (V) have impacts on color according to their concentrations. [31]
Table 3.1: Element concentrations of the archaeological ceramics obtained by XRF analyses. Element Mg Al Si K Ca Ti V Fe Ni Cu Zn Rb Sr Zr La Sm Concentration Sample % % % % % % ppm % ppm ppm ppm ppm ppm ppm ppm ppm Dm 34 bottom 0.93 6.44 26.28 0.98 1.81 0.51 115.81 4.26 73.84 34.86 73.73 89.09 156.85 183.63 26.42 7.18 Dm 35 in/out 0.98 6.29 30.09 1.89 1.80 0.46 123.41 4.08 39.40 42.04 81.98 122.99 217.57 170.71 23.08 6.28 Dm 36 1.59 6.62 22.87 0.98 5.94 0.42 107.21 3.96 83.34 34.73 51.09 92.77 315.30 150.27 24.14 6.42 Dm 37 0.92 5.53 28.18 1.65 6.18 0.41 106.60 3.81 93.13 23.27 149.41 107.71 329.75 154.64 28.90 4.95 Dm 38 in 0.94 6.29 31.10 1.30 1.49 0.50 130.46 4.15 63.08 37.73 111.14 106.78 155.87 193.72 26.11 7.03 Dm 38 out 0.86 6.48 29.48 1.22 1.51 0.51 105.28 4.23 86.71 43.23 51.22 101.13 166.86 192.71 26.95 7.27 Dm 39 in/out 0.95 6.08 28.88 1.32 1.14 0.48 115.15 4.20 66.33 46.12 59.89 116.31 155.87 180.44 28.57 6.88 Dm 39 out 0.97 6.34 29.23 1.27 1.14 0.50 113.73 4.27 71.25 41.58 72.78 119.13 158.37 183.22 23.24 6.98 Dm 40 1.39 5.90 23.68 1.32 6.24 0.40 107.03 3.60 92.36 16.89 85.16 96.38 321.33 150.59 26.34 5.27 Dm 41 in 0.84 5.79 33.20 0.99 1.45 0.48 100.23 3.93 437.94 39.34 114.86 97.95 179.32 202.15 24.94 6.71 Dm 41 out 0.98 6.03 32.43 0.58 1.64 0.49 114.16 4.19 109.30 38.12 114.25 100.74 194.92 199.05 23.42 6.78 Dm 42 0.81 6.03 32.72 1.11 1.55 0.49 113.12 4.09 117.38 21.81 71.78 87.27 160.86 216.19 29.08 6.67 Dm 43 in 1.02 6.78 25.47 0.91 2.84 0.48 125.00 4.02 98.55 30.99 94.05 92.15 239.51 184.58 25.07 6.22 Dm 43 out 1.10 6.75 27.72 1.13 2.85 0.48 124.34 4.13 98.33 27.62 104.37 91.62 229.24 187.99 25.07 6.50
Table 3.1 (continued): Element concentrations of the archaeological ceramics obtained by XRF analyses. Element Mg Al Si K Ca Ti V Fe Ni Cu Zn Rb Sr Zr La Sm Concentration Sample % % % % % % ppm % ppm ppm ppm ppm ppm ppm ppm ppm Dm 201 0.91 3.43 15.39 1.02 5.63 0.42 114.58 3.95 42.89 49.50 92.07 101.30 384.17 160.64 26.49 5.85 Dm 202 0.69 3.16 26.06 1.21 1.64 0.53 114.65 4.16 66.79 37.21 78.38 79.39 167.30 226.37 28.62 7.64 Dm 203 0.78 3.16 14.64 1.73 7.27 0.40 122.98 3.61 60.26 33.04 82.44 95.11 351.21 160.52 23.81 4.49 Dm 204 0.76 3.10 20.96 3.05 4.80 0.40 126.89 3.73 23.85 39.35 83.73 101.76 345.46 175.96 26.93 4.64 Dm 205 0.68 2.75 20.23 1.57 1.92 0.45 127.25 4.18 - 47.68 86.13 103.23 134.70 190.11 23.01 5.63 Dm 205 out 0.90 4.56 33.17 1.32 1.93 0.44 119.51 3.95 26.57 40.74 131.67 95.93 130.41 182.83 24.89 5.45 Dm 206 1.34 6.92 27.32 1.32 7.36 0.39 110.29 3.86 21.57 29.01 79.89 75.95 326.65 155.98 25.70 3.29 Dm 207 1.30 7.21 37.21 1.25 1.88 0.47 125.62 4.24 7.50 45.36 89.43 103.84 137.86 241.53 30.86 6.35 Dm 208 1.33 7.53 19.02 1.41 5.65 0.38 111.16 3.50 55.85 46.86 88.87 91.58 404.07 156.32 24.46 2.85 Dm 209 1.27 6.82 29.24 1.84 7.12 0.40 107.24 3.82 366.03 17.82 24.40 83.57 300.39 155.63 29.18 4.74 Dm 210 1.65 7.36 26.89 1.53 7.12 0.42 123.28 3.81 41.04 39.90 91.76 78.06 311.84 155.45 29.47 4.27 Dm 211 1.60 7.08 27.29 1.70 7.72 0.41 126.07 3.78 45.48 38.30 87.33 87.35 305.10 154.66 27.55 4.51 Dm 212 0.97 7.40 32.61 1.58 1.30 0.48 110.46 4.08 28.63 43.97 77.16 103.31 167.59 199.36 25.07 6.24 Dm 213 1.37 7.01 25.74 0.89 8.40 0.39 121.51 3.69 50.42 19.92 69.81 54.16 368.08 152.98 25.91 2.91 Dm 214 1.19 7.27 26.84 1.28 6.84 0.40 107.20 3.84 67.03 32.03 71.83 81.67 332.98 156.06 30.10 3.30 Dm 215 1.48 7.49 25.31 1.51 5.81 0.41 106.77 3.87 44.74 35.88 76.69 99.10 327.38 170.27 26.44 4.88 Dm 216 1.82 7.15 25.58 1.12 6.92 0.42 114.95 3.78 77.92 26.91 79.09 97.24 445.08 153.76 29.60 4.50 Dm 217 1.42 7.57 23.51 1.80 5.90 0.42 109.29 3.81 72.60 26.43 83.64 101.68 304.35 166.34 29.59 5.53 Dm 218 0.97 7.87 30.01 1.51 0.99 0.51 123.39 4.16 85.01 44.94 96.64 119.61 161.60 215.06 29.23 7.22 Dm 219 1.16 8.03 17.75 1.62 6.14 0.41 122.27 3.88 49.65 33.92 92.54 138.34 357.42 171.22 27.58 4.30
Table 3.1 (continued): Element concentrations of the archaeological ceramics obtained by XRF analyses. Element Mg Al Si K Ca Ti V Fe Ni Cu Zn Rb Sr Zr La Sm Concentration Sample % % % % % % ppm % ppm ppm ppm ppm ppm ppm ppm ppm Dm 220 1.29 6.95 22.95 1.26 5.26 0.44 98.39 4.09 56.87 41.88 113.66 101.30 419.22 168.65 26.70 4.99 Dm 221 1.44 8.40 14.71 0.97 4.26 0.47 95.47 4.11 74.68 44.91 94.72 96.68 255.99 168.47 27.38 5.86 Dm 222 1.10 7.17 23.77 - 6.37 0.42 107.52 3.93 55.69 42.05 78.93 104.57 355.83 164.72 28.05 3.78 Dm 223 1.32 7.53 21.95 1.36 5.78 0.42 92.65 3.81 90.46 37.43 85.89 95.32 306.12 166.83 27.65 4.84 Dm 225 0.87 5.01 38.64 1.30 1.47 0.46 91.54 3.64 59.45 27.56 75.29 81.08 172.62 191.45 25.06 6.22 Dm 226 1.12 6.57 27.03 0.34 6.67 0.38 108.05 3.57 42.03 30.57 77.40 91.91 398.14 153.19 26.25 2.89 Dm 227 in 1.18 6.41 27.90 1.42 6.18 0.41 102.60 4.01 105.71 22.57 83.93 90.98 291.59 156.70 21.04 4.15 Dm 227 out 1.04 5.48 25.76 1.48 5.60 0.39 114.76 3.56 74.35 24.30 80.76 97.38 292.23 154.89 26.88 2.94 Dm 228 1.02 8.33 25.14 1.39 2.03 0.49 123.38 4.25 80.17 45.15 80.72 97.22 162.50 187.77 25.34 6.71 Dm 229 0.86 8.47 26.49 1.70 1.70 0.47 109.59 4.24 46.56 48.39 88.65 111.32 158.45 192.21 26.80 6.40 Dm 230 1.24 4.27 32.18 0.86 5.67 0.36 116.25 3.38 53.03 22.85 71.25 78.79 254.36 146.99 22.01 3.33 Dm 231 1.32 6.86 33.97 1.18 4.08 0.44 108.47 3.91 51.70 36.01 83.89 93.85 285.69 183.65 23.54 5.31 Dm 232 0.76 6.57 42.47 1.14 1.98 0.47 96.92 3.60 48.06 33.50 78.99 88.80 168.46 241.36 25.80 6.10 Dm 233 1.27 7.52 24.15 1.34 6.40 0.43 111.42 3.93 79.35 28.85 76.46 105.55 327.05 165.70 25.31 3.88 Dm 235 1.31 7.70 23.86 1.56 4.64 0.45 115.03 4.17 59.36 40.27 94.18 117.22 292.61 167.58 25.25 4.98
Table 3.2: Element concentrations of the raw clays obtained by XRF analyses. Element Mg Al Si K Ca Ti V Fe Ni Cu Zn Rb Sr Zr La Sm Concentration Sample % % % % % % ppm % ppm ppm ppm ppm ppm ppm ppm ppm Dm 98 1.02 6.06 32.54 0.88 3.97 0.44 107.65 3.56 74.81 22.68 32.87 91.74 133.35 216.13 24.40 5.96 Dm 99 0.95 6.72 29.66 1.14 2.19 0.49 111.65 3.98 90.55 21.06 56.02 110.24 120.65 210.44 25.39 6.75 Dm 100 1.08 4.78 32.29 0.93 7.18 0.33 83.51 2.95 26.24 12.10 62.28 61.00 335.65 174.96 26.79 4.02 Dm 101 0.85 6.94 24.95 1.03 3.07 0.50 124.24 4.20 71.81 31.40 48.66 115.25 157.09 179.02 23.07 6.92 Dm 102 0.96 5.00 33.12 1.02 6.01 0.37 83.72 3.28 65.76 23.54 23.40 78.50 256.21 183.42 20.72 3.79 Dm 128 0.79 0.79 - - 33.63 0.10 9.03 1.37 - - - 12.17 517.50 54.23 15.94 4.51 Mean 0.94 5.05 30.51 1.00 9.34 0.37 86.63 3.22 65.83 22.16 44.65 78.15 253.41 169.70 22.72 5.33 Std. Dev. 0.11 2.26 3.38 0.10 12.04 0.15 41.29 1.02 23.95 6.89 16.17 38.05 153.51 59.08 3.91 1.39
3.2- Mineralogy by Fourier Transform Infra Red (FT-IR) Spectroscopy:
Spectra obtained by means of the FTIR analyses were given in Figure 3.1 and in Figure 3.2. While in Figure 3.1 the spectra of some common ware samples were shown, in Figure 3.2 the spectra of the clay samples, which were considered to be used in the production of the common wares, were shown.
FTIR spectroscopy was applied for the ceramic samples numbered from Dm 34 to Dm 43. They are the common ware samples whose colors change between red and black and some of whom are in 2 or 3 layers. The samples whose layer separations were possible were named according to the location of the layer in sample, such as bottom, top, inner, outer. In general, all these samples show similar spectra, with small variations. However, since the bands are broad, it is not easy to differentiate these small variations. This is why PXRD method was applied as a further step.
The IR spectra of the layered samples, for example Dm 34c.r.top (taken from the upper inner layer of Dm34) and Dm34c.r.bottom (belonging to the outer bottom layer) does not show any differences. Thus, it can be concluded that there is not much difference observed by FTIR in mineral structure between layers.
Dm 99, 100, 101, 102 and 128 are the clay samples. The IR spectra of these clay samples show a fingerprint similarity, except the clay sample Dm 128. This similarity shows us that Dm 99,100,101,102 clay samples have the same mineral structure. Different from the others Dm 128 is observed to have much more calcite by looking at the sizes of the characteristic peaks of that mineral at 714, 849, 878, 1428, 1452, 1798, 2516, 2580, 2876 and 2983 cm-1. [20] As a result, Dm 128 can be considered as pure calcite. Besides, in the clay samples the specific spectrum of the montmorillonite mineral is clearly seen. In addition, the peaks at 1088 and 1029 cm-1
4000 2000 0 100 200 300 400
Tr
ans
m
itt
ance
Wavenumber(cm
-1)
Dm43.c.r.out Dm43.c.r.in Dm42.c.r Dm41.c.r.out Dm41.c.r.in Dm40.c.r Dm39.c.r.out Dm39.c.r Dm38.c.r.out Dm38.c.r.in Dm37.c.b Dm36.c.r Dm35.c.r Dm34.c.r.top Dm34.c.r.bottomFigure 3.1: FTIR spectra of the archaeological common ware samples
Furthermore, when the spectra belonging to the clays and to the common wares were compared, the functional calcite peak at 1428 cm-1 was observed in the clay samples whereas it was not observed in the spectra of the common wares. Taking into the consideration that the structure of calcite is damaged above 800 Co, the high firing temperatures or the high temperatures of usage for cooking could be the reason. In addition, the characteristic double peaks of quartz at 800 and 781 cm-1 were observed both in clay and common ware sample spectra.
4000 3500 3000 2500 2000 1500 1000 500 0 100 200 300 Tr an sm itta nc e Wavenumber (cm-1) Dm99.r.c Dm100.r.c Dm101.r.c Dm102.r.c Dm128.r.c
Figure 3.2: FTIR spectra of the clay samples
3.3- Mineralogy by Powder X-Ray Diffraction (PXRD):
Mineral structure of the clay samples were investigated as illustrated in Figure 3.3 obtained from the PXRD analyses. To determine the minerals, 2 theta angles corresponding to the peaks were inserted into the Bragg equation and then d-spacings were calculated. Characteristic d-spacing of the minerals were sought and matched with the spacing of the minerals in the samples. As a result, peaks with d-spacings 3.34, 4.26 and 1.82 specific for quartz mineral are observed in the clay
addition, the d-spacings 3.19, 4.04, 3.78, 2.56 of feldspars can be seen in the diffraction pattern of raw clays as in the figure 3.3. [32]
M: Montmorillonite, Q: Quartz, F: Feldspars, C: Calcite
Figure 3.3: 2 theta versus intensity graph of clay samples obtained in PXRD analyses. 0 10 20 30 40 50 0 2000 4000 6000 8000 10000 12000 14000 16000 18000 20000 22000 24000 26000 28000 C C Q Q Q C C C C Q Q Q Q Q Q Q Q Q C C C C Q Q Q Q Q Q Q Q Q Q Q Q Q Q Q M M M M M M M M C C F F F F F F F F F C C C C C C C C Q CC Q Q Q M C F Q M C C C Q Q Q C Re l. I nte ns ity 2 Theta (degrees) Dm128 Dm98 Dm99 Dm100 Dm101 Dm102
The montmorillonite group comprises a number of clay minerals composed of t-o-t (tetrahedral-octahedral-tetrahedral) layers of both dioctahedral and trioctahedral type. [33]
Quartz is a kind of silica minerals. Virtually no solid solution exits between pyroxene and quartz, because of energetics of exchanging cations between octahedral and tetrahedral sites. Fe2+-Mg2+ substitution affects the stability of quartz and pyroxene. Since these clays are rich in Fe, quartz is dominant as clearly seen from the diffraction patterns.
Calcite is generally the most common carbonate mineral in clays. It has trigonal (rhombohedral) system. In calcite and its isostructural carbonate, substitution is wide spread among the divalent cations. Calcites associated with dolomite can have several percent Mg2+ substitution for Ca2+. [34]
In the Figure 3.3, it can be clearly seen that the PXRD pattern of the sample Dm128 is different than the patterns of other clay samples, Dm 98, 99, 100, 101,and 102. The presence of calcite peaks proves that Dm 128 is almost pure calcite. On the contrary, other raw clays consist of mostly quartz and also feldspars, and montmorillonite minerals. When compared, Dm 100 has more calcite than Dm 98, 99, 101, and 102. In addition, Dm 98 and 99 have the least calcite content. While calcite differs, other minerals seem more or less equal in amount.
The conclusions obtained from PXRD patterns (Figure 3.3) and from FTIR spectra (Figure 3.2) of raw clays are consistent with each other. However, it is rather easy and more convenient to use the PXRD method for mineral determinations for clays since FTIR peaks are broader making them difficult to differentiate. In other words, resolution of PXRD is better, and FTIR can be used as a complementary method.