Dergi web sayfası:
www.agri.ankara.edu.tr/dergi www.agri.ankara.edu.tr/journalJournal homepage:
TARIM BİLİMLERİ DERGİSİ
—
JOURNAL OF AGRICUL
TURAL SCIENCES
22 (2016) 1-8
Determination of the Adulteration of Butter with Margarine by Using
Fat Constants
Deren TAHMAS KAHYAOĞLUa,Songül ÇAKMAKÇIb
a Kastamonu University, Faculty of Engineering and Architecture, Department of Food Science, 37200, Kastamonu, TURKEY b Atatürk University, Faculty of Agriculture, Department of Food Engineering, 25240, Erzurum, TURKEY
ARTICLE INFO
Research Article
Corresponding Author: Songül ÇAKMAKÇI, E-mail: [email protected], Tel: +90 (442) 231 24 91 Received: 31 March 2014, Received in Revised Form: 07 July 2014, Accepted: 15 November 2014
ABSTRACT
This study focused on the adulteration of butter by margarine. The samples of pure butter, pure margarine and replacement of butter with margarine at a ratio of 10, 20, 30, 40, 50, 60, 70, 80 and 90% were prepared and fat constants including the Melting Point (MP), Refractive Index (RI), Reichert-Meissl Number (R-MN), Polenske Number (PN), Saponification Number (SN) and Iodine Number (IN) were measured for 66 samples (2 margarine types × 11 margarine replacements × 3 replicates). The types and addition levels of margarine significantly influenced the MP, R-MN, PN, SN, IN (P<0.01) and RI (P<0.05) of the samples. The fat constants in the samples became closer to margarine by increasing the levels of margarine. For each margarine added samples, the MP, R-MN, SN and IN were found to be statistically significant. According to these results, the MP, R-MN, SN and IN can be reliably used to differentiate margarine added butter from pure butter. The results were also supported by correlation analysis. As a result of this research, taking advantage of the R-MN, the following formula was developed to determine the addition of margarine to butter. Margarine adulteration rate (%)= 100.73 - (3.84 × Reichert-Meissl number), (F= 12830.43**)
Keywords: Butter; Margarine; Adulteration; Analysis; Fat constants
Yağ Sabitleri Kullanılarak Tereyağının Margarinle Tağşişinin Tespiti
ESER BİLGİSİ
Araştırma Makalesi
Sorumlu Yazar: Songül ÇAKMAKÇI, E-posta: [email protected], Tel: +90 (442) 231 24 91 Geliş Tarihi: 31 Mart 2014, Düzeltmelerin Gelişi: 07 Temmuz 2014, Kabul: 15 Kasım 2014
ÖZET
Bu araştırma, margarin ile tereyağının tağşişinin tespitine odaklanmıştır. Yağ örnekleri, saf tereyağından sade margarine kadarki aralıkta, tereyağına % 10, 20, 30, 40, 50, 60, 70, 80 ve 90 margarin katkılanarak hazırlanmıştır. Yağ örneklerinde erime noktası (EN), kırılma indisi (Kİ), Reichert-Meissl sayısı (R-MN), Polenske sayısı (PS), Sabunlaşma sayısı (SS) ve iyot sayısı (İS) tespit edilmiştir. Deneme 2 tip margarin × 11 margarin katkı oranı × 3 tekerrür olarak düzenlenmiş ve toplam 66 örnekte yürütülmüştür. Margarin tipi ve katkı seviyesi örneklerin EN, R-MS, PS, SS, İS (P<0.01) ve Kİ (P<0.05) değerlerini önemli derecede etkilemiştir. Örneklerin yağ sabitleri margarin katkı oranı arttıkça margarine yaklaşmıştır. Margarin ilave edilen her örneğin EN, R-MN, SS ve İS değerleri istatistiki olarak önemli derecede farklı
Ta r ı m B i l i m l e r i D e r g i s i – J o u r n a l o f A g r i c u l t u r a l S c i e n c e s 22 (2016) 1-8
2
1. Introduction
Butter is a type of dairy product which is used directly or as an ingredient in various foods (Mallia et al 2008). Milk fat, which has important macromolecules, affects the nutritional value, texture, flavour and shelf life of a food product (Peggy 2005). Butter is a concentrated source of milk fat (~ 80%) and contains water and non-fat milk solids. Butter contains milk non-fat, non-fatty acids, essential fatty acids, vitamin A, β-carotene and certain minerals. It also contains conjugated linoleic acid, which promotes immunity. As butter is nutritious, it also offers various health benefits. Butter, as well as having a high nutritional value, also has a pleasant taste and aroma. Aside from all the advantages of butter, its price is higher than other oils and fats. For this reason in order to gain illegal profits sometimes it can be mixed with margarine. Although in most cases adulteration of fats and oils does not pose a threat to public health, fundamental rights of consumers (incorrect information and expensive fat) are violated (Ulberth & Buchgraber 2000). Margarine is similar to butter in appearance, but possesses several basic differences with respect to nutritional, rheological, flavour and fatty acid compositional properties. Margarines and their derivatives are added to butter to decrease the cost of butter.
Butter has a pleasant aroma that is unique. In addition, it melts in body temperature and can be digested easily. It plays an important role in human nutrition because it is an important energy source and consists of essential fatty acids. There is currently no knowledge about the level of adulteration, even if there are attempts to gain qualitative information about the level of adulteration on the basis of differences in the physical and chemical properties of butter. This situation leads to cheating the consumers and consumers spend more money, although the adulterated product contains insufficient nutritional
elements. In addition, there are no clear scientific and practical results in case of doubt. Therefore, consumers are often helpless to act. Certain rapid, yet expensive techniques were (Attenuated Total Reflectance-Mid Infrared (ATR-MIR) spectroscopy) studied for rapid estimation of butter adulteration has been used successfully (Koca et al 2010). Differential scanning calorimetry (DSC) technique could be used in order to determine the adulteration of butter with margarine (Aktaş & Kaya 2001). Also, Dıraman (2006) has determined adulteration in the butter and olive oil, by using capillary column gas chromatography method. In order to understand the origins of butter, the most effective methods, qualitative and quantitative determination of sterols and tocopherols are also indicated (Derewiaka et al 2011). However, in this study, fast, cheap and easy methods for understanding the adulteration of butter by margarine were studied. Therefore, this study, in order to solve this problem, was planned to understand the margarine supplement, which is cheaper than butter, on the basis of distinctive characteristics between butter and margarine with the help of fat constants. Fat constants values of milk fat and margarine are very different. For example, Reichert-Meissl Number (R-MN) of butter varies between 17-35 (Metin 2008), but R-MN for vegetable oils maximum is 7 (Kurt et al 2007). Therefore, it is thought that the fat constants values will help determining the adulteration of butter.
2. Material and Methods
2.1. Materials
The butter was produced in the Dairy Plant of Atatürk University. Two different margarines, which are used for cooking (CM) and pastry (PM), were obtained from MARSAN (Food Industry and Trade Joint-stock Company, Adana/Turkey). Butter
bulunmuştur. Bu sonuçlara göre, EN, R-MS, SS ve İS değerleri tereyağı ile margarini ayırt etmede başarıyla kullanılabilir. Bu durum korelasyon analizleri ile de doğrulanmıştır. Bu araştırmanın bir sonucu olarak, tereyağına yapılan margarin tağşişinin anlaşılmasında R-MN ile aşağıda geliştirilen formül avantaj sağlayabilir. Margarin tağşiş oranı (%)= 100.73 - (3.84 × Reichert-Meissl sayısı), (F= 12830.43**)
Anahtar Kelimeler: Tereyağı; Margarin; Tağşiş; Analiz; Yağ sabitleri
Ta r ı m B i l i m l e r i D e r g i s i – J o u r n a l o f A g r i c u l t u r a l S c i e n c e s 22 (2016) 1-8
3
and margarine analysis results are shown in Table1. The samples of pure butter, pure margarine and replacements of butter by margarine at a ratio of 10, 20, 30, 40, 50, 60, 70, 80 and 90% were prepared and certain fat constants including Melting Point (MP), Refractive Index (RI), R-MN, Polenske Number (PN), Saponification Number (SN) and
Iodine Numbers (IN) were measured for 66 samples (2 different types of margarine × 11 different fat varieties × 3 replicates).
2.2. Butter production
Butter making and the stages of preparation of fat samples are shown in Figure 1.
Table 1- Average values of the analysis results of control fats Çizelge 1- Kontrol yağların analiz sonuçları ortalamaları
Fat types Properties B1 PM2 CM3 Dry matter (%) 82.43±2.81 b 85.93±1.92 b 99.83±0.09 a Fat (%) 81.50±2.65 c 85.17±0.76 b 99.50±0.00 a pH 4.46±0.37 a 4.77±0.21 a 4.29±0.04 a Melting point (ºC) 32.87±0.31c 40.10±0.20 b 37.06±0.42 a Refractive index 1.4567± 0.0007 b 1.4619± 0.0016 a 1.4620±0.0013 a Reichert-Meissl number 26.17±0.62 a 0.67± 0.06 b 0.42±0.17 b Polenske number 0.90± 0.10 a 0.22±0.06 b 0.20±0.0 b Saponification number 228.1±2.1 a 196.0±4.7 b 193.7±1.0 b Iodine number 32.35±0.58 b 56.88±1.26 a 56.41±1.10 a
1, butter; 2, pastry margarine; 3, margarine for cooking; different letters represent significant differences among fat types according to the Duncan's Multiple Range Test (P≤0.05); data were reported as mean ± standard deviation (n= 3)
Yeniden yerleştirilmesigereken Şekiller
Figure 1- Fat samples preparation process
Figure 1- Fat samples preparation process Şekil 1- Yağ örnekleri hazırlama işlemi
Ta r ı m B i l i m l e r i D e r g i s i – J o u r n a l o f A g r i c u l t u r a l S c i e n c e s 22 (2016) 1-8
4
2.3. Pure fat analysis
The pH value of the control fat samples was determined electrometrically with a pH meter (HANNA instruments, Italy). Dry matter was found by heating in an oven at 102 °C until a constant weight was obtained. The fat contents (%) of margarine and butter samples were measured using the method of James (1995).
2.4. Preparation for the analysis of fat samples and other physicochemical analysis
Hundred grams or more of butter and margarines were melted and allowed to stand at 45 °C to 55 °C until the water and protein settle to the bottom. The melted fat was filtered through dry paper in a funnel heated by a water jacket and kept in a drying oven at approximately 60 °C. The filtered fat, which is free from turbidity, was poured into a wide-mouth bottle, the bottle was closed and kept in a cool place until it is analysed (Sherman 2009). RI, R-MN, PN, SN and IN analysis of fat samples were determined according to the standard methods (AOAC 1980) and as suggested by Sherman (2009). The melting point and refractive index analysis were made according to Anonymous (2009) and Atamer (1993), respectively.
R-MN is a measure of fatty acids which is volatile, water-soluble, or C4 and C6. PN is a measure of fatty acids which is volatile, water insoluble, or C8, C10, and C12 (Lawson 1995). SN is an indicator of molecular weight or size as a function of the chain lengths of the constituent fatty acids (Lawson 1995). MP is the level at which a solid fat becomes completely liquid and clear. Each individual pure fatty acid has a specific complete MP. Generally, MP increases with the increasing chain length. MP decreases with the increasing ratio of unsaturated fatty acid. IN is a measure of the number of double bonds or the degree of unsaturation (Lawson 1995). RI increases with the chain length and with the increasing unsaturation (Hamm & Hamilton 2000; Metin 2008).
2.5. Statistical analysis
The data was evaluated statistically using the analysis of variance (ANOVA) and the differences
among the means were compared using the Duncan’s multiple range tests (using SPSS statistical software program version 13 (SPSS Inc., Chicago, IL, USA; SPSS 1999). As a result the study, taking the advantage of R-MN, a formula was developed showing the addition of margarine to butter. We found this formula by using the simple linear regression model, which describes the statistical properties of estimators from the simple linear regression estimates, requires the use of a statistical model. Moreover, correlation coefficients were found between fat constants.
3. Results and Discussion
The analysis results of pure butter and pure margarine samples (control samples) are given in Table 1. The types and addition levels of margarine significantly influenced MP, R-MN, PN, SN, IN (P<0.01) RI (P<0.05) of the samples (Table 2). MP, RI, R-MN, PN, SN and IN were found to be 32.72 and 38.59, 1.4567 and 1.4620, 26.18 and 0.55, 0.88 and 0.21, 228.14 and 194.85, 32.36 and 56.65 in butter and margarine, respectively (Table 2). Therefore, the fat constant results mentioned above should be based on determining adulteration and its level. The effects of margarine addition rates on fat constants are shown in Figure 2-6. An increase of 10% altered samples of butter with margarine, PM and CM samples that are connected to both the contribution rate as well as the correlations between the fat constants, respectively, Tables 3 and 4 are given in the bulk.
The fat constants in the samples moved closer to margarine by increasing the levels of margarine. In each sample of added margarine, the MP, R-MN, SN and IN were found to be statistically significant (P<0.01). The fat samples of the rate of margarine contribution and main sources of variation of margarine have been effective on the MP, R-MN, PN, SN and statistically IN (P<0.01), and effective on the RI (P<0.05).
The constant values of fat samples moved closer to those of margarine as the contribution rate of margarine increased. In all contribution rates, MP, R-MN, SN and the IN were statistically different
Ta r ı m B i l i m l e r i D e r g i s i – J o u r n a l o f A g r i c u l t u r a l S c i e n c e s 22 (2016) 1-8
5
Table 2- Average values of the analysis results related with adulterations of butter samples by margarine (n= 6)Çizelge 2- Margarin ile tağşiş yapılan tereyağı örneklerinin analiz sonuçları ortalama değerleri (n= 6)
Margarine addition
ratio (%) Melting point Refractive index numberR-M
Polenske
number S.N. numberIodine
0 32.72±0.19a 1.4567±0.00a 26.18±0.09k 0.88±0.11h 228.14±2.07k 32.36±0.42a 10 33.48±0.40b 1.4573±0.00ab 23.57±0.20j 0.77±0.08g 222.44±1.47j 34.80±1.24b 20 34.06±0.57c 1.4580±0.00bc 20.97±0.48i 0.67±0.09f 219.20±2.41i 37.40±2.12c 30 34.57±0.79d 1.4586±0.00cd 18.42±0.61h 0.58±0.13e 216.92±2.64h 40.51±1.97d 40 35.08±1.14e 1.4590±0.00de 15.98±0.90g 0.55±0.09e 213.89±2.24g 43.26±1.56e 50 35.73±1.11f 1.4596±0.00ef 13.17±0.67f 0.48±0.05d 209.79±2.95f 46.10±1.30f 60 36.44±1.29g 1.4600±0.00g 10.43±0.68e 0.42±0.07c 206.53±2.25e 48.66±0.93g 70 37.00±1.35h 1.4605±0.00gh 8.01±0.58d 0.39±0.03c 203.83±3.02d 50.66±0.57h 80 37.50±1.37i 1.4609±0.00hi 5.16±0.60c 0.30±0.05b 199.87±4.49c 53.15±0.58i 90 38.02±1.49j 1.4614±0.00ij 2.83±0.39b 0.28±0.04b 197.33±4.41b 54.78±0.80j 100 38.59±1.64k 1.4620±0.00j 0.55±0.18a 0.21±0.22a 194.85±3.94a 56.65±1.23k Margarine types (n= 33) CM 34.90±1.52a 1.4600±0.00a 12.80±8.46a 0.52±0.22a 209.36±11.32a 45.84±7.78a PM 36.59±2.44b 1.4590±0.00a 13.61±8.32b 0.48±0.21b 211.15±10.49b 44.77±8.38b
Means followed with the same superscript letter within each column are not significantly different at P<0.01 probability levels; R-M number, Reichert-Meissl number; S.N., saponification number; PM, pastry margarine, CM, margarine for cooking
Figure 2- The effects of margarine contribution rates on the melting point
Şekil 2- Erime noktası üzerine margarin katkı oranının
etkisi Figure 3- The effects of margarine contribution rates on the refractive index
Şekil 3- Kırılma indisi üzerine margarin katkı oranının etkisi
Ta r ı m B i l i m l e r i D e r g i s i – J o u r n a l o f A g r i c u l t u r a l S c i e n c e s 22 (2016) 1-8
6
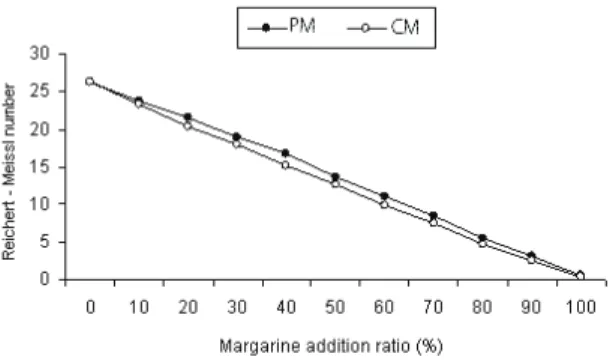
Figure 4- The effects of margarine contribution rates on the Reichert-Meissl number
Şekil 4- Reichert-Meissl sayısı üzerine margarin katkı oranının etkisi
Figure 5- The effects of margarine contribution rates on the iodine number
Şekil 5- İyot sayısı üzerine margarin katkı oranının etkisi
Figure 6- The effects of margarine contribution rates on the saponification number Figure 6- The effects of margarine contribution rates on the saponification number
Şekil 6- Sabunlaşma sayısı üzerine margarin katkı oranının etkisi
from each other. This situation has demonstrated that these four fat constants will give accurate results on detecting the degree to which margarine is added to butter, especially the R-MN (Table 2 and Figure 4).
R-MN of butter and margarine samples were found average as 26.18 and 0.55, respectively (Tables 1 and 2). These values are consistent with the values specified by other researchers (Kurt et al 2007; Metin 2008). R-MN and PN of animal fats decreases with the addition of foreign fat (Kurt et al 2007). RI changes from 1.4538 to 1.4578 in cow milk fat (Metin 2008). If butter is blended with vegetable fat, RI of butter increases. IN of milk fat is between 26-35 and the value is quite low compared to other oils (except coconut and palm kernel oil). IN of the milk fat increases with the addition of vegetable fats (Metin 2008). SN of the milk fat decreases with the addition of other fats, except coconut oil (Kurt et al 2007).
The values are very different from each other will be of great help on the adulteration of butter by margarine. Therefore, the fat constant results mentioned above should be based on determining the adulteration and its level. In this study, the highest correlation coefficient (r= -0.999) was found between the rate of contribution of margarine and R-MN (Table 3 and 4). As a result of this research study, taking advantage of the R-MN, the following Equation was developed showing the contribution of margarine to butter:
Margarine adulteration rate (M.A.R.) (%)= 100.73 - (3.84 × Reichert-Meissl number), (F= 12830.43**)
This Equation was also supported by other fat constants but their correlation coefficients were lower than R-MN’s (Tables 3 and 4), therefore, R-MN should be used. As the following, regression equations are created for the other fat constants: M. A. R. (%)= -416.02 + (13.04 × melting point), (F= 201.94**) M. A. R. (%) = -21350.73 + (14663.50 × refractive index), (F= 193.43**) M. A. R. (%)= 120 – (139.46 × polenske number), (F= 451.53**)
Ta r ı m B i l i m l e r i D e r g i s i – J o u r n a l o f A g r i c u l t u r a l S c i e n c e s 22 (2016) 1-8
7
M. A. R. (%)= 660.73 – (2.90 × saponificationnumber), (F= 1130.20**)
M. A. R. (%)= -124.57 + (3.85 × iodine number), (F= 1571.10**)
However, it should not be used as a criterion for determining the adulteration of a small amount of margarine.
4. Conclusions
According to the results, the four fat constants including MP, R-MN, SN and IN can be reliably used to differentiate the margarine added butter from pure butter. This study has shown that these four fat constants will provide accurate results on detecting the degree to which margarine is added to butter, particularly the related R-MN. Margarine
addition rate if it is over 20%, accurate results can be obtained with this formula. In conclusion, certain objective data and analytical methods were obtained to understand the adulteration with butter by margarine for food analysts.
Acknowledgements
The authors are grateful to the Atatürk University Research Fund for supporting this work (Project Number: BAP 2007/331). The authors also thank MARSAN Foods Industry and Trade Inc. (Adana, Turkey) for supplementing the margarines and for the melting point analysis. The authors also thank Dr. Elif Dağdemir and Dr. Engin Gündoğdu for their help and Prof. Dr. Ömer Cevdet Bilgin for his kind help with the statistical analysis.
Table 3- Some correlations values between PM and calculated fat constants (n= 33) Çizelge 3- Pastacılık margarini ve hesaplanmış yağ sabitleri arasındaki korelasyonlar (n= 33)
M. P. R. I. R-M. N. P. N. S. N. I. N. M. A. R. (%) 0.988** 0.872** -0.999** -0.906** -0.958** 0.992** R. I. 0.838** R-M. N. 0.987** -0.870** P. N. -0.929** -0.719** 0.905** S. N. -0.950** -0.916** 0.958** 0.863** I. N. 0.980** 0.873** -0.992** -0.895** -0.954**
**, correlation is significant at P<0.01 probability levels; M.A.R., margarine addition ratio; M. P., melting point; R. I., refractive index; R-M.N, Reichert-Meissl rumber; P. N., Polenske number; S. N., saponification number; I. N., Iodine number
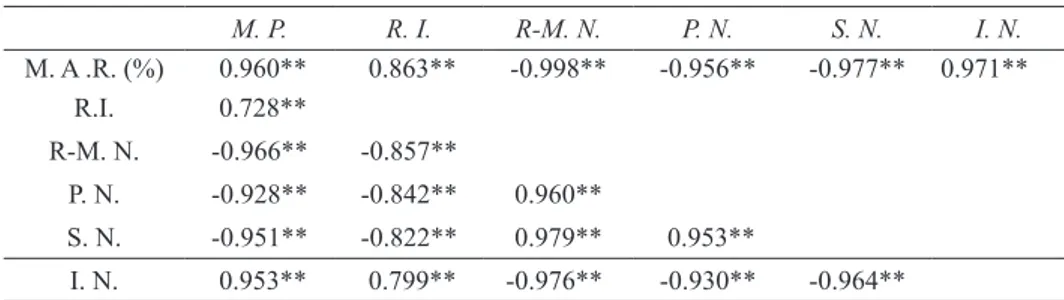
Table 4- Some correlations values between CM and altered fat constants (n= 33) Çizelge 4- Yemeklik margarin ve değişmiş yağ sabitleri arasındaki korelasyonlar (n=33)
M. P. R. I. R-M. N. P. N. S. N. I. N. M. A .R. (%) 0.960** 0.863** -0.998** -0.956** -0.977** 0.971** R.I. 0.728** R-M. N. -0.966** -0.857** P. N. -0.928** -0.842** 0.960** S. N. -0.951** -0.822** 0.979** 0.953** I. N. 0.953** 0.799** -0.976** -0.930** -0.964**
**, correlation is significant at P<0.01 probability levels; M.A.R., margarine addition ratio; M. P., melting point; R. I., refractive index; R-M.N, Reichert-Meissl number; P. N., Polenske number; S. N., saponification number; I. N., Iodine number
Ta r ı m B i l i m l e r i D e r g i s i – J o u r n a l o f A g r i c u l t u r a l S c i e n c e s 22 (2016) 1-8
8
References
Aktaş N & Kaya M (2001). Detection of beef body fat and margarine in butterfat by differential scanning calorimetry. Journal of Thermal Analysis and Calorimetry 66: 795-801
Anonymous (2009). Determination of melting point in fat. Marsan Gıda Sanayi ve Ticaret A.Ş. Laboratory Notes. Adana, Turkey
AOAC (1980). Official methods of analysis. 13th
ed. Association of Official Analytical Chemists, Washington DC
Atamer M (1993). Tereyağı Teknolojisi Uygulama Kılavuzu. Ankara Üniversitesi Ziraat Fakültesi Yayınları No: 1314, Ankara, Türkiye
Derewiaka D, Sosińska E, Obiedziński M, Krogulec A & Czaplicki S (2011). Determination of the adulteration of butter. European Journal of Lipid Science of Technology 113: 1005-1011
Dıraman H (2006). Tereyağı ve zeytinyağında muhtemel tağşişlerin kapiler kolon gaz kromatografisi yöntemi kullanılarak Cis–Trans yağ asitleri düzeyi ile belirlenmesi üzerine bir çalışma. Academic Food Journal 4(23): 3-10
Hamm W & Hamilton R J (2000). Edible Oil Processing. In: Hamilton R J, editor. The Chemistry and Technology of Oils and Fats. Sheffield Academic Press, UK, pp. 18-19
James C S (1995). Analytical Chemistry of Foods. Chapman & Hall, Oxford
Koca N, Kocaoglu-Vurma N A, Harper W J & Rodriguez-Saona L E (2010). Application of
temperature-controlled attenuated total reflectance-mid-infrared (ATR-MIR) spectroscopy for rapid estimation of butter adulteration. Food Chemistry 121: 778-782 Kurt A, Çakmakçı S & Çağlar A (2007). Süt ve Mamulleri
Muayene ve Analiz Metodları Rehberi. Atatürk Üniversitesi Ziraat Fakültesi Yayınları: 18, Ziraat Fakültesi Ofset Baskı, Erzurum, Türkiye
Lawson H (1995). Food Oils and Fats. Technology, Utilisation, and Nutrition. by New York: Chapman & Hall, pp. 30-31; 285-292
Mallia S, Piccinali P, Rehberger B, Badertscher R, Escher F & Schlichtherle-Cerny H (2008). Determination of storage stability of butter enriched with unsaturated fatty acids/conjugated linoleic acids (UFA/CLA) using instrumental and sensory methods. International Dairy Journal 18: 983-993
Metin M (2008). Süt Teknolojisi-Sütün Bileşimi ve İşlenmesi. Ege Üniversitesi Mühendislik Fakültesi Yayın No: 33, Ege Üniversitesi Basımevi, Bornova, İzmir, Türkiye
Pegg R B (2005). Measurement of primary lipid oxidation products. In: Wrolstad RE, Acree TE, Decker EA, Penner MH, Reid D S, Schwartz SJ, Shoemaker CF, Smith DM, Sporns P, editors. Handbook of Food Analytical Chemistry: Water, proteins, enzymes, lipids, and carbohydrates. New York: John Wiley & Sons, Inc, pp. 515–529
Sherman H C (2009). Methods of Organic Analysis. Amazon.co.uk
Ulberth F & Buchgraber M (2000). Authenticity of fats and oils. European Journal of Lipid Science of Technology 102: 687-694