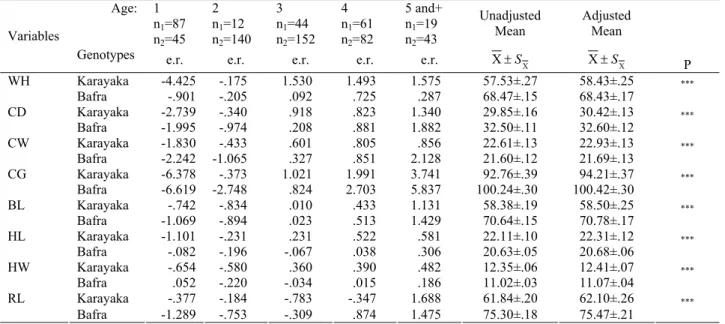
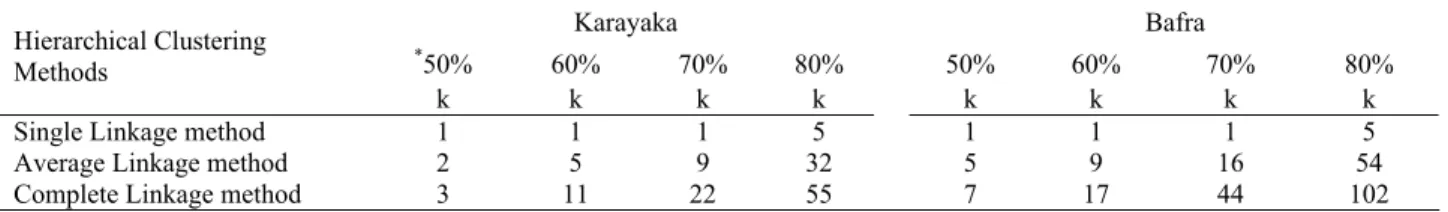
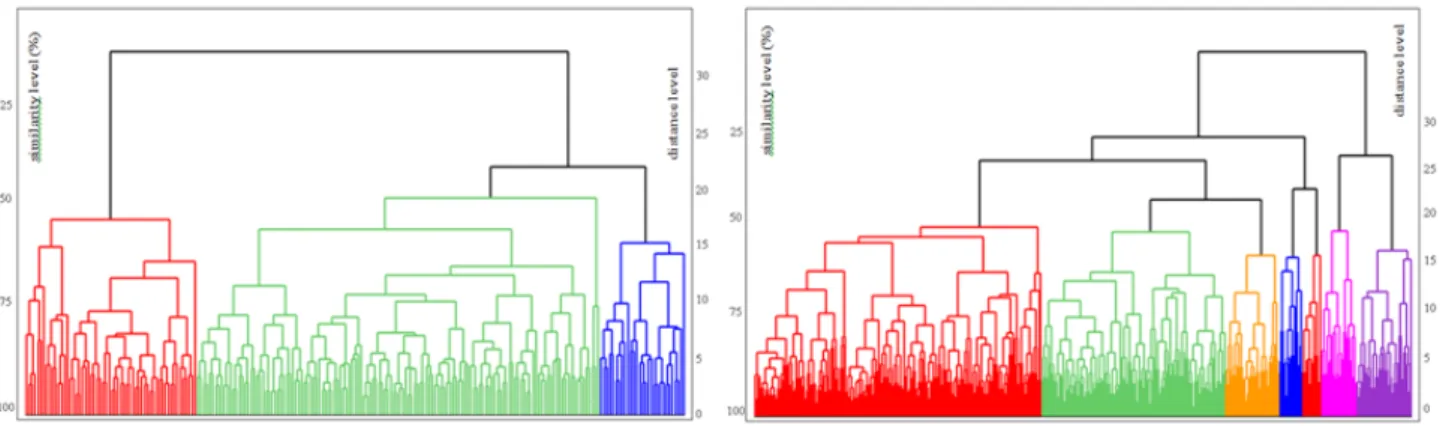
Başlık: Classification of Karayaka and Bafra (Chios x Karayaka B1) sheep according to body measurements by different clustering methodsYazar(lar):KILIÇ, İbrahim;ÖZBEYAZ, CeyhanCilt: 58 Sayı: 3 Sayfa: 203-208 DOI: 10.1501/Vetfak_0000002475 Yayın Tarihi: 20
Tam metin
Şekil
Benzer Belgeler
Twelve (10.3%) patients were with a history of fractures and 105 (89.7%) were without; 48 (41%) patients were clas- sified as having primary osteoporosis, and the remaining 69
If fibrous connective tissue is produced; fibrous inflammation If atrophy occurs; atrophic inflammation.. If the lumen is obstructed; obliterative inflammation If adhesion
H er iki diyette açlık kan şekeri ve insülin düşük olmasına kar şın, düşüş yüksek yağlı diyette daha önemli bulunmuştur.. Açlık glikagon düzeyi ise
For the CNAP (Compound Nerve Action Potential) study of the median nerve, the practitioner first determined the cathode point (mid-palm along the third metacarpal bone) and then
Bu bölümün sonuç kısmında, eserinin Bruce’ın dünyanın gün geçtikçe sekülerleştiğini savunduğu paradigması üzerine kurulu olduğunu belirterek Türkiye’de
Owing to this reason, when they are questioned on the matter why they become self-alienated to their natives resources, though they do not directly blame the authentic scholars,
Bu araştırmada, daha önce Ertürk (2005)’ün Gazi Üniversitesi Eğitim Bilimleri Enstitüsü, Eğitim Yöneticiliği ve Deneticiliği Ana Bilim Dalında hazırlamış
Bilhassa ilk safha an laşılması çok güç bir biçimde geçtiğinden ve Atatürk ekseriyetle bir kaç konu için birden inceleme ve yoklamada bulunduğundan bu
