Adaptive Weighted Performance Criterion for
Artificial Neural Networks
Cagatay BAL
Statistics Department Mugla Sitki Kocman UniversityMugla, Turkey [email protected]
Serdar DEMIR
Statistics Department Mugla Sitki Kocman UniversityMugla, Turkey [email protected] Abstract - Extended Weighted Performance Criterion (EWPC)
which is motivated from Weighted Information Criterion (WIC) has been shown promising results in previous study and results of the application showed that EWPC is capable of giving noticeable performance among other measures. EWPC includes MSE, RMSE, R4MS4E, MAPE, MAE, GMAE, MdAE, MdAPE, NS, MRAE, MdRAE, GMRAE, RMSPE, RMdSPE, SMAPE, SMdAPE, MSMAPE, MASE, and RMSSE with fixed coefficients. In this study, we attempt to improve the performance of EWPC by using adaptive coefficients. The application study which consists of several simulated and real-world time series data is utilized for showing the performance of the criterion. Comparisons of the results show that Adaptive Weighted Performance Criterion (AWPC) is quite preferable as a consistent measure for model selection in Artificial Neural Networks.
Keywords - adaptive, artificial neural networks, weighted criterion, model selection, performance measure.
I. INTRODUCTION
Artificial neural networks (ANN) are non-parametric soft computing methods essentially derived from biological nervous systems, which has been widely accepted as a powerful tool by many researches in varied research fields. Introducing Back Propagation algorithm by Werbos [1] unlocked the learning ability of ANN to handle non-linearity but after Rumelhart and McClelland [2] provided a popular solution for the non-linear programming problem which unrelieved interest attracted to ANN ever since. Also, there is valuable review studies by Zhang et al. [3], Fildes et al. [4] to show the details and wide range of applications of ANN for forecasting areas and operational research concept.
Determining a proper model has always been an issue for non-parametric approaches. Like other non-parametric methods in the literature, ANN also have the model selection problem due to initializing of weights randomly before learning process for each time. Consequently, ANN end up with different architectures for the same data with inconsistent results. To reveal and overcome this weakness, many researchers investigated current solutions and developed different attempts for determining the optimal parameter design of ANN.
Kourentzes and Crone [5] used Auto Correlation Function
(ACF), Partial Auto Correlation Function (PACF) and stepwise linear regression for identifying the significant time lags. Qi and Zhang [6] examined the model selection criteria for time series forecasting with neural networks. Hsu et al. [7] used clustering and Kruskal Wallis (KW) to determine significant variables in neural networks with distributed lag model future selection structure. Khaw et al. [8] utilized the Taguchi method for optimal parameter designs of neural network. Murata et al. [9] proposed Network Information Criterion (NIC) for determination of hidden layer neuron numbers of ANN.
Hyndman and Koehler [10] discussed and compared the measures such as MAPE, MdAPE, sMAPE, sMdAPE, MdRAE, GMRAE, MASE for univariate time series forecasting. Wu et al. [11] proposed a weighted information criterion by unifying AICC and BIC. Taylor [12] introduced Exponentially Weighted Information Criteria (EWIC) for selection of forecasting models. Criterion for model selection in ANN such as Weighted Information Criterion (WIC) which includes AIC, BIC, RMSE, MAPE, DA, and MDA with fixed coefficients [13] and Adaptive Weighted Information Criterion (AWIC) with varying coefficients has been proposed. AWIC calculate the coefficients by using an optimization algorithm that maximize correlation between test set`s partitions [14].
In previous study [15], we introduced an Extended Weighted Performance Criterion (EWPC) by motivating from WIC. EWPC includes MSE, RMSE, R4MS4E, MAPE, MAE, GMAE, MdAE, MdAPE, NS, MRAE, MdRAE, GMRAE, RMSPE, RMdSPE, SMAPE, SMdAPE, MSMAPE, MASE, and RMSSE with fixed coefficients.
Adaptive Weighted Performance Criterion (AWPC) as improved version of EWPC have been developed by using Coefficient of Variation of the performance measures dynamically obtained from repeated error and trial runs to calculate adaptive coefficients. Adaptive coefficients add the abilities of extracting more information from the data and calculating the variation of performance measures’ results to improve consistency with data-focused behavior over EWPC with fixed coefficients.
II. ARTIFICIALNEURALNETWORKS
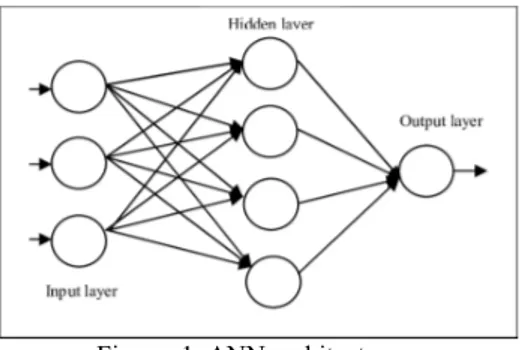
ANN is form of a mathematical model and are known as a general function approximator Zhang et al. [3]. ANN consist of algorithms that mimic the features of brain of human being. These features are generating new knowledge and exploring by learning. The nature of ANN allows to be schemed by its architecture in the form of visual presentation in Figure 1. below.
Figure. 1. ANN architecture.
Learning ability, which is the most important characteristic of ANN allows learning from examples, experiences, patterns, functional relation mapping and so on.
Activation functions enable mapping non-linear relationships between input and target values along with the learning algorithms altogether. The performance of neural networks depends on the suitable choice of activation function. In general, the activation function provides a measure of the non-linearity, so it plays too important role in ANN modelling.
III. PERFORMANCEMEASURESANDAWPC
Determining the best architecture of ANN is very critical problem in the applications. Every performance measure assesses forecasting error from different aspects and various model selection criteria have been used for the determining the best architecture of ANN.
The proposed measurement Adaptive Weighted Performance Criterion (AWPC) includes MSE, RMSE, R4MS4E, MAPE, MAE, GMAE, MdAE, MdAPE, NS, MRAE, MdRAE, GMRAE, RMSPE, RMdSPE, SMAPE, SMdAPE, MSMAPE, MASE, and RMSSE with adaptive coefficients. List of the error types and performance measures used to create AWPC are shown in Table and Table respectively.
TABLE I. List of Error Types.
Error Types Formulas
Error = ( − ) Percentage error =( − ) Symmetric error = | − | ( + ) ∗= , | − | Relative error = | ∗| ∗= Scaled error = | − | 1 − 1 ∑ | − |
TABLE II. List of Performance Measures.
Performance Measures Formulas
Mean Absolute Error MAE = , | |
Median Absolute Error MdAE = , | |
Geometric Mean
Absolute Error GMAE = , | |
Mean Square Error MSE = , ( )
Root Mean Square Error RMSE = , ( )
Fourth Root Mean
Quadrupled Error R4MS4E = , ( )
Mean Absolute
Percentage Error MAPE = , | |
Median Absolute
Percentage Error MdAPE = , | |
Root Mean Square
Percentage Error RMSPE = , ( )
Root Median Square
Percentage Error RMdSPE = , ( )
Symmetric Mean Absolute Percentage Error Modified Symmetric Mean Absolute Percentage Error SMAPE = , ( ) MSMAPE = , ( / ∗) Symmetric Median Absolute Percentage Error SMdAPE = , ( )
Mean Relative Absolute
Error MRAE = , | |
Median Relative
Absolute Error MdRAE = , | |
Geometric Mean
Relative Absolute Error GMRAE = , | | Mean Absolute Scaled
Error MASE = , | |
Root Mean Square
Scaled Error RMSSE = , ( )
Nash Sutcliffe Efficiency NS = 1 −∑∑ (( ))
Well known AIC and BIC, which are parameter penalize based in-sample information criterion, are not included into consideration as performance measures because of their disadvantage of ignoring alternative architectures Bal et al. [16]. Qi and Zhang [6] also stated that these in-sample performance measures are not suitable for out-of-sample forecasting.
The adaptive coefficients of AWPC are calculated with the Coefficient of Variation (CoV) of each performance measure`s correlation between test set observations and predictions. Certain amount of the repetition must be done to collect
sufficient number of results for each performance measure to calculate CoV. Detailed algorithm of AWPC is given below.
Step 1, number of neurons for input and hidden layers are
determined. It can be only 1 architecture design or multiple possible architectures for given intervals of neuron numbers. For example, for input and hidden layer neuron number can differ between 1 – 12 respectively and only 1 neuron for the output layer, total number of 144 possible architecture will be obtained for model selection.
Step 2, model selection has been made for each performance
measure with selecting the architecture with minimum error. Correlation between test set observations and predictions also calculated for each selected architecture.
Step 3, step 2 is repeated times for each performance
measure to obtain correlation vector 1 dimension of each performance measure. (30≤ ≤100)
Step 4, of each performance measure will be calculated as follows; (example for )
=100∗ ( )/ ( )
Step 5, will be obtained by normalizing each values between [0, 1] and rearrange coefficients by using reciprocal of the values. Detailed formulation is given below;
= (1/ )/(∑1∕ ),
(1/ )/(∑1∕ ), (1/ )/(∑1∕ ), …
(1/ )/(∑1∕ )
Step 6, will be calculated with multiplying each performance measure with its corresponding coefficient in
respectively and the formula is given below;
AWPC= ( + + 4 4 +
+ + + + + + +
+ + + + +
+ + )
The purpose of AWPC is adapting the performance measures through the data in the sense of consistency which is calculated by CoV. Consistent performance measures tend to select the models with less instability in every trial. So, the more consistent performance measures on related data become more important in the AWPC formula thus it will play more important role calculating the AWPC error value.
IV. APPLICATION
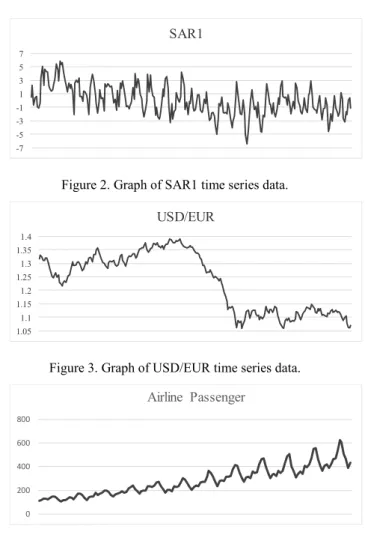
The time series data sets used for applications includes SAR1 (simulated data), USD/EUR exchange rates, and Airplane Passengers data [17]. The graphs of these time series data are shown in Figure 2, Figure 3, and Figure 4, respectively. SAR1 data with a sample size of 257 are generated from first order autoregressive model. USD/EUR data covers a time period of 247 weeks (from 23 March 2012 to 09 December 2016). Airplane Passengers data with 144 observation points are
well-known data for using time series applications.
Figure 2. Graph of SAR1 time series data.
Figure 3. Graph of USD/EUR time series data.
Figure 4. Graph of Airline Passenger time series data. The evaluation process has been based on the trial-error method for model selection of ANN for each dataset. From 1 to 12 number of neurons has been used for input and hidden layer respectively. Output layer has only 1 neuron, which is enough for univariate time series modeling with ANN, for every possible architecture created and therefore 144 possible ANN architecture is obtained for model selection for each evaluation run. Levenberg-Marquardt backpropagation has been set for learning algorithm of network due to its fast convergence abilities. Tangent-sigmoid function has been chosen for hidden layer activation function.
Every dataset divided into two parts for training and testing. The first %85 of the data has been set for training and the last %15 of the data has been set for testing and selection of the best model has been made through the test set performance of the architecture for avoiding the over-fitting problem.
V. RESULTS
Results has been obtained by using MATLAB environment with the algorithm given in Section III. Firstly, 100 runs (repeats) conducted for obtaining coefficients of AWPC for each data sets by using 144 possible architectures. Secondly,
-7 -5 -3 -1 1 3 5 7 SAR1 1.05 1.1 1.15 1.2 1.25 1.3 1.35 1.4 USD/EUR 0 200 400 600 800 Airline Passenger
100 runs also performed to calculate the average of the correlation coefficients between test set and outputs of the selected architectures of ANN via the performance measures. The results of the applications can be seen in Table .
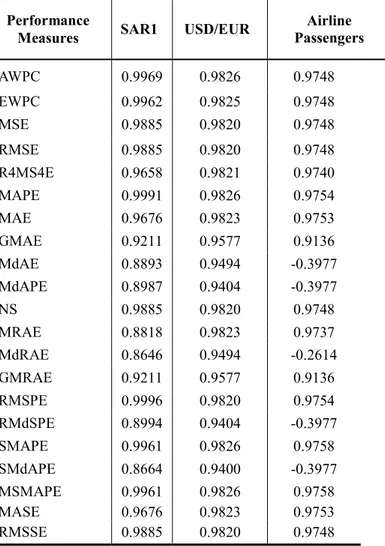
TABLE III. Average correlations of SAR1, USD/EUR and Airline Passengers.
Performance
Measures SAR1 USD/EUR
Airline Passengers AWPC 0.9969 0.9826 0.9748 EWPC 0.9962 0.9825 0.9748 MSE 0.9885 0.9820 0.9748 RMSE 0.9885 0.9820 0.9748 R4MS4E 0.9658 0.9821 0.9740 MAPE 0.9991 0.9826 0.9754 MAE 0.9676 0.9823 0.9753 GMAE 0.9211 0.9577 0.9136 MdAE 0.8893 0.9494 -0.3977 MdAPE 0.8987 0.9404 -0.3977 NS 0.9885 0.9820 0.9748 MRAE 0.8818 0.9823 0.9737 MdRAE 0.8646 0.9494 -0.2614 GMRAE 0.9211 0.9577 0.9136 RMSPE 0.9996 0.9820 0.9754 RMdSPE 0.8994 0.9404 -0.3977 SMAPE 0.9961 0.9826 0.9758 SMdAPE 0.8664 0.9400 -0.3977 MSMAPE 0.9961 0.9826 0.9758 MASE 0.9676 0.9823 0.9753 RMSSE 0.9885 0.9820 0.9748
From Table it can be seen that, AWPC has better average correlations for SAR1 and USD/EUR over its predecessor EWPC. For Airline Passenger data set, both AWPC and EWPC have same performance. Especially, the measures based on median shows poor performance over other measures.
VI. CONCLUSION
Aim of this study is to introduce AWPC and to evaluate its performance for a simulated data and two real-world time series data sets. The application studies show that adaptive coefficients calculated via the structure of data promises at least similar performance as EWPC. For forthcoming studies, it is planned to apply AWPC to more data sets to see its performance on different data structures.
REFERENCES
[1] P.J., Werbos, 1974,” Beyond regression: new tools for
prediction and analysis in the behavioral sciences.” Ph.D. thesis, Harvard University.
[2] Rumelhart DE and McClelland JL, 1986, University of
California San Diego. PDP Research Group. Parallel Distributed Processing: Explorations in the Microstructure of Cognition. MIT Press: Cambridge, MA.
[3] Zhang, G., Patuwo. B.E. and Hu. Y.M.,” Forecasting with artificial neural networks: the state of the art”, International Journal of Forecasting 14, 35–62, 1998.
[4] Fildes, R., Nikolopoulos, K., Crone, S. F., & Syntetos, A. (2008). Forecasting and operational research: a review. Journal of the Operational Research Society, 59(1), 1150–1172.
[5] Crone, S., and Kourentzes, N. 2008,” Forecasting high-frequency time series with neural networks - an analysis of modelling challenges from increasing data frequency.”, International Conference on Data Mining (Las Vegas) - 2008. CSREA Press. [6] Qi, M., & Zhang, G. P. (2001). An investigation of model
selection criteria for neural network time series forecasting. European Journal of Operational Research, 132(3), 666–680. [7] Hsu, C. Y., Lin, S. C., & Chien, C. F. (2015). A back-propagation
neural network with a distributed lag model for semiconductor vendor-managed inventory. Journal of Industrial and Production Engineering, 32(3), 149–161.
[8] Khaw, J. F. C., Lim, B. S., & Lim, L. E. N. (1995). Optimal design of neural networks using the Taguchi method. Neurocomputing, 7(3), 225–245.
[9] N. Murata, S. Yoshizawa and S. Amari, "Network information criterion-determining the number of hidden units for an artificial neural network model," in IEEE Transactions on Neural Networks, vol. 5, no. 6, pp. 865-872, Nov 1994.
[10] Hyndman, R. J., & Koehler, A. B. (2006). Another look at measures of forecast accuracy. International Journal of Forecasting, 22(4), 679–688.
[11] Wu, T.-J., Chen, P., & Yan, Y. (2013). The weighted average information criterion for multivariate regression model selection. Signal Processing, 93(1), 49–55.
[12] Taylor, J. W. (2008). Exponentially weighted information criteria for selecting among forecasting models. International Journal of Forecasting, 24(3), 513–524.
[13] Egrioglu, E., Aladag, C. H., Yolcu, U., Uslu, V. R., & Basaran, M. A. (2009). A new approach based on artificial neural networks for high order multivariate fuzzy time series. Expert Systems with Applications, 36(7), 10589–10594.
[14] Aladag, C. H., Egrioglu, E., Gunay, S., & Basaran, M. A. (2010). Improving weighted information criterion by using optimization. Journal of Computational and Applied Mathematics, 233(10), 2683–2687.
[15] C. Bal, S. Demir, " A Study on Generalization of Extended Weighted Performance Criterion for Artificial Neural Networks", 2017, International Conference on Mathematics and Engineering. [16] Bal, C., Demir, S., Aladag, C.H. (2016). A Comparison of
Different Model Selection Criteria for Forecasting EURO/USD Exchange Rates by Feed Forward Neural Network, Int'l Journal of Computing, Communications & Instrumentation Engg. (IJCCIE) Vol. 3, Issue 2.
[17] Box, G.E.P., Jenkins, G.M., ve Reinsel, G.C. (1976) Time Series Analysis, Forecasting and Control. Third Edition. Holden-Day, 712s.