https://doi.org/10.1177/0020294017702284
70 Measurement and Control l April 2017 Vol 50 No 3
Measurement and Control 2017, Vol. 50(3) 70 –73 © The Author(s) 2017 Reprints and permissions: sagepub.co.uk/journalsPermissions.nav DOI: 10.1177/0020294017702284 journals.sagepub.com/home/mac
Contributed Paper
I. Introduction
Hydraulic turbines of hydroelectric power plants are designed and manufactured according to the head and discharge parameters of a specific plant. Each hydroelectric power plant is different and requires a custom-designed turbine for better performance. Computational fluid dynamics analyses are very useful throughout the design process; however, the results depend heavily on the analysis procedure and expertise of the engineer. Also, the results cannot be evaluated based on an industrial standard. Experimental testing according to International Electrotechnical
Commission (IEC) standards is necessary to ensure performance and reliability.
Once the design is complete, one alternative is to proceed directly to manufacturing and to test the actual turbine on-site, after installation,
according to the IEC 60041 standard. At
this point, if the measured efficiency is lower than expected, the remedy requires equipment re-design. This option is costly especially for larger turbines (i.e. >30 MW). Moreover, some measurements and methods may not be possible on-site.
Another option is to validate the design by model tests. According to the IEC
60193:1999,1 experimental tests of
hydraulic turbines are performed on small-scale models that are geometrically, kinematically, and
dynamically similar to the actual turbines. Parameters such as power, flowrate, efficiency, and specific energy determine the performance of the model. This performance and the cavitation characteristics reflect that of the actual turbines. The same standard also dictates that the test facility meets the minimum criteria for Reynolds number, specific energy, and reference diameter for the turbines to be tested. These are
Reynolds number of 4 × 10⁶, specific
energy of 100 J·kg−1, and reference
diameter of 0.25 m.
It is a fact that model tests increase the upfront cost and lengthen the design period. The cost increase is
approximately 1% for a 300-MW unit and 10% for a 30-MW unit. However, if these units are to be operated a typical 4000 h annually, and if the model tests validate the design efficiency within 1%, then the model test investment is returned approximately in 1 year for a 300-MW turbine and in 10 years for a 30-MW turbine. Therefore, model tests are economically viable especially for large-scale hydraulic turbines.
The hydraulic turbine test facility of the TOBB ETU Hydro Energy Research Center (ETU Hydro) is designed and constructed based on IEC standards, and it is one of a few in the world. This work summarizes the test procedure, types of tests performed on hydraulic
Model Testing of Francis-Type
Hydraulic Turbines
Berat Kavurmaci
TOBB University of Economics and Technology, Ankara, Turkey
Kutay Celebioglu
TOBB University of Economics and Technology, Ankara, Turkey
Selin Aradag
TOBB University of Economics and Technology, Ankara, Turkey
Yigit Tascioglu
TOBB University of Economics and Technology, Ankara, Turkey
[email protected]
Every single turbine is custom-designed specifically to meet the requirements of a hydroelectric power plant. Performance of a designed turbine is validated, to some extent, by computational fluid dynamics simulations; how-ever, experimental testing according to International Electrotechnical Commission standards is necessary to ensure performance and reliability. Model tests are performed on similar, small-scale models at test facilities that are specifi-cally designed for this purpose. This article features one such facility, which is capable of testing the performance and cavitation of Francis-type turbines. Test procedures, measured parameters, measuring instruments, and calibration techniques are explained in detail.
702284MAC0010.1177/0020294017702284Model Testing of Francis-Type Hydraulic TurbinesModel Testing of Francis-Type Hydraulic Turbines research-article2017
Model Testing of Francis-Type Hydraulic Turbines
Contributed Paper
April 2017 Vol 50 No 3 l Measurement and Control 71
turbines, measurement methods, and instruments used for the tests, as well as the capabilities of the facility. The aim of this article is to serve as a practical document for turbine designers and manufacturers.
II. Francis Turbines
Francis-type hydraulic turbines were first developed by J. B. Francis in 1848 in
Lowell, USA.2 In Francis turbines, water
enters the turbine runner in the radial direction and leaves axially. The main parts of a Francis turbine are spiral case, stationary vanes, guide vanes, runner, and draft tube, as shown in Figure 1. The flowrate and accordingly the produced power are adjusted by the guide vanes. The spiral case regulates the velocity profile entering the turbine, whereas the stationary vanes provide the mechanical
strength.3 The most critical part of the
turbine, runner, converts the water energy to mechanical energy and rotates the generator.
III. Hydraulic Turbine Test
Facility
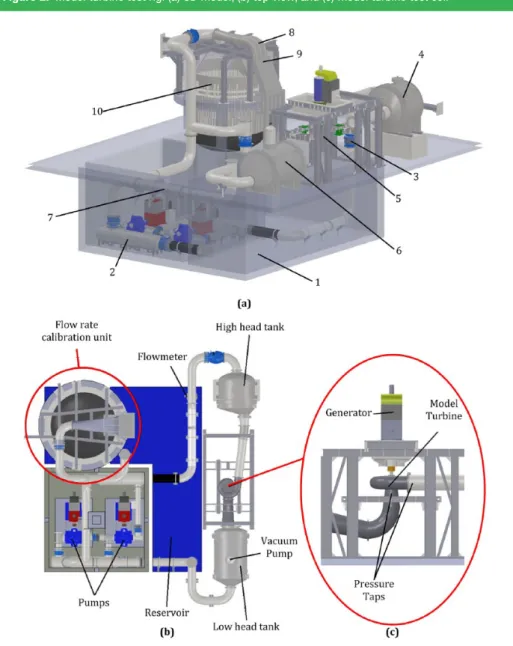
The test facility, shown in Figure 2, is designed to simulate the working conditions of Francis turbines. The facility has two floors and the overall dimensions are 24 m × 24 m × 19 m (length × width × height). At the bottom floor, there exists
a 600-m3 water reservoir and two pumps
that supply the system. The frequency-controlled pumps can be operated in parallel or in series to cover an extended range of heads and flowrates,
respectively, up to 160 m and 3.2 m3·s−1.
The rest of the test rig, namely, the low- and high-head tanks, model turbine test cell, and flowmeter calibration unit are
located on the top floor.4,5
The test cell (Figure 2(c)) consists of the model turbine to be tested and a 2000-kW generator, which has a
maximum rotational speed of 2850 r/min, and an efficiency of 96.9%. It is located between the high- and low-head tanks.
The high-head tank is used to obtain a uniform velocity profile. It decreases velocity and turbulence. The low-head tank is for decreasing pressure at the exit of the model turbine to force cavitation, thanks to an attached vacuum pump (Figure 2(b)).
IV. Test Procedures
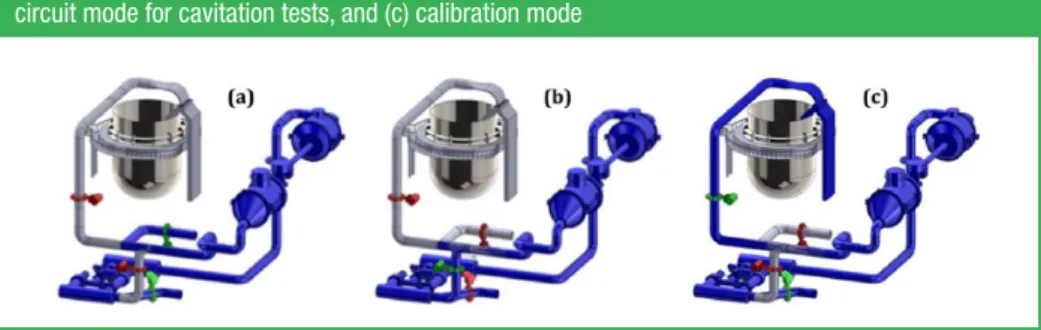
The test rig can be operated in three
different modes.4,5 These modes are
depicted in Figure 3 and explained using the numbered locations in Figure 2(a).
In the open-circuit mode (Figure 3(a)), performance tests of the model turbines
Model Testing of Francis-Type Hydraulic Turbines
Contributed Paper
72 Measurement and Control l April 2017 Vol 50 No 3
are carried out. The main performance parameters are power, flowrate, efficiency, and specific energy. Water flows starting from the reservoir (1) to the pump inlet (2), through the flowmeter (3) to the high-head tank (4). Then, from the high-head tank, water flows through the turbine model (5) and discharges to the low-head tank (6). It finally returns to the reservoir (1).
Cavitation tests are used to determine the onset of cavitation of the actual turbine based on models. The location of the cavitation and the pressure value at
which the cavitation starts are recorded.5
The closed-circuit mode (Figure 3(b)) is for cavitation tests. The vacuum pump on the low-head tank lowers the pressure at the exit of the turbine to force cavitation. Water from the low-head tank (6) is sent to the pump inlet (2) through a closed pipeline (7) instead of the reservoir (1).
According to the IEC 60193 standard, indirect measurement instruments must be calibrated using primary methods based on length, time, and mass. Hence, there also exists a calibration mode. This mode is similar to the open-circuit mode, but water flows to the nozzle (8) instead of returning to the reservoir (1) after exiting the low-head tank (6). Passing through the nozzle (8), water jet hits the flow diverter (9) that directs it to the weighing tank (10) in the calibration system (Figure 3(c)).
V. Measurement and Calibration
Methods
Performance of a model turbine is tested at either constant rotational speed or at constant head. During the tests, guide
vane angles are changed so that the performance is determined for a wide range of head and discharge values. At each test point, based on each head and flowrate combination, absolute pressure at the turbine inlet and exit, flowrate, and torque are measured to calculate the turbine power and efficiency. This section explains the details of the measurements.
A. Flowrate
The flowrate is measured at a single location using an electromagnetic flowmeter, which is 0.2% accurate up to
10 m·s−1 velocity. For this system, the
maximum velocity corresponds to 5
m3·s−1 of flowrate. According to the ISO
6817:19926 standards, the flowmeter
must be full of water during the measurements and the flow must be uniform. Hence, water is allowed to travel through a 4.8-m straight vertical pipe before entering the flowmeter (Figure 2(a)).
The flowmeter is calibrated according
to the ISO 4185:19807 by measuring the
mass of water delivered into a weighing tank in a known time interval. The calibration unit, composed of a weighing tank, a nozzle, and a flow diverter, is shown in Figure 4. Flow enters the nozzle at the maximum flowrate and exits with a thin rectangular section. Before the
calibration, the flow diverter mechanism8
diverts the flow to the reservoir. At the maximum flowrate of the system, flow is diverted into the weighing tank in less than 0.1 s and the weighing tank is filled for at least 30 s, as stated by the standard. The weight of the water is measured with three load cells supporting the tank.
B. Pressure
Pressure measurement is required in order to determine the net positive suction energy (NPSE) and specific energy of the turbine. Absolute pressures at the inlet and exit of the turbine are measured using pressure taps (Figure
2(c)) and a sensor that can measure
pressures up to 32 bars with 0.03% accuracy. To minimize the effect of major pipe losses on the measurement, the taps must be as close to the turbine as possible. There must be at least two pairs of pressure taps at each cross section. At circular cross sections, placement of the taps at the top and bottom points should be avoided due to possible air bubbles and fouling, respectively. The pressure sensor is calibrated using a dead-weight manometer before turbine tests.
C. Turbine torque and rotational speed
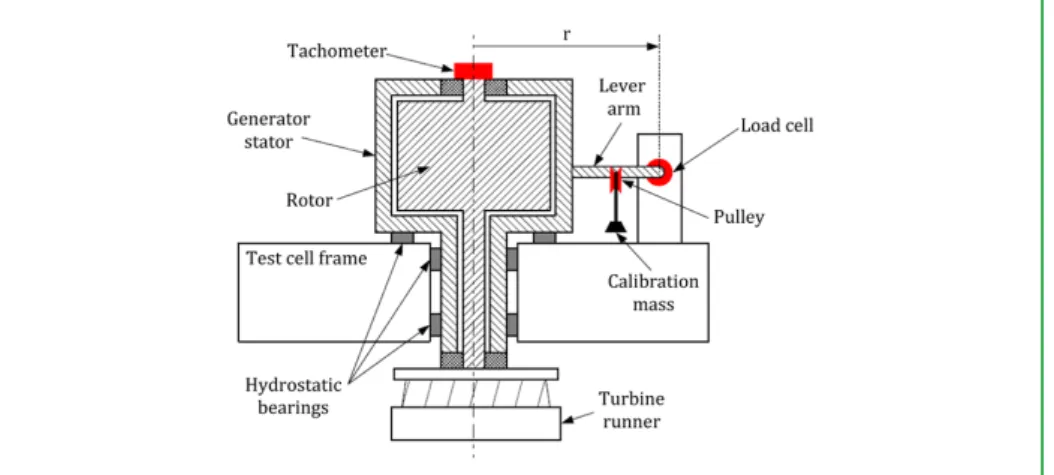
Torque and rotational speed of the turbine shaft are measured to determine the mechanical power produced by the turbine. Rotational speed is measured using a tachometer mounted on the generator shaft, since the turbine and the generator rotate on the same shaft.
The instrument measuring the net torque produced by the turbine must be calibrated, using primary methods, during turbine tests. Consequently, a floating generator arrangement is designed, in which the stator of the generator is also allowed to rotate freely
Figure 3. Modes of operation of the test rig: (a) open-circuit mode for performance tests, (b)
closed-circuit mode for cavitation tests, and (c) calibration mode
Model Testing of Francis-Type Hydraulic Turbines
Contributed Paper
April 2017 Vol 50 No 3 l Measurement and Control 73
using hydrostatic bearings (Figure 5). However, this rotation is constrained by a load-cell compressed by the tip of a lever arm that is fixed radially to the stator. Torque is calculated by multiplying the force from the load-cell and the radius at the tip of the lever arm.
For calibration, weight of a known mass is applied at the tip of the lever arm, via a pulley arrangement, so that it pulls the lever arm away from the load-cell. Calibration is done based on the change of the load-cell output.
D. Water properties
Reynolds number and the NPSE need to be determined to ensure similarity between the actual turbine and the model turbine. Their calculation requires physical properties of water, such as density, kinematic viscosity, and vapor pressure. Therefore, ambient
temperature, water temperature, and also the air content of water is measured. The accuracy of the temperature sensors is 0.3°C. Air content is measured at the reservoir using a dissolved oxygen probe utilizing optical luminescence measuring method with ±0.2 ppm accuracy.
E. Cavitation characteristics
In cavitation tests, either the rotational speed or the flowrate is kept constant. For every angle of the guide vanes, the turbine is forced to have cavitation by lowering pressure at the turbine exit. When cavitation starts, the pressure is recorded and the location of the cavitation is observed visually and also recorded with a high-speed camera.
VI. Conclusion
Every single turbine is custom-designed specifically to meet the requirements of a hydroelectric power plant. Performance of a designed turbine is validated, to some extent, by computational fluid dynamics simulations; however, experimental testing according to IEC standards is necessary to ensure performance and reliability. Model tests require test facilities that are specifically designed to simulate the conditions of the actual power plants. The ETU Hydro test rig, presented in this article, is one of a few and the most recent in the world. It is capable of testing the performance and cavitation of Francis-type turbines,
up to 160 m head and 3.2 m3·s−1,
according to IEC 60193 standards. This requires the test rig to operate in two different modes, namely, open-circuit mode for performance tests and closed-circuit mode for cavitation tests.
According to the same standard, indirect measurement instruments must be calibrated using primary methods based on length, time, and mass. Moreover, calibration should be performed for every other model test. Hence, on-site and on-demand calibration procedures are designed and implemented, especially for flowrate and turbine torque calibration considering the large sizes and high capacities of the instruments.
Funding
This study was financially supported by the Turkish Ministry of Development under grant: Hydroturbine Design and Test Center Infrastructure.
References
1. IEC 60193:1999. Hydraulic turbines, storage pumps and pump-turbines—Model acceptance tests. 2. Drtina P, Sallaberger M. Hydraulic turbines—Basic
principles and state-of-the-art computational fluid dynamics applications. Proceedings of the Institution of Mechanical Engineers, Part C: Journal of Mechanical Engineering Science 1999; 213(1): 85–102.
3. Krivchenko GI. Hydraulic Machines: Turbines and Pumps. Moscow: Mir Publishers, 1986. 4. Ayli E, Kavurmaci B, Celebioglu K, Aradag S.
Design and construction of an experimental test rig for hydraulic turbines. In: ASME 12th biennial conference on engineering systems design and analysis (ESDA), Copenhagen, 25–27 July 2014. New York: ASME.
5. Kavurmaci B, Akin H, Ayli E, Celebioglu K, Aradag S. Design of an experimental test stand for Francis type hydraulic turbines. In: 4th international conference on power engineering, energy and electrical drives (POWERENG), Istanbul, Turkey, 13–17 May 2013. New York: IEEE.
6. ISO 6817:1992. Measurement of conductive liquid flow in closed conduits—Method using
electromagnetic flowmeters.
7. ISO 4185:1980. Measurement of liquid flow measurement in closed conduits—Weighing method. 8. Cetinturk H, Aytac FZ, Tascioglu Y, Celebioglu K,
Aradag S. Design of a flow diverter mechanism and a nozzle for a hydro turbine experimental test rig. In: ASME 12th biennial conference on engineering systems design and analysis (ESDA), Copenhagen, 25–27 July 2014. New York: ASME.