Makale Gönderim Tarihi: 29-01-2016 Makale Kabul Tarihi: 16.08.2016 Sakarya University Journal of Education, 6/2 (Ağustos/August 2016) ss.97-107.
DOI: http://dx.doi.org/10.19126/suje.05095
Turkish Adaptation, Validity and Reliability Studies of
Teaching Mathematics in Inclusive Settings Survey
Bekir Fatih MERAL
*Mithat TAKUNYACI
**Abstract
The aim of the research is to adapt the Teaching Mathematics in Inclusive Settings (TMIS) survey into Turkish and determine their psychometric properties over the country sample. The research was performed with 338 general education teachers who are responsible teaching mathematics to inclusive students. The scale in which linguistic equivalence and face validity were achieved was a measuring tool of 9-point grading type including 12 items and two sub fields. CFA results
(x2/df=4.4, RMSEA=.07, SRMR=.04, GFI=.92, AGFI=.86, NFI=.98, NNFI=.96, RFI=.96, IFI=.97 and
CFI=.98) indicated that the scale had an acceptable goodness of fit. It was observed that the scale achieved criterion related validity. It was determined that Cronbach’s alpha internal consistency re-liability and split-half reliabilities were high, item total correlations were high and the differences between %27 upper-lower groups were significant. In the light of the findings, it can be stated that TMIS survey can be used as a valid and reliable measuring tool in determining the efficacy of gene-ral education teachers in Turkey for teaching mathematics to inclusive students.
Keywords: Inclusive settings, mathematics teaching efficacy, confirmatory factor analysis, validity,
reliability.
Kaynaştırma Uygulamalarında Matematik Öğretimi
Ölçeğinin Türkçe Uyarlama, Geçerlik ve Güvenirlik
Çalışmaları
Öz
Araştırmanın amacı Kaynaştırma Uygulamalarında Matematik Öğretimi (KUMÖ) Ölçeğinin Türk-çeye uyarlanması ve ülke örneklemi üzerinden psikometrik özelliklerinin belirlenmesidir. Araştır-ma kaynaştırAraştır-ma öğrencilerine Araştır-mateAraştır-matik öğretiminden sorumlu 338 sınıf öğretmeni ile gerçekleşti-rilmiştir. On iki soru ve iki alt alandan oluşan dokuzlu derecelendirme tipi ölçme aracının dilsel
eşdeğerliği ve görünüm geçerliği elde edilmiştir. Doğrulayıcı faktör analizi sonuçları (x2/sd=4.4,
RMSEA=.10, SRMR=.04, GFI=.90, AGFI=.85, NFI=.98, NNFI=.97, RFI=.97, IFI=.98, CFI=.98) ölçeğin iyi düzeyde uyum iyiliğine sahip olduğunu göstermektedir. Ölçeğin ölçüt bağıntılı geçerliliği sağladı-ğı gözlenmiştir. Ölçeğin Cronbach’s alfa iç tutarlık güvenirliği ve iki yarı güvenirliğinin yüksek, madde toplam korelasyonlarının yüksek ve %27 alt-üst grup ortalamaları arasındaki farkın anlamlı olduğu belirlenmiştir. Bulgular ışığında, KUMÖ ölçeğinin Türkiye’de kaynaştırma öğrencilerine
* Assist. Prof. Dr., Sakarya University, Faculty of Education, [email protected]
matematik öğretiminde genel eğitim (sınıf) öğretmenlerinin yeterliklerinin belirlenmesinde geçerli ve güvenilir bir ölçme aracı olarak kullanılabileceği ifade edilebilir.
Anahtar Kelimeler: Kaynaştırma uygulamaları, matematik öğretimi yeterliği, doğrulayıcı faktör
analizi, geçerlik, güvenirlik.
1. INTRODUCTION
Presenting what is needed to achieve the aims personally or professionally is related with the positive or negative sense about the efficacy of the individual (Bandura, 1997). The postulate of Bandura (1997) about this issue is that behavior is related with the belief of individual’s own efficacy rather than what he/she can overcome. Perceived efficacy belief can affect the individ-ual in a positive and reinforcing way, but also in a negative and discouraging way (Lewan-dowski, 2005). Teachers’ believing in their own efficacy allows for structuring knowledge and understanding in terms of meeting the learning needs of students and brings along better pat-terning and presentation of teaching which provides the access of the student to knowledge. Thereby, there is a strong relation-ship between teacher efficacy and increasing the success of the students (Aerni, 2008; Lewandowski, 2005).
Teacher efficacy corresponds to the belief of having the efficacy which may affect the suc-cess and learning of the students in a way to include all students with developmental ineffi-cacy (Hoy, 2000). Inclusive study which is associated with teacher efficacy sense has an effect on the quality and effectiveness of the teaching provided for all students. Factors such as received education and experience, sense of the support provided by the school, inefficacy type and level of the students in inclusive envi-ronments affect the efficacy sense of the teach-ers. Teachers report that they experience a lack of efficacy in meeting the requirements and aims in Individualized Education Programs (IEP) especially in inclusive applications (Av-ramidis, Bayliss and Burden, 2000). It was
de-termined that the teachers with high efficacy in the education for students with special needs use efficient teaching strategies such as indi-vidualized education, peer education, differen-tiating and diversifying education when com-pared to teachers with lower efficacy sense (Rimm-Kaufman and Sawyer, 2004). It was observed that teachers with low efficacy sense recommend discrimination-based education instead of inclusion of students with special needs in general education classes (Podell and Soodak, 1993).
Becoming efficient of students with special needs in mathematics helps them to progress both in academic and professional area (Bley and Thornton, 2001; Geary, 2004). The efficacy of children with special needs regarding achieving mathematics skills in daily life is directly related with their efficacy to carry out basic mathematical procedures (Gürsel, 1990). Mathematics efficacy belief for the levels in content and pedagogical specialties of teacher has a great importance in the quality and effec-tiveness of mathematics education given to students in the class (DeSimone, 2004). There is no any scale for determining mathematics teaching efficacy in inclusive applications of teachers in Turkey. The aim of this research is to adapt the Teaching Mathematics in Inclusive Settings (TMIS-Aerni, 2008) to Turkish and to examine its psychometric properties.
2. METHOD 2.1. Research Group
We use purposive sampling and research group consists of 338 general education teach-ers who work in province of Sakarya in
2011-2012 education year and in whose classes there are inclusive students. 172 (50.9%) of the teach-ers are female and 162 (47.9%) are male. 4 of the participants left gender variable empty. Mean age of the teachers is 38.53.
2.2. Process
Before data collection studies of TMIS survey, scale application permit was obtained from Sakarya Provincial Directorate of National Education in order to apply the scale with the scale use permission from Tschannen-Moran and Aerni. Under the scope of adaptation of TMIS survey into Turkish, linguistic equiva-lence and face validity studies were included. Firstly, the scale was translated into Turkish by three academicians whose competence in Eng-lish was good. Three independent translations were incorporated into a single Turkish form by the same team in the light of related com-parisons. In order to provide linguistic equiva-lence between Turkish form and original Eng-lish scale form, "Two Languages Form" tech-nique was applied (Hambleton, Merendaand Spielberg, 2005). The related technique includes the presentation of English and Turkish equiva-lences of scale items together and grading of the compatibleness of the translation from 1 to 10 by experts. For this purpose, the form in which English and Turkish equivalences of scale items was presented together was submit-ted to the evaluation of 14 academicians who are competent in English. According to the result of the evaluation, linguistic equivalence mean coefficient of the scale was found as 8.9 according to 10-point grading. Under the scope of face validity, items were reviewed and relat-ed corrections were made. Under this scope, the scale text was brought to the opinion of two academicians working in Turkish teaching for evaluations regarding grammar, expression comprehensibility and grammatical rules and related corrections were made. As a result of
these stages, Turkish form of Teaching Mathe-matics in Inclusive Settings Scale (TMIS) survey was finalized before the application. Collection of data was carried out with the legal permis-sion of Sakarya Provincial Directorate of Na-tional Education. The data were collected in two weeks. Analysis of the data was made with PASW Statistics 18.0 (SPSS Statistics) and LIS-REL 8.71 programs.
2.3. Instruments
2.3.1. Teaching Mathematics in Inclusive Set-tings (TMIS) Survey
Teaching Mathematics in Inclusive Settings Scale (TMIS) survey is a measuring tool whose renewal, validity and reliability studies were made by Aerni (2008) and which aims to de-termine the teacher efficacy in mathematics teaching to children with special needs in in-clusive applications. The original of the scale was based on the short form of three factors and 12 questions of "Teacher's Sense of Effica-cy" developed by Tschannen-Moran and Wool-folk Hoy (2001). TMIS survey consists of two factors which are efficacy in class management and efficacy in teaching strategies and of 12 items. According to results of exploratory fac-tor analysis made by Aerni (2008), total vari-ance explanation ratio of efficacy factor in class management with an eigenvalue of 1.66 is 13.79% and total variance explanation ratio of efficacy factor in teaching strategies with an eigenvalue of 6.20 is 51.65%. The factor loads of the scale vary between .52 and .92. The highest score and the lowest score to be obtained from the 9-point grading type scale (1=never - 9=quite much) which includes 12 items in total is 12 and 108. For sub fields, the lowest score is 6 and the highest score is 54. There is no item in the scale which requires reverse calculation. The highness of scores corresponds to the highness of efficacy sense in mathematics edu-cation (Aerni, 2008).
2.3.2. Teachers' Sense of Efficacy Scale (TSES) Teachers' Sense of Efficacy Scale (TSES) was a scale developed to determine the teacher effica-cy in inclusive applications by Hollender (2011). This one-factor scale consists of 24 items. According to explanatory factor analysis, it was determined that a one-factor structure explains 66% of the total variance, factor loads vary between .53 and .77 and factor load aver-age for 24 items is .65. Cronbach's alpha (α) internal consistency coefficient of the scale was calculated as .94. Criterion related validity correlation coefficient of TSES was calculated as r=.83 (p<0.01). It was determined that item total correlation values of TSES were .50 and above. The highest score and the lowest score to be obtained from the 5-point grading type scale (1=I can never do it - 5=I can certainly do it) which includes 24 items in total is 24 and 120 (Hollender, 2011). Turkish adaptation, validity and reliability studies of TSES were performed by Meral and Bilgiç (2012).
Additionally, some demographics questions including age and gender details were provid-ed with a short instruction about questionnaire.
3. FINDINGS 3.1. Validity
3.1.1. Structure Validity - Confirmatory Factor Analysis
For structure validity of Turkish form of TMIS survey, "Confirmatory Factor Analysis (CFA)" including testing a hypothesis or a theory de-tected before regarding the relationship be-tween variables (Gülbahar and Büyüköztürk, 2008) was applied. Before CFA, since a condi-tion in which sample size for factor analysis is 300 or above is accepted is good (Tabachnick and Fidell, 2001), it is seen that the research has numeric adequacy (N=338) for conducting CFA. In CFA, many fit indexes are used to determine the sufficiency of the examined model and it is required that these fit index values have certain interims (Hu and Bentler, 1999; Anderson and Gerbing, 1984; Cole, 1987; Marsh, Balla and McDonald, 1988; Gülbahar and Büyüköztürk, 2008; Jöreskog and Sörbom, 1993; Schermelleh-Engel and Moosbrugger, 2003; Şimşek, 2007; MacCallum, Browne and Sugawara, 1996;
Byrne, 2006; Schermelleh-Engel, Moosbrugger and Müller, 2003). In the research Chi-Square Goodness (x2/degrees of freedom (df)),
Good-ness of Fit Index (GFI), Adjusted GoodGood-ness of Fit Index (AGFI), Comparative Fit Index (CFI), Normed Fit Index (NFI), Relative Fit Index (RFI), Incremental Fit Index (IFI) and Root Mean Square Error of Approximation (RMSEA) fix indexes were examined (see Table 1).
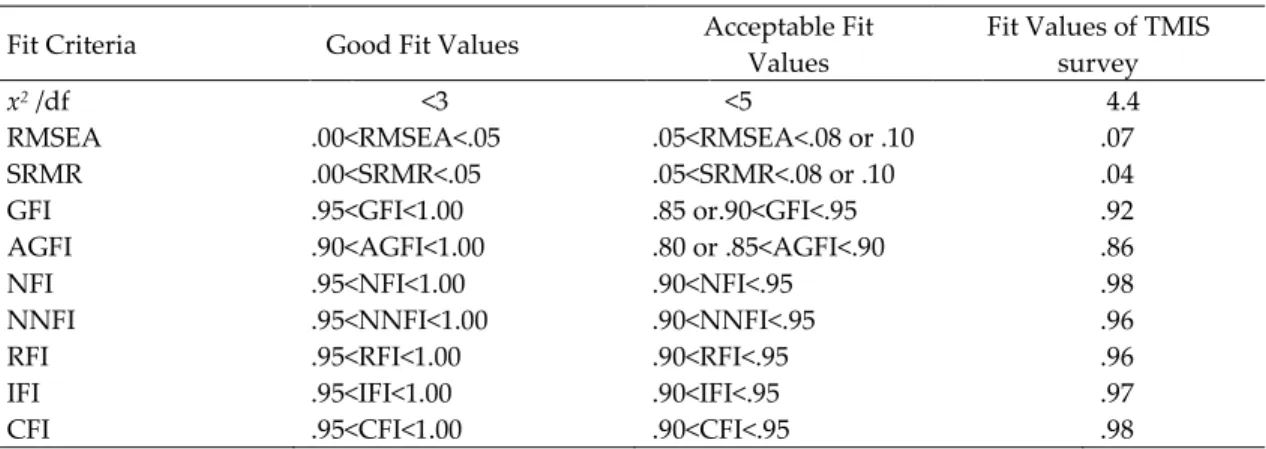
Table 1. Fit criteria and fit values of TMIS survey according to fit values (N=338)
Fit Criteria Good Fit Values Acceptable Fit
Values
Fit Values of TMIS survey
x2 /df <3 <5 4.4
RMSEA .00<RMSEA<.05 .05<RMSEA<.08 or .10 .07
SRMR .00<SRMR<.05 .05<SRMR<.08 or .10 .04
GFI .95<GFI<1.00 .85 or.90<GFI<.95 .92
AGFI .90<AGFI<1.00 .80 or .85<AGFI<.90 .86
NFI .95<NFI<1.00 .90<NFI<.95 .98
NNFI .95<NNFI<1.00 .90<NNFI<.95 .96
RFI .95<RFI<1.00 .90<RFI<.95 .96
IFI .95<IFI<1.00 .90<IFI<.95 .97
CFI .95<CFI<1.00 .90<CFI<.95 .98
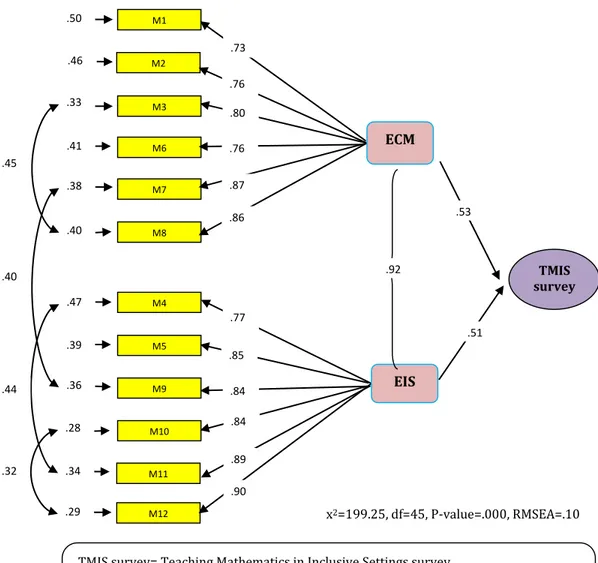
M1 M6 M7 TMIS survey M8 M4 M5 M9 M10 .73 6 .87 .86 .77 .85 .41 .50 .40 .28 .36 .38 .47 x2=199.25, df=45, P-value=.000, RMSEA=.10 M2 M3 M11 M12 .76 .80 .76 .84 .84 .89 .90 .46 .34 .29 .33 .39
TMIS survey= Teaching Mathematics in Inclusive Settings survey
EIS= Sub Field of Efficacy in Instructional Strategies ECM EIS .51 .53 .92 .45 .40 .44 .32
According to results of modification indices used in CFA, it was seen that Chi-Square value (x2=199.25, N=338, df=45, p=0.00000) was
signif-icant. In the research, it is observed that the model of TMISs has an acceptable fit goodness (fit=4.4) according to x2/df=fit (199.25/45=4.4)
calculation. Fit index values of the model based on CFA were calculated as RMSEA=.07,
SRMR=.04, GFI=.92, AGFI=.86, NFI=.98, NNFI=.96, RFI=.96, IFI=.97 and CFI=.98. Fix index values indicate that the model was fit and it achieved an acceptable fit with the data. It was seen that factor loads for the model vary between .73 and .90 and it is greater than .40 (see Figure 1).
Figure 1. Path Results of Teaching Mathematics in Inclusive Settings TMIS Survey 3.1.2. Criterion Validity
Criterion validity data of TMIS survey was collected with the co-application of Teachers'
Sense of Efficacy Scale (TSES). Criterion validi-ty calculation is based on the correlation calcu-lation between scores obtained from two scales
and it is expected that this correlation coeffi-cient is high (Özgüven, 2000). In the study, a significant and positive relationship of p<.01 was determined between general total and sub
field collection scores between two scales. It is observed that TMIS survey achieved criterion validity (see Table 2).
Table 2. Criterion Validity Results of TMIS survey and TSES (N=338)
TMISs_Total EIS ECM TSES_Total
TMIS survey_total -
EIS .96 -
ECM .96 .86 -
TSES_total .99 .96 .95 -
Note: **p< .01, TMIS survey= Teaching Mathematics in Inclusion Settings survey (total); EES= Sub Field of Efficacy in Teaching Strategies; ECM = Sub Field of Efficacy in Class Management; TSES= Teachers' Sense of Efficacy Scale (total-one-dimension
3.2. Reliability
3.2.1. Internal Consistency Reliability and Split-Half Reliability
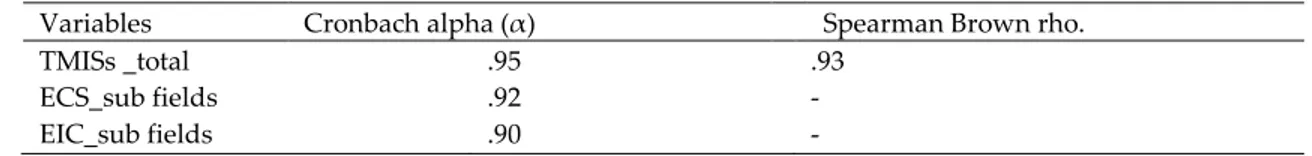
Cronbach's alpha (α) internal consistency coef-ficients of TMIS survey were calculated as .95 for whole of the scale, .92 for sub field of effica-cy in teaching strategies and .90 for sub field of efficacy in class management. It is observed that the scale has high internal consistency (see Table 3).
In order to determine the split-half reliability values, the correlation between odd items (1,3,5,7,9,11=6 items), even items (2,4,6,8,10,12=6 items) and split-half reliability was calculated. Split-life/odd-even reliability of TMIS survey was calculated as .93 (p<.01) ac-cording to Spearman Brown rho. Findings indicate that odd-even reliability of TMIS sur-vey was quite high (see Table 3).
Table 3. Internal Reliability and Split-Half Reliability of TMIS survey (N=338)
Variables Cronbach alpha (α) Spearman Brown rho.
TMISs _total .95 .93
ECS_sub fields .92 -
EIC_sub fields .90 -
Note: ** p< .01
3.2.2. Item Total Correlations and Item Aver-ages of 27% Upper-Lower Groups
For item distinctiveness of TMIS survey, Pear-son product-moment correlation coefficient was applied in calculating item total tion. It was observed that item total correla-tions of the scale range between .66 and .82. Items with distinctiveness index of .40 and higher are items with high distinctiveness (Tekin, 2004). Accordingly, it is seen that item
total correlations of TMIS survey and distinc-tiveness of items are quite high (see Table 4). t-test was used in comparing item scores of %27 upper-lower groups determined according to total score of TMIS survey.
27% upper-lower t(sd=181) values of TMIS survey vary between -15.65 and -23.52 and the difference between 27% upper-lower groups (p< .001) is statistically significant (see Table 4).
Table 4. Item Total Correlations and Item Averages of 27% Upper-Lower Groups (N=338)
4. RESULTS
In the research, it was aimed to determine the psychometric properties of TMIS survey whose renewal, validity and reliability studies were performed by Aerni (2008). Under this scope, calculations of Confirmatory Factor Analysis, criterion related validity, Cronbach's alpha (α) internal consistency coefficient, split-half relia-bility, item total correlation and the significance of the difference between 27% upper-lower item averages of TMIS survey whose linguistic equivalence and face validity were achieved were included.
According to CFA results made under validity studies of the research, it was seen that fit val-ues of suggested model of TMIS survey are within acceptable fit index values range and the model of the scale has an acceptable fit. Under criterion related validity, it was deter-mined that there is a significant and positive relationship between total and sub field
collec-tion scores between TMIS survey and TSES and, TMIS survey achieved criterion related validity.
Under reliability calculations of the study, it was determined that total and sub field internal consistency reliability values and split-half reliability of TMIS survey were high. Accord-ing to item total correlations of the scale, it was determined that prediction and representation of TMIS survey items the total score was high. It was also observed that the differences be-tween 27% upper-lower item averages of TMIS survey were significant. Since not being able to examine test-retest reliability was a restriction, it is beneficial to include related reliability calculations in the further researches.
According to the findings of the research, it can be stated that Teaching Mathematics in Inclu-sive Settings (TMIS) survey can be used as a valid and reliable measuring tool in determin-ing the efficacy of general education teachers for teaching mathematics to inclusive students.
Items rjx t
Efficacy in classroom management
1. To what extent can you control disruptive behavior in the mathematics classroom? .66 -15.65 2. To what extent can you motivate students who show low interest in mathematics? .72 -17.52 3. To what extent can you calm a student who is disruptive or noisy in the
mathemat-ics classrooms?
.77 -21.17 6. To what extent can you get children to follow classroom rules? .74 -18.13 7. To what extent can you get students to believe they can do well in mathematics? .77 -18.13 8. How well can you establish a classroom management system with each group of
students?
.79 -18.08 Efficacy in instructional strategies
4. To what extent can you help your students value learning mathematics? .77 -19.61 5. To what extent can you craft good questions for your students related to
mathemat-ics?
.82 -23.46 9. To what extent can you use a variety of assessment strategies in mathematics? .76 -17.11 10. To what extent can you provide an alternative explanation or example when
stu-dents are confused?
.81 -23.52 11. How well can you assist families in helping their children do well in mathematics? .78 -18.70 12. How well can you implement alternative teaching strategies for mathematics in
your classroom?
.79 -19.94
Scale points: None At All 1- 2 – 3 – 4 – 5 – 6 – 7 – 8 - 9 A Great Deal Note: *** p< .001
References
Aerni, P.W. (2008). Teacher self-efficacy and beliefs for teaching mathematics in inclusion settings. Un-published doctoral dissertation. The College of William and Mary in Virginia. UMI number: 3353198
Anderson, J. C. & Gerbing, D. W. (1984). The effect of sampling error on convergence, improper solu-tions, and goodness-of-fit indices for maximum likelihood confirmatory factor analysis. Psy-chometrika, 49, 155-173.
Avramidis, E., Bayliss, P., & Burden, R. (2000). A survey into mainstream teachers’ attitudes towards the inclusion of children with special education needs in ordinary school in local education authori-ty. Educational Psychology, 20(2), 191-211.
Bandura, A. (1997). Self-efficacy: The exercise of control. New York: Freeman.
Bley, N. S. & Thornton C. A. (2001). Teaching mathematics to student with learning disabilities (Fourth Edi-tion). USA: Pro ed Press.
Brown, M. G. (2007). Virginia teachers’ perception and knowledge of test accommodations for students with disabilities. Proquest Information And Learning Company (UMI No.3254404)
Byrne, B. M. (2006). Structural equation modeling with EQS. Mahwah, NJ: Lawrence Erlbaum. Büyüköztürk, Ş. (2004). Data analysis hand book (Veri analizi el kitabi). Ankara: Pegem A Pub.
Cole, D. A. (1987). Utility of confirmatory factor analysis in test validation research. Journal of Consulting and Clinical Psychology, 55, 1019-1031.
DeSimone, J.R. (2004). Middle school mathematics teachers’ beliefs and knowledge about inclusion of students with learning disabilities. Ed.D. dissertation, St. John’s University (New York). Re-trieved April 3, 2007, Dissertations & Theses: Full Text database. (Publication No. AAT 31357785).
Gülbahar, Y., & Büyüköztürk, Ş. (2008). Adaptation of assessment preferences inventory to Turkish (Değerlendirme tercihleri ölçeğinin Türkçeye uyarlanması). Hacettepe University Journal of Educa-tion, 35, 148-161.
Gürsel, O. (1990). Alt özel son sinif öğrencilerin ritmik sayma, doğal sayilar, toplama ve çikarma işlem-lerindeki amaçlari gerçekleştirme düzeylerinin değerlendirilmesi. I. Özel Eğitim Günleri, Eskişehir: Anadolu Üniversitesi Yayınları.
Hambleton, R.K., Merenda, P.F., & Spielberg, C.D. (2005). Adapting Educational and Psychological Tests for Cross-Cultural Assessment. NJ: Lawrence Erlbaum Associates.
Hollender, I. (2011). The development and validation of a teacher efficacy for inclusion scale. Unpublished Doctoral Dissertation. The City University of New York. UMI Microform Number: 3443933. Hoy, A.W. (2000). Changes in teacher efficacy during the early years of teaching. Paper presented at the
Hu, L.T., & Bentler, P.M. (1999). Cutoff criteria for fit indexes in covariance structural analysis: Conven-tional criteria versus new alternatives. Structural Equation Modeling, 6,1-55.
Jöreskog, K. ve Sörbom, D. (1993). LISREL 8: Structural equation modeling with the SIMPLIS command lan-guage. Lincolnwood, USA: Scientific Software International, Inc.
Lewandowski, K.L. (2005). A study on the relationship of teachers’s self-efficacy and the impact of lead-ership and professional development. D.Ed. dissertation. Retrieved March 21, 2007, from Disserta-tion & Theses: Full Text database. (PublicaDisserta-tion No. AAT 3164696).
MacCallum, R.C., Browne, M.W., & Sugawara, H.M, (1996). Power analysis and determination of sam-ple size for cavariance structure modeling. Psychological Methods, 1, 130-149.
Marsh, H. W., Balla, J.R., & McDonald, R.P. (1988). Goodness-of-fit indexes in confirmatory factor analy-sis: The effect of sample size. Psychological Bulletin, 103, 391-410.
Meral, B.F., & Bilgiç, E., (2012). Turkish adaptation, validity and reliability study of the teacher efficacy for ınclusion scale (kaynaştirmada öğretmen yeterliği ölçeği’nin Türkçe uyarlama, geçerlik ve güvenirlik çalışması). International Journal of Human Sciences [Online]. (9)2: 253-263.
Özgüven, İ.E., (2000). Psychological tests (Psikolojik testler), 4. Ed., Ankara, PDREM Pub.
Podell, D.M., & Soodak, L.C. (1993). Teacher efficacy and bias in special education referral. Journal of Educational Research, 86, 247-253.
Rimm-Kaufman, S.E., & Sawyer, B.E. (2004). Primary-grade teachers’ self-efficacy beliefs, attitudes to-ward teaching, and discipline and teaching practice priorities in relation to the Responsive Class-room Approach. Elementary School Journal, 104(4), 321-341.
Schermelleh-Engel, K., Moosbrugger, H. & Müller, H. (2003). Evaluating the fit of structural equation models: Test of significance and descprictive goodness-of-fit measures. Methods of Psychological Research Online, 8(2), 23-74.
Şimşek, Ö.F. (2007). Entering the structural equation modeling, basic principals and LISREL applications (Yapısal eşitlik modellemesine giriş, temel ilkeler ve LISREL uygulamaları). Ankara: Ekinoks Education Pub.
Tekin, H. (2004). Assessment and evaluation in education (Eğitimde ölçme ve değerlendirme). 17. Ed., Ankara: Yargı Yayınevi.
Tschannen-Moran, M., & Woolfolk-Hoy, A. (2001). Teacher efficacy: Capturing an elusive construct. Teaching and Teacher Education, 17(7), 783-805. doi: 10.1016/S0742-051X(01)00036-1
Genişletilmiş Özet
Araştırmanın amacı, Kaynaştırma Uygulamalarında Matematik Öğretimi (KUMÖ) ölçeğinin Türkçeye uyarlanması ve ülkemizdeki örneklem üzerinden psikometrik özelliklerinin belirlenmesidir. Araştırma, 338 sınıf öğretmeni ile gerçekleştirilmiştir. Sınıf öğretmenlerinin kaynaştırma öğrencilerine matematik öğretimi yeterliklerini belirlemede kullanılan ölçek 12 madde ve iki alt alandan oluşan 9’lu de-recelendirme tipi bir ölçme aracıdır.
Öğretmen yeterliği, gelişimsel yetersizliği olan öğrencileri içine alacak şekilde tüm öğrencilerin başarısı ve öğrenmesine etki edebilecek yeterliğe sahip olma inancına karşılık gelmektedir (Hoy, 2000). Özel gereksinimli öğrencilere yönelik öğretimde yüksek düzeyde yeterlik algısına sahip olan öğretmenlerin daha düşük yeterlik algısına sahip olan öğretmenlere oranla bireyselleştirilmiş öğretim, akran öğretimi, öğretimin farklılaştırılması ve çeşitlendirilmesi gibi etkili öğretim stratejileri kullandıkları belirlenmiştir (Rimm-Kaufman ve Sawyer, 2004). Özel gereksinimli öğrencilerin matematikte yeterli hale gelmeleri, onların gerek akademik, gerekse mesleki alanda ilerlemelerine yardım etmektedir (Bley ve Thornton, 2001; Geary, 2004). Özel gereksinimli öğrencilerin günlük yaşamdaki matematik becerilerini başarma yeterlilikleri, temel matematik işlemlerini yerine getirme yeterlilikleriyle doğrudan ilişkilidir (Gürsel, 1990). Öğretmenlerin içerikteki seviyelerine ve pedagojik uzmanlıklarına ilişkin matematik yeterlik inancı, sınıf içerisinde öğrencilere sağlanan matematik öğretiminin kalitesi ve etkililiğinde büyük önem sahiptir (DeSimone, 2004). Türkiye’de öğretmenlerin kaynaştırma uygulamalarında matematik öğretimi yeterliklerini belirlemeye yönelik değerlendirme araçlarıyla ilgili bir araştırmayla karşılaşılmamıştır. İlgili gereksinime cevap vermeyi hedefleyen bu araştırmanın amacı, Aerni (2008) tarafından yenilenme, geçerlik ve güvenirlik çalışmaları yapılan Kaynaştırma Uygulamalarında Matematik Öğretimi (KUMÖ) ölçeğinin kaynaştırma öğrencilerine matematik öğretiminden sorumlu sınıf öğretmenleri üzerinden psikometrik özelliklerinin belirlenmesidir.
Araştırmada, yenilenme, geçerlik ve güvenirlik çalışmaları Aerni (2008) tarafından yapılan KUMÖ ölçeğinin psikometrik özelliklerinin belirlenmesi amaçlanmıştır. Bu kapsamda Dilsel eşdeğerlik ve görünüm geçerliği sağlanan KUMÖ ölçeğinin Doğrulayıcı Faktör Analizi, ölçüt bağıntılı geçerlik, Cronbach alpha (α) iç tutarlılık katsayısı, iki-yarı güvenirlik, madde-toplam korelasyonu ve %27 alt -üst grup madde ortalamaları arasındaki farkın anlamlılığı hesaplamalarına yer verilmiştir.
Araştırmanın geçerlik çalışmaları kapsamında yapılan DFA sonuçlarına (x2/sd=4.4, RMSEA=.10,
SRMR=.04, GFI=.90, AGFI=.85, NFI=.98, NNFI=.97, RFI=.97, IFI=.98, CFI=.98) göre KUMÖYÖ’nin önerilen modelinin uyum değerlerinin, kabul edilebilir uyum indeksleri değerleri aralığında olduğu ve ölçeğe ilişkin modelin kabul edilebilir bir uyuma sahip olduğu görülmüştür. Ölçüt bağıntılı geçerlik kapsamında, KUMÖ ölçeği ve Kaynaştırmada Öğretmen Yeterliği Ölçeği (KÖYÖ) arasında genel toplam ve alt alan toplama puanları arasında anlamlı ve pozitif yönlü bir ilişkinin olduğu ve KUMÖ ölçeğinin ölçüt bağıntılı geçerliği sağladığı belirlenmiştir. Araştırmanın güvenirlik hesaplamaları kapsamında KUMÖ ölçeğinin toplam (α=.95) ve alt alan iç tutarlık güvenirlik değerlerinin (α=.92 ve α=.90) ve test yarılama/iki-yarı güvenirliğinin (Spearman Brown rho.=.93) yüksek düzeyde olduğu belirlenmiştir. Ölçeğin madde-toplam korelasyonlarının .66 ile .82 arasında sıralandığı gözlenmiştir. Buna göre KUMÖ ölçeğine ait maddelerinin toplam puanı yordama ve temsil gücünün yüksek olduğu belirlenmiştir. KUMÖ ölçeğinin %27 alt -üst grup madde ortalamaları arasındaki farkların (p<.001) ise anlamlı olduğu gözlenmiştir.
Araştırma bulguları doğrultusunda, Kaynaştırma Uygulamalarında Matematik Öğretimi (KUMÖ) ölçeğinin sınıf öğretmenlerinin kaynaştırma öğrencilerine matematik öğretimi yeterliklerini belirlemede geçerli ve güvenilir bir ölçme aracı olarak kullanılabileceği söylenebilir. Araştırmada test-tekrar test güvenirliğinin incelenememesinin bir sınırlık olmasından dolayı ilgili güvenirlik hesaplamasına ileriki araştırmalarda yer verilmesinde fayda vardır.
Appendix 1.
Kaynaştırma Uygulamalarında Matematik Öğretimi Ölçeği
Kaynaştırma uygulamalarında matematik öğre-timiyle ilgili aşağıdaki soruları 1’den 9’a kadar olan derecelendirmeyi kullanarak cevaplayınız.
H iç Çok a z O rta dü ze y de Çok Oldu kça ço k
1 Matematik dersindeki istenmeyen davranışları ne
derecede kontrol edebilirsiniz? 1 2 3 4 5 6 7 8 9
2
Matematiğe düşük düzeyde ilgi gösteren kaynaş-tırma öğrencilerini ne derecede motive edebilirsi-niz?
1 2 3 4 5 6 7 8 9
3
Matematik dersinde gürültü yapan ya da isten-meyen davranışlar sergileyen bir kaynaştırma öğrencisini ne derecede sakinleştirebilirsiniz?
1 2 3 4 5 6 7 8 9
4
Kaynaştırma öğrencilerinizin matematik öğreni-mine değer vermesine ne derecede yardımcı ola-bilirsiniz?
1 2 3 4 5 6 7 8 9
5 Kaynaştırma öğrencilerinize matematikle ilgili ne
derecede güzel sorular oluşturabilirsiniz? 1 2 3 4 5 6 7 8 9 6 Kaynaştırma öğrencilerinizin sınıf kurallarına
uymalarını sağlamada ne derecede başarılısınız? 1 2 3 4 5 6 7 8 9 7
Kaynaştırma öğrencilerinizin matematikte iyi olduklarına kendilerini inandırmada ne derecede başarılı olabilirsiniz?
1 2 3 4 5 6 7 8 9
8 Her bir öğrenci grubu için sınıf yönetimi sistemini
ne kadar iyi uygulayabilirsiniz? 1 2 3 4 5 6 7 8 9
9 Matematikte değişik değerlendirme stratejilerini
ne derecede kullanabilirsiniz? 1 2 3 4 5 6 7 8 9
10
Kaynaştırma öğrencilerin kafalarının karıştığı durumlarda ne derecede alternatif açıklama ya da örnek sunabilirsiniz?
1 2 3 4 5 6 7 8 9
11
Kaynaştırma öğrencilerinin matematik konusun-da iyi olabilmelerinde, ailelere ne derecede yar-dımcı olabilirsiniz?
1 2 3 4 5 6 7 8 9
12 Matematik dersinde alternatif öğretim