DESIGNING INHIBITORS VIA MOLECULAR MODELLING
METHODS FOR MONOAMINE OXIDASE ISOZYMES A AND B
FİLİZ VARNALI
KADİR HAS UNIVERSITY
2012
DESIGNING INHIBITORS VIA MOLECULAR MODELLING
METHODS FOR MONOAMINE OXIDASE ISOZYMES A AND B
FİLİZ VARNALI
M.S. in Computational Biology and Bioinformatics, Kadir Has University, 2012
Submitted to the Graduate School of Science and Engineering in partial fulfilment of the requirements for the degree of Master of Science in Computational Biology and
Bioinformatics
KADİR HAS UNIVERSITY 2012
DESIGNING INHIBITORS VIA MOLECULAR MODELING METHODS FOR MONOAMINE OXIDASE ISOZYMES A AND B
Abstract
In drug development studies, a large number of new drug candidates (leads) have to be synthesized and optimized by changing several moieties of the leads in order to increase efficacies and decrease toxicities. Each synthesis of these new drug candidates include multi-steps procedures. Overall, discovering a new drug is a very time-consuming and very costly works. The development of molecular modelling programs and their applications in pharmaceutical research have been formalized as a field of study known computer assisted drug design (CADD) or computer assisted molecular design (CAMD).
In this study, using the above techniques, Monoamine Oxidase isozymes, which play an essential role in the oxidative deamination of the biogenic amines, were studied. Compounds that inhibit these isozymes were shown to have therapeutic value in a variety of conditions including several psychiatric and neurological as well as neurodegenerative diseases.
First, a series of new pyrazoline derivatives were screened using molecular modelling and docking methods and promising lead compounds were selected, and proposed for synthesis as novel selective MAO-A or –B inhibitors.
Both experimentally and computationally promising compounds were selected using Discovery Studio’s De Novo Design program in order to enhance their binding affinity. Pharmachophoric properties of the active site of the enzymes were also mapped.
The results obtained computationally in this thesis stimulate the further studies and provide invaluable data for the design of more selective and potential MAO-A and MAO-B inhibitors.
Keywords: Monoamine Oksidase (MAO), molecular modelling, drug design,
MONOAMIN OKSIDAZ A VE B İZOZİMLERİNE MOLEKÜLER MODELLEME YÖNTEMLERİ İLE İNHİBİTÖR TASARLANMASI
Özet
İlaç geliştirilme çalışmaları, geleneksel olarak basamaklı sentez prosedürlerine dayanmaktadır ve aktivite profillerinin optimizasyonu için çok sayıda bileşiğin sentezini gerektirmektedir. Bu sebepten dolayı yapılan araştırmalar artık
moleküllerin aktivite profillerinin çıkarılmasına dayalı bilgisayar tabanlı moleküler modelleme teknikleri kullanılarak yapılmaya başlanmıştır. Bu moleküler modelleme tekniklerine bilgisayar yardımlı ilaç tasarımı (Computer Assisted Drug Design (CADD)) veya bilgisayar yardımlı moleküler tasarım (Computer Assisted Molecular Design (CAMD)) adı verilmektedir.
Bu çalışmada bu yöntemlerden yararlanılarak biyojenik aminlerin oksidatif deaminasyonunda önemli rol oynayan monoamin oksidaz (MAO); MAO-A ve MAO-B olarak isimlendirilen farklı iki izoformdaki enzimle çalışılmıştır. Bu izoformları inhibe eden bileşiklerin duygusal bozukluklar ve nörodejeneratif hastalıklar gibi birçok hastalıkta tedavi edici değeri olduğu bilinmektedir.
Çalışmada esas olarak bir dizi yeni pirazolin türevi üretilmis ve moleküler modelleme yöntemleri ile taranarak ve potansiyel inhibitör adayları tespit edilmiştir.
Auto Dock, GOLD ve Accelrys Discovery Studio CAESAR programları modelleme, tarama ve görüntüleme işlerinde kullanılmıştır. Daha sonra seçilen bu bileşiklerin MAO-A ve MAO–B izoformları ile etkileşimi incelenmiştir. Elde edilen veriler MAO enzimleri ile daha sonra yapılabilecek seçimli inhibitör geliştirme çalışmaları için önemli ve yol gösterici sonuçlara ulaşılmasını sağlamıştır.
Anahtar Kelimeler:Monoamin Oksidaz (MAO), moleküler modelleme, ilaç
Acknowledgements
This dissertation would not have been possible without the guidance and the help of several individuals who in one way or another contributed and extended their valuable assistance in the preparation and completion of this study.
First and foremost, I would like to express my sincere gratitude to my advisor Prof. Kemal Yelekçi for the continuous support of my master’s study and research, for his patience, motivation, enthusiasm, and immense knowledge. His guidance helped me throughout my research. I could not have imagined having a better advisor and mentor for my masters study.
Besides my advisor, I would like to thank the rest of my thesis committee: Dr. M. Vezir Kahraman, Dr. E. Demet Akten Akdoğan, and Dr. Tuba Arzu Özal, for their encouragement, and insightful comments. All the people in our faculty, especially for their guidance and help during my study.
Ms. Evrim Besray Ünal for helping me learn the GOLD software procedures, Mr. Ahmet Emre Aladağ for his continuous efforts helping me solve the software related problems.
Mr. Ruşit Ümit for his untiring effort in editing my thesis and his guidance and support.
Last but not the least, my beloved mother Fatma and sister Deniz for their patient love and endless support.
This thesis is dedicated to Prof. Nihat Aktaç Who has been my guide and inspiration…
Table of Contents
Abstract... ii
Özet... iv
Acknowledgements... vi
Dedication... vii
Table of Contents... viii
List of Tables... xi
List of Figures... xii
List of Equations... xv
List of Abbrevations... xvi
1 PROPERTIES OF MONOAMINE OXIDASE ENZYMES 1.1 Introduction………... 1
1.2 General Properties of MAO Isoenzymes... 2
1.3 Crystallographic and Structural Properties of MAO Isoenzymes 5 1.4 Biosynthesis and Biodegradation of Neurotransmitters... 11
1.5 Amine Catalysis Reaction of MAO Isoenzymes... 14
1.5.1 Single Electron Transfer Mechanism (SET)... 15
1.5.2 Polar Addition-Elimination Pathway... 15
1.5.3 Hydrogen atom transfer (HAT)... 17
2 CLASSIFICATIONS OF MONAMINE OXIDASE INHIBITORS 2.1 Introduction... 18
2.2 Irreversible (Non-Selective) MAO Inhibitors... 19
3 METHODS AND PROCEDURES USED IN MOLECULAR MODELLING
3.1 Introduction... 25
3.2 Preparation of Enzymes and Ligands... 27
3.3 Auto Dock and Molecular Docking Studies performed by AUTODOCK... 28
3.4 GOLD and Molecular Docking Studies performed by GOLD... 33
3.5 CAESAR and Molecular Docking Studies performed by CAESAR... 35
4 LIGANDS DESIGNED BY DENOVO MOLECULAR MODELING METHODS 4.1 Introduction... 36
4.2 Properties of the Scaffolds and Side Groups of the Generated Ligands... 37
4.3 Ligands Chemical Structure of Selected According AUTODOCK, GOLD and CAESAR Results ... 39
5 RESULTS and DISSCUSION 5.1 Introduction... 45
5.2 Docking Results of MAO-A and MAO-B Isoenzymes... 46
5.3 Correlation Between Docking Results ... 49
5.4 Detailed Analysis of the Fundamental Results of Docking Studies... 51
5.4.1 Ligands Selected for MAO-A Enzyme... 51
5.4.1.1 Evaluation of 4bcr/4bcs Ligands for MAO-A Enzyme... 51
5.4.1.2 Evaluation of 4dar/4das Ligands for MAO-A Enzyme... 56
5.4.1.3 Evaluation of 5bar/5bas Ligands for MAO-A Enzyme... 60
5.4.2 Ligands Selected for MAO-B Enzyme... 65 5.4.2.1 Evaluation of 1der/1des Ligands for MAO-B
5.4.2.2 Evaluation of 3bar/3bas Ligands for MAO-B
Enzyme... 70
5.4.2.3 Evaluation of 3car/3cas Ligands for MAO-B Enzyme... 75
5.5 Conclusion... 79
Curriculum Vitae... 80
List of Tables
Table-1.1 Important structural properties for MAO isoenzymes………… 7 Table 2.1 Some important medicines used for MAOIs and their properties 23 Table-3.1 Important parameters used for Auto Dock studies……….. 32 Table-3.2 Important parameters used for CAESAR studies……… 35 Table-4.1 Naming of the ligands……….……….……….... 37 Table-4.2 Chemical structure of selected ligands according to AutoDock,
GOLD and CAESAR results……….……….……….. 39 Table-5.1 Docking scores of the 50 ligands obtained by Autodock, GOLD and
List of Figures
Figure-1.1 The 3-D image obtained by positioning monomer units of MAO-A
and MAO-B enzymes on top of each other... 3
Figure-1.2 Sequence similarity between MAO-A and MAO-B... 3
Figure-1.3 FAD’s molecular structure... 4
Figure-1.4 LIGPLOT illustration binding FAD to MAO-B... 5
Figure-1.5 MAO-A structure is shown in illustration... 8
Figure-1.6 MAO-B structure is shown in illustration... 9
Figure-1.7 Binding of MAO-A the mitochondrial membrane... 10
Figure-1.8 Binding of MAO-B to the mitochondrial membrane... 10
Figure-1.9 Chemical structures of some amines which are related with MAO isoenzymes... 12
Figure-1.10 Biosynthesis of neurotransmitters that are synthesized from tyrosine and tryptophan... 13
Figure 1.11 Biodegredation of Catecholamines via COMT and MAO enzymes 14 Figure-1.12 Amine catabolism reaction... 14
Figure 1.13 Chemical reaction catalyzed by MAO isoenzymes... 15
Figure-1.14 Proposed radical mechanism for MAO catalysis... 15
Figure-1.15 Proposed polar addition-elimination mechanism... 16
Figure-1.16 Proposed hydrogen atom transfer mechanism... 17
Figure 2.1 Chemical structure of hydrazine derivatives... 19
Figure-2.2 Chemical structure of cyclopropylamine derivatives... 20
Figure-2.4 Chemical structure of fluoroallilamin derivatives... 21
Figure-2.5 Chemical structure of hydrazolone... 22
Figure 3.1 Darwinian and Lamarckian local search algorithms... 29
Figure 3.2 Energy evaluation of binding in Autodock ... 30
Figure-5.1 Correlation between docking methods for MAO-A graphic... 49
Figure-5.2 Correlation between docking methods for MAO-B graphic... 50
Figure-5.3 Position of 4bcr ligand in MAO-A enzyme and 2-D representation of its interactions... 52
Figure-5.4 Position of 4bcr ligand in MAO-A enzyme and 3-D representation of its interactions... 53
Figure-5.5 Position of 4bcs ligand in MAO-A enzyme and 2-D representation of its interactions... 54
Figure-5.6 Position of 4bcs ligand in MAO-A enzyme and 3-D representation of its interactions... 55
Figure-5.7 Position of 4dar ligand in MAO-A enzyme and 2-D representation of its interactions... 57
Figure-5.8 Position of 4dar ligand in MAO-A enzyme and 3-D representation of its interactions... 57
Figure-5.9 Position of 4dar ligand in MAO-A enzyme and 3-D representation of its interactions... 59
Figure-5.10 Position of 4das ligand in MAO-A enzyme and 3-D representation of its interactions... 59
Figure-5.11 Position of 5bar ligand in MAO-A enzyme and 2-D representation of its interactions... 61
Figure-5.12 Position of 5bar ligand in MAO-A enzyme and 3-D representation of its interactions... 62
Figure-5.13 Position of 5bas ligand in MAO-A enzyme and 2-D representation of its interactions... 63 Figure-5.14 Position of 5bas ligand in MAO-A enzyme and 3-D representation of
its interactions... 64 Figure-5.15 Position of 1der ligand in MAO-B enzyme and 2-D representation of
its interactions... 66 Figure-5.16 Position of 1der ligand in MAO-B enzyme and 3-D representation of
its interactions... 67 Figure-5.17 Position of 1des ligand in MAO-B enzyme and 2-D representation of
its interactions... 68 Figure-5.18 Position of 1des ligand in MAO-B enzyme and 3-D representation of
its interactions... 69 Figure-5.19 Position of 3bar ligand in MAO-B enzyme and 2-D representation of
its interactions... 71 Figure-5.20 Position of 3bar ligand in MAO-B enzyme and 2-D representation of
its interactions... 72 Figure-5.21 Position of 3bas ligand in MAO-B enzyme and 2-D representation of
its interactions... 73 Figure-5.22 Position of 3bas ligand in MAO-B enzyme and 3-D representation of
its interactions... 74 Figure-5.23 Position of 3car ligand in MAO-B enzyme and 2-D representation of
its interactions... 75 Figure-5.24 Position of 3car ligand in MAO-B enzyme and 3-D representation of
its interactions... 76 Figure-5.25 Position of 3cas ligand in MAO-B enzyme and 2-D representation of
its interactions... 77 Figure-5.26 Position of 3cas ligand in MAO-B enzyme and 3-D representation of
List of Equations
Equation-3.1 Autodock force field equation... 30
Equation-3.2 AutoDock ∆G and scoring function equation... 31
Equation-3.3 GOLD score parameters……….. 33
Equation-3.4 Chem-Score parameters………. 34
Equation-3.5 The complete equation for binding free energy calculated by Chem-Score………. 34
List of Abbreviations
MAO Monoamine OxidaseMAO-A Monoamine Oxidase A MAO-B Monoamine Oxidase B MAOIs Monoamine oxidase inhibitors
EC Enzyme Commission Number
FAD Flavin Adenine Dinucleotid FADH2 Reduced flavin
FADH˙ Flavin semiquinone 5-HT Serotonin
PEA 2-phenylethylamine
MPTP 1-methyl-4-phenyl-1, 2, 3, 6-tetrahydropyridine L-DOPA 3,4-4-dihydroxy phenylalanine
PNMT Fenylethanolamine-N-methyltransferase COMT Catechol-O-methyl-tansferase
SET Single electron transfer mechanism HAT Hydrogen atom transfer mechanism PDB Protein Data Bank
2-D Two-dimensional 3-D Three-dimensional
NMR Nuclear Magnetic Resonance SA Simulated Annealing
GA Genetic Algorithm
MGL Tools Molecular Graphics Laboratory Tools ADT Auto Dock Tools
Chapter 1: Properties of Monoamine Oxidase Enzymes
1.1 Introduction
Monoamine Oxidase (MAO) isoenzymes are related with neurodegenerative diseases and emotional disorders (like Parkinson, Alzheimer diseases and major depression) which affect the nervous system. Today, millions of people are affected with these diseases. Increasing world population and aging ratio exhibits the importance of development of powerful methods and new drug to treat these diseases [1, 2, 3].
Therefore, this study is focused on determining the required inhibitors for treatment of MAO isoenzymes related diseases. The objective of this study is the search new, selective and reversible, MAO isoenzyme using inhibitors to in-silico drug design methods. Computational model studies will increase the changes of finding the required drugs before synthesizing the hundreds of model compounds. This will both fasten the time needed to develop a target compound and will decrease the cost drastically [1, 2, 3].
First general structural properties of MAO isoenzymes and their crystallographic structure, second importance of related neurotransmitters, and finally amine catalysis reactions and importance of those reactions for MAO
1.2 General Properties of MAO Isoenzymes
Monoamine Oxidase enzymes (EC 1.4.3.4.) contain FAD (flavin adenine dinucleotid), catalyze oxidative deamination reaction of biological amines in CNS (central nervous system) and peripheral tissues. These isoenzymes are Monoamine Oxidase-A and Monoamine Oxidase-B (A and B). A and MAO-B can be found as integral proteins in the outer mitochondrial membrane in neuronal and some other tissues. When we consider total MAO activity, MAO-A shows an intense activity in placenta, intestine, liver, adrenal medulla and MAO-B in platelets, brain, adrenal medulla and liver [4-7].
MAO-A consist of 527 and MAO-B consist of 520 amino acids respectively. MAO isoenzymes have 70% similarity based on amino acid sequences (Figure-1.1, 1.2). The active sites of both of these isoenzymes include cysteine, which is bonded covalently with coenzyme FAD (Ser-Gly-Gly-Cys-koenzyme-Tyr). Cys406 of MAO-A and Cys497 of MAO-B are making covalent bonds with 8-α-methyl group of FAD via thioether linkage [1,8]. FAD’ s molecular structure can be seen in Figure-1.3.
Figure-1.1: The 3-D image obtained by positioning monomer units of MAO-A and
MAO-B enzymes on top of each other. MAO-A, represented in green and, MAO-B in blue [9].
Figure-1.3: FAD’s molecular structure10
Covalent and non-covalent interactions between isoalloxazine ring of FAD and Lys305 on MAO-A and Lys296 on MAO-B are fundamental for enzyme stabilization. These residues link to N5 atom of FAD with hydrogen bond. Interaction pattern of FAD with related amino acids is illustrated in Figure-1.4 for MAO-B [1, 8].
These amino acids are in MAO-A Ile19, Gly20, Gly22, Ile23, Ser24, Leu42, Glu43, Ala44, Arg45, Gly50, Arg51, Gly67, Ala68, Tyr69, Val244, Ile273, Leu277, Trp397, Tyr402, Cys406, Tyr407, Gly434, Thr435, Gly443, Tyr444 and Met445. On the other hands Gly11, Gly13, Ile14, Ser15, Leu33, Glu34, Ala35, Arg36, Gly41, Arg42, Gly58, Ser59, Tyr60, Val235, Ala263, Ile264, Trp388, Tyr393, Cys397, Tyr398, Gly425, Thr426, Gly434, Tyr435, Met436 residues are in MAO-B which are interacting with FAD [1, 8, 11].
Figure-1.4: LIGPLOT illustration binding FAD to MAO-B. (Dashed lines-hydrogen
bonds, carbons-black, nitrogens-blue, oxygens-red, sulphurs-yellow, water molecules- cyan spheres) [12].
1.3 Crystallographic and Structural Properties of MAO Isoenzymes
Previous crystallographic studies and computational molecular simulations show us some important information about these molecules. According to these studies MAO-A crystallizes as monomers but MAO-B crystallizes as dimmer. MAO-A includes only one cavity, which is named as substrate binding cavity, but MAO-B has an additional cavity named as entrance cavity [1, 4, 11 and 13].
MAO-B entrance cavity volume is about 290Å3. MAO-B has a cavity-shaping loop, which is formed by amino acid residues between 99-112. This loop structure redirects substrate into entrance cavity. Entrance cavity is hydrophobic and surrounded by Phe103, Pro104, Trp119, Leu164, Leu167, Phe168, Leu171, Ile199, Ile316 and Tyr326. Ile199 acts like a gate for entrance of substrate. Therefore, large substrates can be positioned using these two cavities. On the other hand MAO-A isoenzyme does not have an entrance cavity therefore substrate can directly enter into the single cavity (substrate binding cavity) [1, 4, 11 and 13].
On both isoenzymes, substrate reaches to the hydrophobic substrate-binding cavity. Volume of this cavity in MAO-A is ~390Å3 and in MAO-B is ~550Å3. Substrate cavity is covered with Ile180, Asn181, Phe208, Ile335 residues in MAO-A and Leu171, Cys172, Ile199, Tyr326 residues in MMAO-AO-B.
FAD is surrounded by a cage consisting of two aromatic amino acids that are fundamental for oxidation reaction. These aromatic amino acids are Tyr407, Tyr444 in MAO-A and Tyr398 and Tyr435 in MAO-B. The residues around the aromatic cage are fundamental for ligand selectivity for MAO-A, amino acid residues between 161 and 375, and for MAO-B, amino acid residues between 152 and 366 are playing important roles [1, 4, 11 and 13].
Important structural properties for MAO isoenzymes are summarized are below in Table 1.1:
Table-1.1: Important structural properties for MAO isoenzymes
Enzyme property MAO-A MAO-B
Crystallographic structure Monomer Dimmer
Cavity number 1 2
Entrance cavity volume No entrance cavity 290Å3
Substrate cavity volume 550Å3
390Å3
Total cavity size is in open conformation 700Å3
Aromatic cage residues Tyr407 and Tyr444 Tyr398 and Tyr435
Gate between cavities No Ile199
Hydrophobic properties Quite hydrophobic than
MAO-B Hydrophobic
Flexibility for lig. Entrance More flexible than MAO-B
Ligands can be placed in the two cavities via gate residue (Ile199)
In Figure-1.5 and Figure-1.6 cavity locations, domains and active sites are illustrated for MAO isoenzymes.
Figure-1.5: MAO-A structure is shown in illustration. The FAD-binding domain
illustrated with blue, the substrate-binding domain red, and the C-terminal membrane region green.
Figure-1.6: MAO-B structure is shown in illustration. The FAD-binding domain
illustrated with blue, the substrate-binding domain red, and the C-terminal membrane region green.
The section, named as C-terminal tail, of MAO enzymes ensures binding to the mitochondrial membrane. This C-terminal tail is composed of a hydrophobic α-helix on every monomer’s globular section for MAO isoenzymes (between residues 461-520) [13,14,15,16]. The function of this part is believed to be directing the ligands to the designated area of the enzyme and illustrated in Figure-1.7 and 1.8.
Figure-1.7: Binding of MAO-A the mitochondrial membrane and locations of
amino acids at the membrane binding regions, according to crystallographic data [17].
Figure-1.8: Binding of MAO-B to the mitochondrial membrane and locations of
amino acids at the membrane binding regions, according to crystallographic data [17]
1.4 Biosynthesis and Biodegradation of Neurotransmitters
MAO catalyzes the oxidative deamination of neurotransmitters and some other biologic amines. Some of these neurotransmitters and amines are dopamine, epinephrine (adrenaline), norephinephrine (noradrenalin, NA), serotonin (5-HT), tyramine, tryptamine, PEA (2-phenylethylamine) and MPTP (1-methyl-4-phenyl-1, 2,3,6-tetrahydropyridine). Furthermore MAO also serves as a cytoprotective role by degrading exogenous amines, which exert their toxicity by affecting cardiovascular and endocrine homeostasis.
Norephinephrine and serotonin are inhibited by MAO-A and phenylethylamine and benzylamine are inhibited by MAO-B. Both of the two enzymes inhibit dopamine, and tyramine, but dopamine by MAO-A, and tyramine by MAO-B are inhibited much more effectively (Figure-1.9).
MAO-A inhibition (e.g. with clorgiline) regulates depressive and anxiolytic influences caused by increasing of 5-HT and NA levels at the brain. MAO-B inhibition (e.g. with l-deprenyl) helps the treatment of neurodegenerative diseases caused by increasing of PEA, benzylamine, and MPTP levels.
Figure-1.9: Chemical structures of some amines which are related with MAO
isoenzymes.
Biosynthesis and metabolization steps of these catecholamine’s can be summarized like this:
L-DOPA (3,4-4 dihydroxy phenylalanine) is synthesized from tyrosine by tyrosine hydroxylase enzyme. L-DOPA is decarboxylased into dopamine by dopa decarboxylase enzyme. After crossing blood-brain barrier, L-DOPA is converted to dopamine. Dopamine is stored in chromaffin cells and vesicles. Dopamine in the dopamine vesicles is hydroxylased into norephinephrine by hydroxylase enzyme. Norephinephrine, which is released into cytoplasm from vesicles, is methylated by
fenylethanolamine-N-methyltransferase (PNMT) enzyme and turned into
epinephrine (Figure-1.10).
For serotonin biosynthesis, 5-hydroxy tryptophan is produced from tryptophan amino acid by tryptophan hydroxylase enzyme. After that 5-hydroxy tryptamine (serotonin) is produced by using L-amino acid decarboxylase enzyme (Figure-1.10).
Figure-1.10: Biosynthesis of neurotransmitters that are synthesized from tyrosine
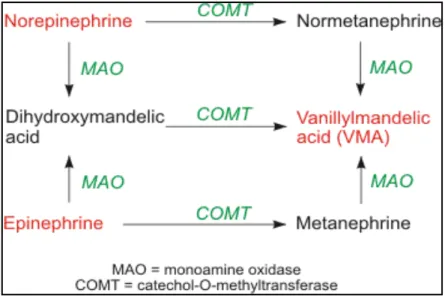
Catecholamines are released into synaptic cleft, and then they bind into effectors cell receptors and perform their specific activity. After that catecholamines biodegrade in intercellular or extracellular environment by MAO isoenzymes, and catechol-O-methyl-tansferase (COMT) reuptake from synaptic cleft by specific enzyme transporters. (Figure-1.11)
Figure 1.11:Biodegredation of catecholamines via COMT and MAO enzymes 1.5 Amine Catalysis Reaction of MAO Isoenzymes
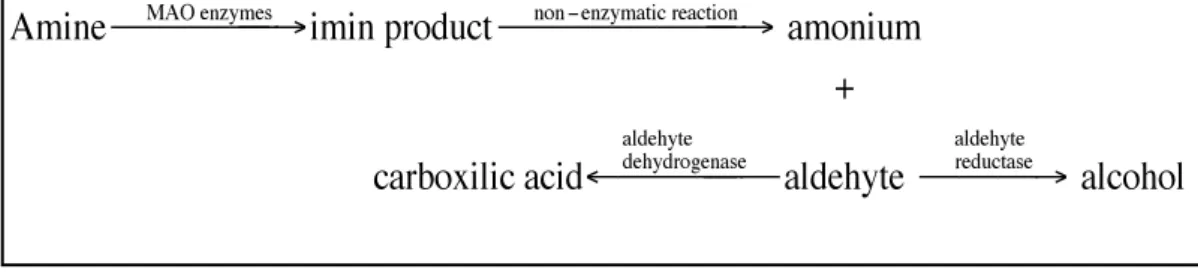
The chemical reaction catalyzed by MAO requires FAD as a redox cofactor and it is performed on monoamine substrates in their neutral, deprotonated forms (Edmondson et al., 1993, Miller and Edmondson, 1999) and consists of the conversion of monoamines into corresponding aldehydes [6, 7, 11, 18, 19].
Research has shown that the catalytic action of MAO starts with cleavage of the Cα-H bond of the deprotonated form of monoamine substrates. Specifically,
FAD accepts two hydrogen atoms and is reduced to FADH2, while the amine is
Figure-1.12: Amine catabolism reaction
Figure 1.13: Chemical reaction catalyzed by MAO isoenzymes
In most cases, the second step of MAO reaction consists of the re-oxidation of FADH2, with the conversion of oxygen into hydrogen peroxide. Finally, the imine
is hydrolyzed into the corresponding aldehyde and ammonia.
Today the mechanism of MAO oxidation reaction of amines has not been identified thoroughly, but three proposed mechanisms are important. These are summarized below:
1.5.1 Single Electron Transfer Mechanism (SET)
The SET pathway proposed by Silverman and colleagues (Figure 1.14). The SET pathway is believed to proceed via one-electron transfer from the amine lone pair to the oxidized flavin adenine dinucleotide, which gives the amine radical cation (2, Figure 1.14) and the flavin semiquinone (FADH˙). Loss of a proton gives the α -amino radical (3, Figure 1.14), which can transfer the second electron to the
flavin semiquinone to give the reduced flavin (FADH2) and the iminium product (4,
Figure 1.14) [6, 7, 11, 18, 19].
Figure-1.14: Proposed Radical Mechanism for MAO Catalysis 1.5.2 Polar Addition-Elimination Pathway
The flavin analog 3-methyl-5-ethyl-lumiflavinium perchlorate (Figure-1.15) was used by Mariano. He worked on a chemical model to study three major MAO inactivators; cyclopropylamines, α-silylamines and hydrazine’s. From the results of these studies, Mariano proposed that the MAO catalysis could proceed via an addition-elimination mechanism (Figure-1.16). The amine (1) (Figure-1.16) acts as a nucleophile to attack the activated flavin to form an amine-flavin adduct (2) (Figure 1.16). In a concerted step that follows, the amine-flavin adduct cleaves to release the imine (3) (Figure 1.16) and the reduced flavin. Further hydrolysis of the imine leads to the aldehyde (4) (Figure 1.16) and ammonia [6, 7, 11, 18, 19].
Figure-1.15: Chemical structure of flavin analog 3-methyl-5-ethyllumiflavinium
Figure-1.16: Proposed Polar Addition-Elimination Mechanism
1.5.3 Hydrogen Atom Transfer (HAT)
In 1967, Hull performed studies on primary amine oxidations by ClO2 and
demonstrated that in addition to the SET pathway, there was also an operative HAT pathway that generated a carbon centred radical by hydrogen atom abstraction from the α-carbon of amines like (1) (Figure-1.14, 1.17). Later Edmondson et al., based on work with substituted benzylamines have proposed an alternative pathway for MAO catalysis, which involves hydrogen atom abstraction. The HAT pathway (Figure-1.17) generates the α- carbon radical (3) (Figure-1.14, 1.17) directly and therefore bypasses the aminium radical cation (2) (Figure-1.14). Loss of an electron from (3) (Figure-1.14, 1.17) yields (4) (Figure-1.14).
RCH
2N
..
H
21
! " # # $ FAD% FADH. " " " " " " " #R C
.
H
2N
..
H
23
! " # # $Figure-1.17: Proposed hydrogen atom transfer mechanism
According to present day information, most of natural substrates are metabolized by both of the MAO isoenzymes, since the cofactor part is similar in both of the MAO isoenzymes. Therefore, the structural differences responsible for substrate specificity are thought to be the other regions of the proteins [6, 7, 11, 18, 19, 20].
Chapter 2: Classifications of Monoamine Oxidase Inhibitors
2.1 Introduction
Monoamine Oxidase inhibitors (MAOIs) are classified as, reversible (competitive or slow tight-binding), and irreversible (affinity labelling agents or mechanism-based inactivators) MAOIs. First produced MAOIs were performing a
products. At the same time most of these compounds caused some hepatotoxic side effects by inactivating the P450.
One of the major side effects is called “cheese effect”. Application of non-selective MAOI and consumption of tyramine contained foods causes the inactivation of both MAO isoenzymes resulting an increased blood tyramine level. Thus the increased tyramine level effects blood pressure and this causes fatal hypertensive crisis. These hypertensive and hepatotoxic side effects caused by the unknown selectivity of MAOIs has substantially limited the application of these drugs, until reversible and selective MAOIs came out. The increasing research on structural and functional information about MAO and their selective inactivation mechanism has created a substantial attention on reversible and selective MAOIs. Research based on new generation of MAO-A selective inhibitors tends to yield promising results for the treatment of depression and MAO-B inhibitors seem to be promising for the treatment of Parkinson and Alzheimer diseases.
According to selectivity and reversibility, MAOI can be classified like this:
2.2 Irreversible (Non-Selective) MAO Inhibitors
These compounds are divided into two as hydrazine derivatives and non-hydrazine derivatives. Iproniazid is the prototype of non-hydrazine derivatives. Iproniazid was firstly used as a tuberculostatic, but after the recognition of its euphoric effects in patients this drug started to be used as an antidepressant with the trade name “Marsilid”. Then based on this structure, Phenelzine (Nardil), Isocarboksazid (Marplan) and Nialamide (Niamid) are developed as antidepressants. Later on, it was realized that these antidepressants showed very limited or no selectivity at all to MAO subtypes. These compounds are metabolized by n-acetylation and fast biosynthesis of the acetyl hydrazine’s produced, creates the mechanism causing the fatal hepatotoxic effects.
The application of these drugs were drastically limited due to metabolization problems and side effects caused by non selective interactions with MAO isoenzyme and after the introduction of tricylic antidepressants, they lost all their popularity.
Figure-2.1: Chemical structure of hydrazine derivatives
In Figure-2.1 chemical structure of hydrazine derivatives are illustrated. Here are the major compounds used as a derivative of hydrazine: Benmoxine, Hydralazine, Iproclozide, Iproniazide, Isocaroxazid, Isoniazid, Mebanazine, Nialamide, Octamoxine, Phenelzine, Pheniprazine, Phenoxyproprazine, Pivalylbenzhydrazine, Procarbazine, Safrazine.
Chemical structures of compounds, which include non-hydrazine derivatives, can be seen in Figure-2.2, 2.3 and 2.4. Major molecules, which are used as drugs, are: Caraoxazone, Echinopsidine, Furazolidone, Linezolid and Trancylopromine.
Figure-2.3: Chemical structure of propylamine derivatives
`
Figure-2.4: Chemical structure of Fluoroallilamin derivatives
2.3 Reversible and Selective MAO Inhibitors:
Different heterocyclic compounds with two or four nitrogen atoms in are the building blocks of reversible and selective MAOIs. Therefore oxadiazolons, tetrazoles and indenopiridazinons were realized to be powerful, reversible and selective MAO-B inhibitors.
Major common properties for substrate inhibition of these compounds can be listed as follows:
• They all contain a benzyloxy group. • They contain a pentacyclic ring.
• The length of side chains of aryldiazo derivatives is not more than 2 carbons like substrates. 2-pyrazoline compounds that have hydrozone structure in the ring have been reported to show MAOI effects and specificity to MAO subtypes and antiparkinson and antidepressants effects.
X: O, S Y: O, S, OCH2 Z: CN, OH
Figure-2.5: Chemical structure of hydrazolone
Some selective MAO-A inhibitors used as medicine are: Brofaromine, Matralindole, Minaprine, Moclobemide, Pirlindole and Toloxatone. Also Lazabemide, Pargyline, Rasagiline, Selegiline can be considered as the major selective MAO-B inhibitors.
Apart from these, there are some compounds, which are currently researched. One of them is Metfendrazine, which is a nonselective MAO inhibitor and hydrazine derivative. Amiflamine, Bazinaprine, Befloxatone, Befol, Cimaxatone, Esuprone, Methylene Blue, Sercloramine, Tetrindole, Thesputiaint, Tyrima, D-Deprenyl, Ladostigil, Milacemide and Mofegiline are some of the promising compounds that inhibit MAO-B selectively [1, 20, 21].
In recent years for the inhibition of monoamine oxidase 8-benzyloxycaffeine,
€
β-carboline, hydrazine, hydrazothiazole, chromone, indol, benzofuran, flavones,
hexahydroindazole, 2-arylthiomorpholine, benzylidene-prop-2-ynyl-amines, naphthylisopropylamine, N-benzylamphetamine, (E)-styrylisatin and their derivatives are under investigation in recent years can be considered as important compounds [23-25].
Properties of some significant MAOIs explained are medicines used for and their properties explained below in Table-2.1.
Table-2.1: Some important medicines used for MAOIs and their properties
Na m e Ch em ic al S tr u ctu re s Us ed fo r In h ib it M A O -A or M AO -B Re ve rs ib le / ir re ve rs ib le S el ect iv e/ n on -se le ct iv e Imp or ta n t p ro p er ti es Ni al am id e ( Ni am id ) An ti de pr es sa nt an xi ol yt ic A Irre ve rs ib le N ons el ec ti ve Hy dr az in e de ri va ti ve Is oc arb ox az id ( En er ze r, Ma rp la n, Ma rp lo n) An ti de pr es sa nt An xi ol yt ic A Irre ve rs ib le N ons el ec ti ve Hy dr az in e de ri va ti ve an d ch ees e ef fect
Ra sa gi li ne ( Az il ec t) Pa rk in so n di se as e B Irre ve rs ib le S el ect iv e Se le gi li ne ( L -de pr enyl , El de pr yl , Em sa m , Ze la pa r) Ea rl y-st ag e Pa rk in so n' s di se as e, de pr es si on a nd se ni le d em en ti a. B in la rge dos e al so inhi bi t A MA O -A Irre ve rs ibl e S el ect iv e Ph en yl et hy la m in e de ri va ti ve re la te d w it h am ph et am in e Mo cl ob em id e ( Au ro ri x, Ma ne ri x) De pr es si on a nd so ci al a nx ie ty A Reve rs ibl e S el ect iv e Ch ee se e ff ec t i s no t o bs er ve d. Tr an yl cy pr om in e ( Pa rn at e, Ja tr oso m ) Ant ide pr es sa nt a nd an xi ol yt ic a ge nt A Irre ve rs ib le N ons el ec ti ve Re la te d w it h am ph et am in e Ph en el zi ne : (Na rd il , Na rd el zi ne ) A nt ide pr es sa nt a nd an xi ol yt ic . A Irre ve rs ib le N ons el ec ti ve Hy dr az in e de riv ativ e
Na m e Ch em ic al St ruc tur es U se d f or In h ib it M A O -A or MA O -B Re ve rs ib le / ir re ve rs ib le Se le ct iv e/ n on -se le ct iv e Imp or ta n t p ro p er ti es Continuation of Table-2.1
Chapter 3: Methods and Procedures Used in Molecular Modeling
3.1 Introduction
Drug molecules show their effect by inhibiting the enzymes. Molecules that have lower binding specificity to other enzymes and the substrates that inhibit the enzyme at a lower concentrate are considered to be strong inhibitors. These properties influence the side effects and toxicity of the drug.
The method I used in my study is called Structure Based Drug Design and it is one of the modern drug design methods. In this method firstly, using NMR, X-Ray, etc identifies the crystallographic structure of the enzyme. Today there are more than 70000 proteins in the Protein Data Bank (PDB) whose 3-D structure has been determined by crystallography of NMR techniques, and they are the fundamental source for computer aided drug design studies.
Then many ligands are docked to the enzyme in silico. In my study ligands, that were not previously synthesized, were designed. This is called “de-novo
design”. Then these ligands were docked with MAO enzymes.
Docking is a term used for computational drug design that attempts to find best matching between a receptor and a ligand. Docking studies consist of three main steps. Those are; the representation of the system, the conformational space search, and the ranking of potential solutions. To find best docking results, an efficient search procedure and a good scoring function, and ideally, the best matching algorithms and scoring schemes should be combined [36-38].
Interaction or binding affinity between two molecules (ligand and the enzyme) is predicted by the scoring functions. First, a virtual system is composed. Then the ligand and the enzyme are placed in this system. Induced fit is achieved between the ligand and the enzyme by minimizing the free energy in the system. To get the optimum induced fit 2 criteria are used:
• Shape cohesion between the ligand and the enzyme • Interaction Energy
When the ligand and enzyme are brought together, the ligand tries to position itself within the enzyme at the parts called active cavities. At this point the ligand is posed at different angles and its position is changed step by step. At every step (pose) the total energy of the system is estimated by using molecular mechanics force field, and the best score is given where the energy value is the lowest [36-40].
The search algorithm is a process where, all possible conformation and orientation of protein-ligand complex in the binding side, is searched. If ligand is flexible, then program will calculate the energy for each rotation made of each and every rotatable bond it can find. The system is divided into parts and relevant estimations are made for each part. Structural cohesion is observed for both the ligand and the enzyme. The basis of the search algorithm can be defined as follows:
1. Systematic or stochastic torsion search 2. Dynamic molecular simulations 3. Evolved genetic algorithms
In this chapter docking studies of de-novo designed ligands (compound that have not been chemically synthesized preciously), using software named AutoDock, CAESAR (Accelrys Discovery Studio) and GOLD are explained. The scoring functions and algorithms of these software’s are explained in the procedure steps.
3.2 Preparation of Enzymes and Ligands
The crystal structures of MAO-A and MAO-B were extracted from the http://www.rcsb.org (Protein Data Bank). Their PDB codes are 2Z5X (MAO-A with inhibitor harmine, resolution 2,2Å) and 2V5Z(MAO-B with inhibitor safinamide, resolution 1,6Å) respectively.
The enzymes extracted from pdb.org were prepared for processing. Protein
Prepare Tool of Accelrys was used. One monomer was selected for each enzyme
and their ligands were deleted, missing parts were completed, and broken structures were aligned. Water molecules were added, physiological ph values were adjusted, ionic strength was set to 0.145 and dielectric constant was set to 10. Then the enzyme structure was minimized and the files were converted to relative formats and saved for the docking procedures [1, 36-40].
The ligands targeted for docking procedures were selected based on the previous studies. The identified main structure (scaffold) and the side chains (R groups) are explained in the next chapter. The 300 ligands structures that were selected, were illustrated by Accelrys software, re-organized, minimized, converted to necessary file formats and saved for the docking procedures [1, 36-40].
The docking procedures that were carried out using different docking software are explained in the following chapters:
3.3 AutoDock and Molecular Docking Studies Performed by AutoDock
AutoDock is an automated procedure for predicting the interaction of ligands with biomacromolecular targets. [41-44].
In the Lamarckian Genetic Algorithm used by AutoDock, the ligand is defined as a chromosome and genes. Ligand’s Cartesian coordinates and variables specifying its orientation;and genes representing flexible torsional angles. After the genes are defined, for each individual, translation (x,y,z), orientation, and torsional angle genes are assigned randomly (within extents of grid maps). These gene values of these random individuals are then converted into a corresponding phenotype that allows the assessment of each individual’s fitness (total interaction energy of the ligand).
After the selection of reproducing individuals, biological crossover and mutation events take place to create the next generation. In the crossover process, equivalent genes are swapped. A random mutation occurs on the basis of a Cauchy distribution is utilized to generate mutations on genes that are selected randomly.
lower energy than its predecessor, local search is repeated until encountering higher energy conformation. After this by reverse-transcription of the optimised phenotype back into the genome.
On the other hand, Darwinian local search is based on a blind phenotypic jump that can be either confirmed or ignored according to the phenotypic fitness. Thus, Lamarckian Genetic Algorithm is more efficient compared to Monte Carlo simulated annealing and traditional genetic algorithm (Figure-3.1) .
Figure-3.1: Darwinian (right) and Lamarckian(left) local search algorithms (Morris
et al., 1998)
The force field in AutoDock evaluates binding in two steps which are shown in Figure-3.1. In the begining the ligand and protein start in an unbound conformation and the first step evaluates the intramolecular energetics of the transition state from unbound form to the bound form. In second step, when protein and ligand adopt in
the bound complex, the intermolecular energetics of combining ligand and protein, are evaluated (Huey et al., 2007).
Figure-3.2: Energy evaluation of binding in AutoDock
The force field includes six pair-wise evaluations (ΔG i-i) and an estimate of the conformational entropy lost upon binding (ΔSconf)
€ ΔG = (ΔGbound L −L − ΔGunbound L −L ) + (ΔGbound P −P − ΔGunbound P −P ) + (ΔGbound P _ L − ΔGunbound P −L + ΔSconf )
Equation-3.1: Autodock force field equation
In equation 3.2, L denotes ligand and P denotes for protein (receptor), respectively. First paranthesis are intramolecular energies of bound and unbound states for ligand, respectively. The second paranthesis include are intramolecular energies of bound and unbound states for protein, respectively. The terms in third paranthesis represents the change in intermolecular energy between the bound and unbound states.
€
ΔGunboundP −L is zero, since it is assumed that two molecules are adequately distant from one another [41-45].
The pair-wise terms (free energies, ΔG) in Equation-3.3, is evaluated by a scoring function based on semiempirical free energy force field with the weighting constants (ΔGi). These constants are experimentally determined by Morris et al.in
known binding constants. The Scoring function includes five terms to model dispersion/repulsion, hydrogen bonding, electrostatic interactions, internal ligand torsional constraints and desaolvation effects:
Equation-3.2: AutoDock ∆G and scoring function equation
First term is Lennard-Jones 6/12 potential for dispersion/repulsion interactions. Distance between the atoms i and j is represented by rij. A and B are Amber force
field’s parameters. The second term is a directional hydrogen bond term based on a 10/12 potential. E(t) is a directional weight that depends on the angle (t) between the probe and the target atom .The third term represents the Coulomb potential for electrostatic interactions between charged particles. The parameters qi, qj are partial
charges of the atoms, ε is the permittivity. Entropic penalty term is for the loss of torsional entropy upon binding (ΔGtor), that is directly proportional to the number of
rotatable bonds in the molecule (Ntor). The last term is a desolvation potential based
on the volume (Vi and Vj) of the atoms surrounding a given atom. Parameter S (Si
and Sj) and σ are the weighting factors for volumes and distance, respectively [45].
In AutoDock, energy calculations are performed by creating grid maps before starting the docking of the ligand to the receptor. These maps are calculated by
Autogrid and created by placing the receptor protein inside a user defined three dimensional grid box. Probe atom is placed on each grid point, seperated by “grid
spacing” and the maps are created for each type of atom involved in docking, then
these maps are stored in seperate grid files that can later be sampled by the main AutoDock routine. Thus, recalculation of the distances involved in scoring function at each energy evaluation is avoided and this leads to a decrease in computational time [45].
Docking studies were performed using AutoDock 4.02 and MGLTools 1.5.4 based on protein and ligand files created by Accelrys. To achieve this firstly *. pdbqt files were generated from the *.pdb files. *.gpf files was generated as a template for ligands. Information of atoms in the summary.txt was edited in this *.gpf file for all ligands. Then the Auto Grid software is executed using *.pdbqt files and all the generated files (receptor *.pdbqt and *.gpf; ligand*.pdbqt and *.map) are stored in a directory. Then these files are reproduced by using a script for each ligand, and *.dpf files and docking directories were generated. Docking was performed with the necessary scripts and *.dlg files were generated. The main parameters used in this study are listed in Table 3.1:
Table-3.1: Important parameters used for AutoDock studies Number of grid points in xyz 80 x 80 x 80
Grid spacing 0.375 Å
Centered atom FAD N5 atom
Number of GA-LS runs 100
Number of individuals in population 150
Maximum number of energy
evaluations
5000000
Maximum number of generations 27000
Rate of gene mutation 0.02
Rate of crossover 0.8
3.4 GOLD and Molecular Docking Studies Performed by GOLD
GOLD v.4.011 (Genetic Optimization for Ligand Docking) is an automated docking optimization tool that uses different genetic algorithms for docking flexible ligands into a protein-binding site (Jones and al., 1995, 1997). The scoring function that ranks the binding sides consists of terms of hydrogen bonding, pair wise dispersion potential that is able to describe a significant contribution to hydrophobic energy of binding and a molecular mechanics term of internal energy of the ligand [1, 39, 46, 47].
In my study, the fitness functions used in GOLD are Gold-Score (Jones and
al., 1995) and Chem-Score (Eldridge and al., 1997). GOLD uses a genetic
algorithm to search favorable ligand poses. A population of chromosomes is manipulated during genetic algorithm run, with each chromosome representing a trial docking. A chromosome contains all the information’s needed to completely define a trial ligand pose and is associated with a fitness value, computed from the scoring function. The Gold-Score fitness function is the force field based and utilized to predict peptide binding positions, it consists of four components; Protein- ligand hydrogen bond energy, protein- ligand Vdw energy, ligand internal Vdw energy and ligand intramolecular hydrogen bond energy. The equation for Gold-Score fitness is shown in Equation-3.4 with ext (protein-ligand energy), int (ligand internal term) terms indicated. Score (int) includes both ligand Vdw energy and ligand torsional term.
Equation-3.3: GOLD score parameters
The Chem-Score fitness function is empirical and calculates the free energy of ligand binding. Chem-Score consists of contact terms as follows: lipophilic and
!
metal-ligand binding contributions, hydrogen bonding, internal torsion terms, covalent and constraint scores as shown in equation-3.5. The complete equation for binding free energy calculated by Chem-Score is shown in Equation-3.6.
Equation-3.4: Chem-Score parameters
Equation-3.5: The complete equation for binding free energy calculated by
Chem-Score
Parameters in the equations above consist of binding free energy change, protein-ligand hydrogen bond contribution value and additional constraint contribution. Chem-Score hydrogen bond contribution is calculated over all donor-acceptor pairs of protein and ligand. Protein ligand lipophilic contribution is done by Chem-Score lipo term [1, 39, 46, 47].
In order to perform docking studies with GOLD software, the *.pdb files of the receptors and *.mol2 files of the ligands were used for docking. Firstly the receptors were configured by isolating the single monomer of each enzyme, adding hydrogen atoms, extracting water molecules and their ligands. Then a spherical binding region with a diameter of 15 Å was defined around N5 atom of the FAD. The ligands were defined as flexible. GA run was set to 100. GOLD score and Chem-Score were used for scoring function and the docking speed (the number of parameters that control the precise operation of the genetic algorithm) was set as “most accurate”. The other parameters were set as default [1, 39, 46, 47].
!
ChemScore = "G
binding+ P
clash+ c
int+ (c
covP
cov+ P
constra int)
!
CAESAR (Conformer Algorithm based on Energy Screening and Recursive
Buildup) is available for conformation generation in the Accelrys Discovery Studio
product. Internally, the program represents a molecule as a tree, where the nodes are the smallest conformational units the molecule can be fragmented into and the edges are rotatable bonds linking the units. To expand this tree representation into 3-D space and to generate conformations, lists of conformational templates are assigned to the nodes. Energy calculations are performed by using the Catalyst force field and these parameters derived from the CHARMm [48, 49].
The previously generated *.dsv files that include the binding sites of the receptors and the *.sd files of the ligands were used for CAESAR. The parameters were set as default for each tool and runs of the software were performed. The main docking parameters are listed in Table 3.2.
Table-3.2: Important parameters used for CAESAR studies
Docking Parameters CAESAR
Number of hot spots 100
Docking tolerance number 0.25
Docking preferences Fast search
Conformation method CAESAR
In the next chapter the ligands that were generated and the results of the molecular docking are described.
Chapter 4: Ligands Designed by Denovo Molecular
Modelling Methods
4.1. Introduction
In the previous studies, the ligands that were designed for MAO isoenzymes have been investigated and their structural properties were analyzed in Chapter 2. Based on these properties, molecular structures called “scaffold” were formed. New ligands were created by adding subgroups to these scaffold structures. Since the chiral is the center, docking studies were performed for two optic isomers (R and S forms) of each compound.
These ligands, containing pyrazoline rings, were generated based on a total of 6 scaffolds. Docking procedures of these ligands were carried out by AutoDock, GOLD and CAESAR. Then the results were analyzed and a total of 50 ligands (25 pairs of R and S isoforms) that yield the best scores were selected. Then other docking procedures were carried out with these 50 ligands and the results were analyzed.
In this chapter firstly, structural information of these side groups and the added side groups are discussed. Secondly, the coding system used for this study is explained. And finally, chemical structures of the 50 ligands are listed in the Table-4.7.
4.2 Properties of the Scaffolds and Side Groups of the Generated Ligands
Table-4.1: Naming of the ligands [50].
Main ligand structures were generated by adding R groups to a single scaffold for this group. While R1 represents these main ligand structures, R2 and R3
represent the repetition of the side groups that yielded the best scores on the previous studies.
Definitions of the codes that were assigned to ligands are as follows:
1. Parts that form the main scaffold structures were named as R1 and represented by the numbers 1, 2, 3, 4, 5, and 6.
2. Sections named as R2 and R3 are the side groups added to these scaffolds and are represented by the letters a, b, c, d, and e.
3. R and S isomers are represented with the letters “r” and “s” respectively. 4. A total of 300 ligands are generated.
The docking procedures of the ligands generated have been carried out using AutoDock, GOLD, CAESAR software as detailed in Chapter 3. The docking scores of these 2 programs were listed from the highest to the lowest. 25 pairs of ligands yielding the highest scores are selected for processing with the other docking software.
4.3 Ligands Chemical Structure of Selected According AUTODOCK, GOLD and CAESAR Results
Table-4.2: Chemical structure of selected ligands according to AutoDock, GOLD
Chapter 5: Results and Discussion
5.1 Introduction
In this chapter 50 ligands that yielded the best scores were selected among the 300 ligands that were generated in this study and the results were analyzed.
Firstly, AutoDock, GOLD and CAESAR scores of all ligands that were generated for his study are listed. Secondly, the 25 pairs of ligands that yielded best scores are selected based on both 2 of the racemic forms (R and S forms). Thirdly, these scores and results were analyzed for both MAO enzymes and the highlights were listed.
Then 3 pairs of ligands (R and S forms) that have the highest potential to become drug candidates are selected for both MAO enzymes and the results were analyzed. Images of these ligands positioned at the sites in the enzymes were illustrated in both 2-D and 3-D format. Their interactions, selectivity and the results for both of the enzymes were analyzed and discussed.
The results of the docking studies for the 50 ligands selected are listed on the Table 5.1 below. The criteria used for the selection of these ligands are as follows:
1. The ligand has to yield high scores for MAO-A or MAO-B enzyme in both of the
racemic forms.
2. The ligand has to yield acceptable scores in all 3 of the docking methods.
3. If the ligand shows high affinity to only one of the enzymes, the unacceptable
scores yielded for the other enzyme can be added to the table for re-evaluation.
4. Taking the above variables into account, the ligands yielding the highest scores
among the 300 ligands can be eliminated if necessary.
The reason for this selection process is that, in the event of chemical synthesis both of the racemic forms of the ligand would be synthesized together and if one of the racemic forms yielded a lower score, the molecule containing both racemic forms would show a lower binding affinity and thus the molecule would fail as a drug candidate.
Table-5.1: Docking scores of the 50 ligands obtained by AutoDock, GOLD and
CAESAR for MAO-A and MAO-B isoenzymes:
MAO-A MAO-B Ligand code AutoDock Ki GOLD CEASAR AutoDock Ki GOLD CEASAR 1aar 352,17 nM 69,28 104,39 227,08 nM 70,33 104,42 1aas 174,09 nM 73,84 98,11 2,65 uM 72,95 102,24 1acr 147,59 nM 74,21 108,54 160,31 nM 74,35 99,44 1acs 110,52 nM 72,11 99,37 2,64 uM 70,43 96,52 1aer 202,57 nM 75,99 93,14 386,45 nM 75,63 89,85 1aes 124,76 nM 78,5 118,38 5,43 uM 77,82 112,62 1bcr 80,67 nM 79,14 103,73 101,25 nM 79,15 95,62 1bcs 202,51 nM 76,79 123,08 1,54 uM 76,92 93,75 1car 377,10 nM 69,38 112,79 101,71 nM 67,61 109,15 1cas 161,41 nM 70,49 120,59 1,22 uM 70,63 108,99 1ccr 198,92 nM 70,96 105,01 70,71 nM 70,64 98,9 1ccs 163,46 nM 72,97 95,05 1,53 uM 70,12 98,4 1dcr 94,00 nM 77,07 88,03 219,13 nM 75,3 100,48 1dcs 109,60 nM 75,65 76,65 2,18 uM 75,09 98,69
1des 135,20 nM 82,87 94,39 313,58 nM 81,78 104,65 1ear 141,26 nM 73,26 117,88 141,41 nM 73,21 96,85 1eas 165,55 nM 76,92 90,76 1,94 uM 76,88 117,07 1ecr 58,23 nM 76,68 109,66 149,25 nM 76,3 89,87 1ecs 169,92 nM 75,65 106,21 1,48 uM 76,56 95,88 1eer 92,14 nM 76,78 90,46 573,10 nM 76,37 103,92 1ees 307,55 nM 79,35 105,87 6,29 uM 79,05 95,32 3aar 162,43 nM 73,98 103,77 40,38 nM 73,9 102,95 3aas 22,09 nM 76,84 110,24 142,51 nM 76,7 110,21 3bar 118,56 nM 79,35 110,03 30,36 nM 79,14 113,85 3bas 94,69 nM 79,72 84,02 86,11 nM 78,47 85,68 3car 116,42 nM 73,48 105,01 17,53 nM 72,68 109,88 3cas 1,27 uM 72,29 84,66 70,07 nM 72,34 111,95 3ear 70,83 nM 74,86 117,65 33,11 nM 70,15 111,44 3eas 3,25 uM 76,7 83,37 122,55 nM 77,16 116,29 4aar 29,28 nM 78,86 117,84 590,69 nM 78,09 115,08 4aas 8,17 nM 83,54 116,85 1,22 uM 80,87 127,65 4abr 43,49 nM 69,85 116,98 1,29 uM 71,01 114,17 4abs 9,93 nM 82,29 123,08 24,46 uM 81,51 120,26 4acr 28,49 nM 82,69 87,13 571,79 nM 82,96 114,61 4acs 5,93 nM 84,32 112,93 2,13 uM 83,9 117,71 4bbr 11,59 nM 87,44 122,77 9,05 uM 86,88 102,97 4bbs 24,03 nM 74,84 123,34 558,86 nM 74 115,96 4bcr 19,15 nM 86,35 98,69 31,33 nM 85,56 105,28 4bcs 29,16 nM 86,82 107,47 1,28 uM 83,5 103,44 4dar 12,54 nM 81,82 99,7 104,20 nM 80,67 117,13 4das 7,81 nM 88 107,03 1,62 uM 81,24 76,25 5aar 54,25 nM 72,68 117,82 13,41 uM 72,26 116,2 5aas 94,23 nM 87,99 121,73 2,17 uM 87,3 105,8 5bar 27,13 nM 77,6 115,93 10,10 uM 77 106,11 5bas 41,87 nM 92,28 100,02 1,31 uM 91,75 81,45 5car 15,45 nM 69,38 95,13 28,77 mM 69,14 114,76 5cas 144,66 nM 81,46 108,17 211,63 uM 80,83 103,79 5dar 41,70 nM 76,77 118,57 18,77 uM 75,79 133,93 5das 54,58 nM 92,83 115,43 1,49 uM 90,5 114,54 Continuation of Table-5.1
• Taking the main scaffold structure into account, we observe that 6 scaffolds are generated based on this structure. I conducted my study by changing the side groups of these 6 scaffolds. While 1, 3, 4, 5 series ligands show a good potential as inhibitor candidates, 2 and 6 series seem to be inadequate.
• Ligands show a higher binding affinity to MAO-A enzyme, compared to MAO-B. • Ki values obtained by AutoDock of the selected 50 ligands for MAO-A range
between 5.93 nM and 3.25 uM. Values in micrometers (1 uM = 1000 nM) were observed for only 2 ligands. General average is approximately 104.5 nM, and this can be considered as a good score.
• GOLD scores of the selected 50 ligands for MAO-A are between 69.28 and 92.83. Average is approximately 78.1 and this can be considered as a good score.
• CAESAR scores of the selected 50 ligands for MAO-A are between 76.65 and 123.34. Average is approximately 105.5 and GOLD scores of the selected 50 ligands for MAO-B are between 67.61 and 91.75. Average is approximately 77.3 and this can be considered as a good score. In addition the values are in parallel with MAO-A values.
• CAESAR scores of the selected 50 ligands for MAO-B are between 76.25 and 133.93. Average is approximately 105.73 and this can be considered as a good score. In addition the values are in parallel with MAO-A values.
• Ki values obtained by AutoDock of the selected 50 ligands for MAO-B range between 17.53 nM and 211,63 uM. Values in micrometers (1 uM = 1000 nM) were observed for many more ligands compared to MAO-A. Even an extreme value of 28.77 mM was observed. General average is approximately 104.5 nM.
• If the 2 extreme values of 211.63 uM and 28.77 mM are omitted, the average is recalculated to be approximately 2.6 uM. Even though this score can be considered relatively unpromising, almost half of the ligands yielded nanomolar scores, and this confirm the possibility of obtaining ligands with good inhibition properties.
Correlation tables are shown below at the Figure-5.1 and 5.2. These correlation tables reflect the results of the three docking procedures relative to each other. The idea behind these correlation tables is to convert all the results into a single unit and discuss the relation and consistency of the procedures.
Figure-5.2: Correlation between docking methods for MAO-B graphic
A scoring system was developed in order to put these tables together. In this system, the docking scores yielding the best results were considered to be the highest score in the related interval. Since different docking software use different algorithms and scoring functions, it was not possible to obtain identical score values, but the relative consistency of the curves gives a general idea regarding the correlation of the docking programs. The results of this analysis are listed below:
• There is a high level of correlation between docking programs for MAO-A. Optimal results were observed at the scaffold series of 1, 4, and 5.
• Correlation between docking programs was observed to be better for MAO-B compared to MAO-A. Optimal results for CAESAR were observed at series 3 and 4, for GOLD at series 3, 4, 5, and for AutoDock at series 3 and 4.
• In general the results obtained by different docking software were observed to be in consistency with each other.
5.4 Detailed Analysis of the Fundamental Results of Docking Studies
In this section docking results of R and S isoforms of the 6 ligands that yielded the most promising results were discussed and analyzed in detail.
2-D and 3-D images of the ligands positioned at the binding sites of MAO enzymes were taken and their interactions were analysed according to these images.
5.4.1 Ligands Selected for MAO-A Enzyme
5.4.1.1 Evaluation of 4bcr/4bcs Ligands for MAO-A Enzyme
2-D and 3-D images of 4bcr inhibitor positioned at the active site cavity of MAO-A enzyme by molecular modelling method are illustrated on Figure-5.3 and 5.4
Figure-5.3: Position of 4bcr ligand in MAO-A enzyme and 2-D representation of
its interactions
It was observed that pi-pi interaction took place between the phenyl ring of the ligand and the amino acid residues forming the aromatic cage at a distance of 3.5 and 3.6Å. In addition the ligand folded onto itself and formed a pi-pi interaction with furan ring at the center and the other phenyl ring at a distance of 6Å and this increased the stability of the ligand. Further more, a pi-sigma interaction was formed with Phe208 and the furan ring at 3.6Å, and a hydrogen bond was formed with Gln215.
VdW interactions were formed between the inhibitor and the surrounding Val210, Gln215, Cys323, Tyr444, Asn181, Ile207, Phe208, Ser209 amino acids. Polar interactions were formed between the inhibitor and both FAD coenzyme, and Ile335, Met350, Thr336, Leu337, Phe352, Tyr407, Tyr197, Gly443, Ile180 amino
Figure-5.4: Position of 4bcr ligand in MAO-A enzyme and 3-D representation of
its interactions
For Mao-A, AutoDock inhibition constant Ki= 19.15nM, GOLD score= 86.35
and CAESAR score= 98.69. For Mao-B, AutoDock inhibition constant Ki=
31.33nM, GOLD score= 85.56 and CAESAR score= 105.28.
Based on my analysis this inhibitor is considered to be a better MAO-A inhibitor candidate because of the interactions of the inhibitor with the coenzyme, the aromatic cage and many amino acids. In addition the phenyl and furan rings of the inhibitor bond with the MAO-A enzyme at a close range.
2-D and 3-D images of 4bcs inhibitor positioned at the active site cavity of MAO-A enzyme by molecular modelling method are illustrated on Figure-5.5 and 5.6.
According to this, pi-sigma interaction took place between the phenyl ring of the inhibitor and Asn181 amino acid at a distance of 3.9 Å.