IS S N 1 3 0 3 –5 9 9 1
A STUDY ON MODELING OF PHENOMENA AIR CONDITIONING DATA
MEHMET YILMAZ AND BUSE BÜYÜM
Abstract. This study is based on modeling of phenomena air-conditioning data set, which has been trying to model in many times by di¤erent authors, with mixed exponential distribution with two-component (2MED). Since 1963, the whole data or some part of the data has been taken as real data in mod-eling study. These studies have been taken into account to detect the best model. Inspiring from studies led by Proschan F. (1963), the obtained results by modeling this data set with 2MED are of our interest. For this purpose, brief summary of the studies in literature has been given. After that, the re-sults have been compared with rere-sults of 2MED. We claim that 2MED will be located among the purposed models.
1. INTRODUCTION
One can generally point out that data set has only one law in modeling and estimation problems. However, it’s possible that obtained data appear as mixture of either same distribution or di¤erent distribution family which is called conta-minated. For example, …rst failure time of products that have same function in di¤erent qualities and patients’length of stay in hospital can be modelled by mix-ture of exponential distribution.
Air-conditioning data set that has been obtained for the …rst time by [12] is probably most analyzed in statistical literature. In [12], the data set has been modelled with exponential distribution. Later in many di¤erent studies, while re-searches have been trying to model this data set, some of them have used non-mixture distributions and some of them have used non-mixture distributions. For example, the data set has been modelled in [3] by Exponential distribution, in [7] by Gamma distribution, in [9] by Weibull distribution, in [11] by Gamma-Dagum distribution and in [14] by Inverse Rayleigh distribution. Except from these, researches have used Exponential-Poisson (EP), Exponential-Gamma (EG),
Received by the editors Octob. 31, 2014; Accepted: Nov. 30, 2014.
2000 Mathematics Subject Classi…cation. Primary 05C38, 15A15; Secondary 05A15, 15A18. Key words and phrases. Air-conditioning data, expectation-maximization algorithm (EM), least square method (LSE), life data modeling, maximum likelihood method (MLE), mixed expo-nential distribution.
c 2 0 1 4 A n ka ra U n ive rsity
Exponential-Logarithmic (EL) and Exponential-Binomial (EB) as a mixture distri-butions in [8], [15], [2] and [16].
In addition to studies above, whether the question of that this data set can be modelled or not by 2MED has created the source of the current study. From this point, 2MED and the methods of parameter estimation for this distribution will be introduced …rstly. Then, the results that is obtained from other studies and from this study will be compared. In the comparison, Kolmogrov-Smirnov test statistics (KS) will be considered. Parameter estimations, KS values and p values (p) have been obtained by MATLAB.
2. MATERIAL AND METHODS
In the literature, [1] and [5] have mentioned …nite mixture distributions and methods of parameter estimation for them. In this section, 2MED will be consid-ered.
2.1. Mixed exponential distribution with two-component (2MED). Prob-ability density function (pdf) of 2MED is given below.
f (x; ; 1; 2) = f1(x; 1)+(1 )f2(x; 2) = 11exp( x= 1)+(1 )12exp( x= 2)
where 2 (0; 1), i > 0 (i = 1; 2); x > 0: Similarly the cumulative distribution
function (cdf) is as follows.
F (x; ; 1; 2) = F1(x; 1) + (1 )F2(x; 2)
= (1 exp( x= 1)) + (1 )(1 exp( x= 2)):
Survival function,
S(x; ; 1; 2) = S1(x; 1) + (1 )S2(x; 2) = exp( x= 1) + (1 ) exp( x= 2)
and the hazard function,
h(x; ; 1; 2) = h1(x)SS11(x;(x; 11)+(1)+(1 )h)S22(x;(x)S22)(x; 2)
= h1(x) S1(x;1)+(1S1(x; 1)S) 2(x; 2)+ h2(x) S1(x;(11)+(1)S2(x;)S22)(x; 2)
= h1(x)w1(x; ; 1; 2) + h2(x)w2(x; ; 1; 2);
where hi(x) = 1i and w1(:) + w2(:) = 1:
3. PARAMETER ESTIMATION METHODS
In this section, maximum likelihood estimation (MLE) and least square estima-tion (LSE) are given for 2MED.
3.1. Maximum likelihood estimations (MLE). In general, the likelihood equa-tion systems emerge as nonlinear equaequa-tions. Because of this, the numerical methods are preferred for the solution of likelihood equations. In this study, Expectation-Maximization (EM) algorithm which is one of the common numeric method will be mentioned. The EM algorithm was found by [4] and also was studied in [10] and [13].
Let X = fX1; X2;:::;Xng be a random sampling with independent and identically
distributed as 2MED having a pdf f (x; ) where = ( ; 1; 2) is a parameter
vector. The likelihood function, the logarithmic form of the likelihood function of are given in below, respectively.
L( ; x) = n Q j=1 [ 2 P i=1 i1iexp( xj= i)] log L = n P j=1 log[ 2 P i=1 i 1 iexp( xj= i)] ( 2 P i=1 i 1) where 2 P i=1
i= 1. If the derivative of this function respect to i; i = 1; 2 is equalized
to zero, d log L d i = n P j=1 1 iexp( xj= i) 2 P i=1 i1iexp( xj= i) = 0 then n X j=1 1 iexp( xj= i) 2 P i=1 i1iexp( xj= i) = (3.1)
If the both side of (3.1) is multiplied with i and sum over index i: n P j=1 2 P i=1 i1 iexp( xj= i) 2 P i=1 i 1 iexp( xj= i) = i
then n = : Based on Bayes rule, the probability that xj belongs to ithcomponent
when Xj = xj is observed is as follows:
P (i j xj) = i1iexp( xj= i) 2 P i=1 i1iexp( xj= i) : Thus, bi= n P j=1 P (ijxj) n ; i = 1; 2:
If the derivative of log L with respect to i is equalized to zero, d log L d i = n P j=1 i i( xj 2 i ) exp( xj i ) i 2 i exp( xj i ) 2 P i=1 i1iexp( xj= i) = 0 .. . bi= n P j=1 xjP (ijxj) n P j=1 P (ijxj) ; i = 1; 2
is obtained. Its reminded that P (2 j xj) = 1 P (1 j xj), then the solutions will be b1= 1 nbi n P j=1 xjP (i j xj) b2= n(11b i) n P j=1 xj(1 P (i j xj)):
These are step solutions obtained by EM which steps are given in below. (1) Input the initial values. ( (0)i ; (0)i ); i = 1; 2:
(2) Calculate the P (i j xj).
(3) Calculate (k)i ; (k)i
(4) After calculations ofbi and bi, the values replace in logL and get the value
of function. For > 0 selected small enough log L(k) log L(k 1)
is provided then the values on the kth step will be used for parameter
estimations. Step 2-4 are repeated until converge is accomplished.
3.2. Least squares estimations (LSE). This method is based on the idea that there is a regression relationship between empirical bF and parametric F distribu-tions. Considering ordered observations x(1) x(2) ::: x(n) versus empirical
distribution bF (x(i)) n+1i , the vector which minimizes the following expression
is tried to determine. Detailed study was given in [6] for non-mixture Generalized Exponential Distribution. System of equations that is occurred for the solutions for this optimization problem is as follows.
Q( ) = n P i=1 ( bF (x(i)) F (x(i); ))2 dQ d = n P i=1
(n+1i - (1-exp(-x(i)/ 1))-(1- )(1-exp(-x(i)/ 2))) n P i=1 (1-exp(-x(i)/ 2) - (1-exp(-x(i)/ 1)))=0 dQ d 1= n P i=1
(n+1i - (1-exp(-x(i)/ 1))-(1- )(1-exp(-x(i)/ 2)))( x(i) 2 1 exp (-x(i)/ 1))=0 dQ d 2= n P i=1
(n+1i - (1-exp(-x(i)/ 1))-(1- )(1-exp(-x(i)/ 2)))((1 2)x(i)
2 exp
(-x(i)/ 2))=0
Since the equations are in a complex structure and are related to parameters, it is di¢ cult to obtain the solutions. Therefore it is necessary to use numerical ways.
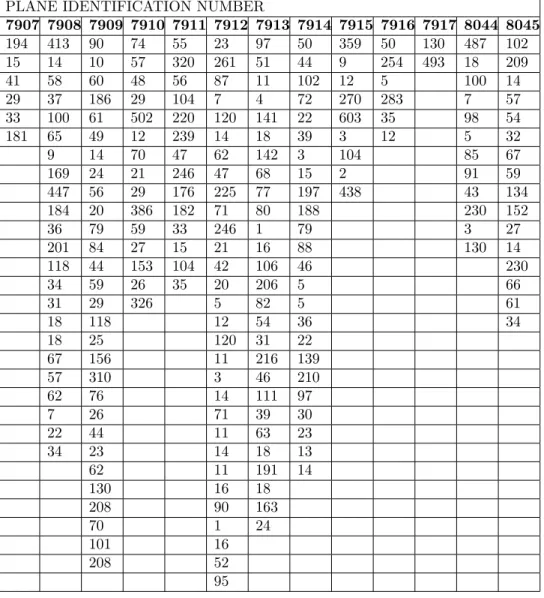
4. COMPARISON WITH MODELING STUDIES IN LITERATURE In this section, the results obtained from studies in literature and from current study will be compared.The whole data of failure times in air-conditioning systems which is examined by [12] for the …rst time is given in Table 1. Some of authors such as [2], [8], [11] and [15] have considered to model whole data set. The others have considered failure times of speci…c plane identi…cation numbers that are appropriate for their suggested models.
In the current study, both the whole data set and the speci…c data set have been handled and have been modelled with 2MED. Appealing results about phenomena air-conditioning data have been obtained.
Table 1. A ir-conditioning data set
PLANE IDENTIFICATION NUMBER
7907 7908 7909 7910 7911 7912 7913 7914 7915 7916 7917 8044 8045 194 413 90 74 55 23 97 50 359 50 130 487 102 15 14 10 57 320 261 51 44 9 254 493 18 209 41 58 60 48 56 87 11 102 12 5 100 14 29 37 186 29 104 7 4 72 270 283 7 57 33 100 61 502 220 120 141 22 603 35 98 54 181 65 49 12 239 14 18 39 3 12 5 32 9 14 70 47 62 142 3 104 85 67 169 24 21 246 47 68 15 2 91 59 447 56 29 176 225 77 197 438 43 134 184 20 386 182 71 80 188 230 152 36 79 59 33 246 1 79 3 27 201 84 27 15 21 16 88 130 14 118 44 153 104 42 106 46 230 34 59 26 35 20 206 5 66 31 29 326 5 82 5 61 18 118 12 54 36 34 18 25 120 31 22 67 156 11 216 139 57 310 3 46 210 62 76 14 111 97 7 26 71 39 30 22 44 11 63 23 34 23 14 18 13 62 11 191 14 130 16 18 208 90 163 70 1 24 101 16 208 52 95
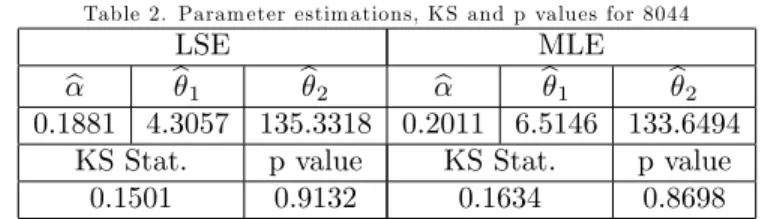
4.1. The Studies Using Non-Mixture Distribution. In [3], the failure times of 8044 have been handled and have been modelled with exponential distribution like in [12]. As a result of modeling, KS=0.1873 and p=0.7282 are obtained. As the same data set has been modelled by 2MED, the results are given in the table below.
Table 2. Param eter estim ations, K S and p values for 8044
LSE MLE
b b1 b2 b b1 b2
0.1881 4.3057 135.3318 0.2011 6.5146 133.6494
KS Stat. p value KS Stat. p value
0.1501 0.9132 0.1634 0.8698
When the KS values have been compared, one can noticed that the values ob-tained from 2MED for two methods are less than the values obob-tained from expo-nential distribution. Therefore, 2MED is more successful about modeling this data set.
The failure times of 7912 have been taken into account in [7]. In this study, …rstly the exponential distribution has been handled and KS=0.2419 and p=0.0497 have been found. So it has been pointed out that exponential distribution is not suitable for 7912. Then the generalized exponential and gamma distributions have been regarded. KS and p values about these two distributions are given in the following table.
Table 3. K S and p values for G am m a and G eneralized Exp onential D istribution
DISTRIBUTION METHOD KS VALUE p VALUE
Gamma MLE 0.1706 0.3135
Generalized Exponential MLE 0.1744 0.2926
As the same data set has been modelled by 2MED, parameter estimations, KS and p values are shown in the table below.
Table 4. Param eter estim ations, K S and p values for 7912
LSE MLE
b b1 b2 b b1 b2
0.5534 105.1185 17.6043 0.6514 83.1754 15.555
KS Stat. p value KS Stat. p value
0.1292 0.6517 0.1241 0.6987
When the KS values have been compared for these three distributions, it has been seen that the smallest KS value belongs to 2MED. It shows that the best model for 7912 can be made by 2MED.
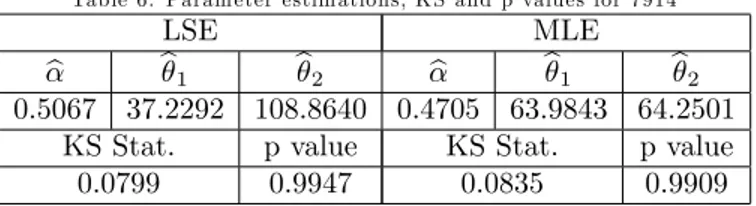
Both the failure times of 7913 and 7914 have been considered in [9] and Weibull distributions has been suggested for modeling. For 7913 KS=0.08833 p>0.5 and for 7914 KS=0.08953 p>0.5 have been found. Parameter estimations, KS and p values for 2MED are shown in the tables below.
Table 5. Param eter estim ations, K S and p values for 7913
LSE MLE
b b1 b2 b b1 b2
0.4006 84.6545 85.2081 0.4007 76.7802 76.8380
KS Stat. p value KS Stat. p value
Table 6. Param eter estim ations, K S and p values for 7914
LSE MLE
b b1 b2 b b1 b2
0.5067 37.2292 108.8640 0.4705 63.9843 64.2501
KS Stat. p value KS Stat. p value
0.0799 0.9947 0.0835 0.9909
As seen from the tables, KS value obtained from 2MED is less than obtained from Weibull distribution for two aircrafts. Therefore one can be said that modeling with 2MED is more appropriate instead of modeling with Weibull distribution.
Considering failure times of 7910, it is indicated in [14] that Inverse Rayleigh distribution is quite suitable for this data set. As a result of modeling, KS=0.21379 and p=0.43879 have been found.
As the same data set has been modelled by 2MED, parameter estimations, KS and p values are shown in the table below.
Table 7. Param eter estim ations, K S and p values for 7910
LSE MLE
b b1 b2 b b1 b2
0.8418 63.8913 1230 0.5934 44.4595 233.3597
KS Stat. p value KS Stat. p value
0.1718 0.7059 0.1917 0.5749
When a comparison is made according to KS values, it can be seen that 2MED is better about modeling this data set.
Considering whole data set, Weibull and Gamma distributions have been used as non-mixture distribution in [8] and [2]. KS and p values obtained from these distributions are given in the table below.
Table 8. K S and p values for Weibull and G am m a D istribution
DISTRIBUTION KS VALUE p VALUE
WEIBULL 0.0509 0.6393
GAMMA 0.0634 0.3586
As [8] and [2], also [15] has proposed Weibull and Gamma distribution for whole data set. According to [15], KS and p values are given in the following table.
Table 9. K S and p values for Weibull and G am m a D istribution
DISTRIBUTION KS VALUE p VALUE
WEIBULL 0.0519 0.6025
GAMMA 0.0625 0.3665
Finally, speci…ed type of Gamma Dagum (GD) such as Gamma-Burr III (GB III), Gamma-Fisk or Gamma-Log Logistic (GF of GLLog), Zografos and Balakrishnan-Dagum (D), Burr III (B III), Fisk of Log Logistic (F or ZB-LLog), Burr III(B III) and Fisk or Log Logistic (F or ZB-LLog), Gamma Exponentiated Weibull (GEW) have been proposed for whole data set in [11]. Following table includes KS values for these distributions.
Table 10. K S values for G D , ZB-D , ZB-Burr III, ZB-Fisk, D and G EW D istribution DISTRIBUTION KS VALUE GD 0.0401 ZB-D 0.0982 ZB-Burr III 0.0782 ZB-Fisk 0.0467 D 0.0421 GEW 0.3863
The values obtained from 2MED are given in the below.
Table 11. Param eter estim ations, K S and p values for w hole data set
LSE MLE
b b1 b2 b b1 b2
0.7234 60.5029 198.4490 0.4311 46.6148 128.4549
KS Stat. p value KS Stat. p value
0.0460 0.7410 0.0482 0.6881
It is came out that 2MED is more appropriate about modeling according to KS criteria between 8 distributions proposed to model whole data set. Furthermore, 2MED is fourth order between distributions proposed in [11] so it can be said that 2MED have located among the suggested distributions.
4.2. The Studies Using Mixture Distribution. The failure times of 7912 have been modelled by mixed generalized exponential distribution with two component in [16]. As a result of modeling obtained values are as KS=0.1391 and p=0.5598.
In current study, this data set has been considered that can be modelled by 2MED. Parameter estimations, KS and p values are given in Table 4 according to MLE and LS methods.
It has been seen that the data set has been modelled both mixed and non-mixture distributions. As comparing results, it can be seen that 2MED is more successful about modeling this data set.
Considering whole data set, in addition to non-mixture distributions, mixture distributions such as EP and EG have been handled in [8]. KS and p values obtained from these distributions are given in the table below.
Table 12. K S and p values for EP and EG D istribution
DISTRIBUTION KS VALUE p VALUE
EP 0.0470 0.7351
EG 0.0494 0.6759
Besides [8], [15] have proposed EL to model whole data set.
Table 13. K S and p values for EL, EP and EG D istribution
DISTRIBUTION KS VALUE p VALUE
EL 0.0491 0.6731
EP 0.0470 0.7248
[2] has contributed [8] and [15] proposing EB in their study. The obtained values are as follows.
Table 14. K S and p values for EB, EL, EP and EG D istribution
DISTRIBUTION KS VALUE p VALUE
EB 0.0470 0.7356
EL 0.0491 0.6828
EP 0.0470 0.7351
EG 0.0494 0.6759
The values of 2MED for whole data set are given in table 11.
Similarly, it has been concluded that the best distribution to model for whole data set is 2MED when KS values obtained from [2], [8], [15] and current study have been compared.
5. CONCLUSION
The current study has regarded 10 di¤erent studies about modeling aircraft data set in the literature. Some of the studies have modelled the data set with non-mixture distributions and some of them have used mixture of two di¤erent distributions or same distributions.
Examining the results given in detail in Section 4, it is observed that the best model is 2MED almost all of the comparisons among 16 distributions. In case 2MED may not be recommended as the best model due to obtained KS values according to the MLE for the generally. Even in this case, 2MED has located in the best of the …rst three distribution. In addition to this case, 2MED is the fourth order to model the whole data set among proposed 6 distributions in [11]. Therefore suggested mixed distribution emerges as a distribution can be suggested and …rst come to mind.
Additionally, considering the results of the current study, 2MED is more appro-priate to propose as a model instead of exponential distribution for the data set modelled with exponential distribution for the …rst time by [12].
Acknowledgement 1. This research has been funded by A.U. BAP O¢ ce. References
[1] Aç¬kgöz, I., 2007. Sonlu karma da¼g¬l¬mlarda parametre tahmini, PhD Thesis, Graduate School of Natural and Applied Sciences, Ankara University, Turkey.
[2] Chahkandi, M. and Ganjali, M., 2009. On some lifetime distributions with decreasing failure rate. Computational Statistics and Data Analysis, Vol. 53, , pp. 4433- 4440.
[3] Davison, A.C. and Hinkley D.V., 1997. Bootstrap methods and their application, Cambridge Series in Statistical and Probabilistic Mathematics, 1 edition, 594 p.
[4] Dempster, A.P., Laird, N.M., Rubin, D.B., 1977. Maximum likelihood from incomplete data via the EM algorithm (with discussion). J. Roy. Statist.Soc. Ser. B 39, 1-38.
[5] Everitt, E.S. and Hand, D.J., 1981. Finite Mixture Distributions, London: Chapman and Hall.
[6] Gupta, R.D. and Kundu, D., 2000. Generalized exponential distribution: di¤erent method of estimations, Journal of Statistical Computation Simulation, Vol. 00, pp. 1 - 22.
[7] Gupta R.D. and Kundu, D., 2003. Closeness of Gamma and Generalized Exponential Distri-bution. Communications in Statistics, Volume 32, Issue 4, , pp. 705-721.
[8] Kus, C. 2007. A new lifetime distribution, Computational Statistics & Data Analysis, 51 4497 - 4509.
[9] Lin, C. and Ke, S., 2013. Estimation of P(Y<X) for location-scale distributions under joint progressively type-II right censoring. Quality Technology &Quantitative Management, Vol. 10, No. 3, pp. 339-352.
[10] G.J. McLachlan, G.J. and Krishnan, T., 2008. The EM algorithm and extensions. John Wiley & Sons, Inc., Hoboken, New Jersey.
[11] Oluyede, B. O., Huang, S. and Pararai, M., 2014. A New Class of Generalized Dagum Distrib-ution with Applications to Income and Lifetime Data, Journal of Statistical and Econometric Methods, vol.3, no.2, 125-151.
[12] Proschan, F., 1963. Theoretical explanation of observed decreasing failure rate. Technometrics 5, 375-383.
[13] Ren, Y., 2011. The methodology of ‡owgraph models, PhD Thesis, Department of Statistics London School of Economics and Political Science.
[14] A.I. Shawky, A.I., Badr, M.M., 2012. Estimations and prediction from the inverse rayleigh model based on lower record statistics. Life Science Journal (9;1).
[15] Tahmasbi, R., Rezaei, S., 2008. A two-parameter lifetime distribution with decreasing failure rate. Computational Statistics and Data Analysis, Vol. 52, pp.3889-3901.
[16] Tian,Y., Tian, M. and Zhu, Q., 2014. Estimating a Finite Mixed Exponential Distribution under Progressively Type-II Censored Data, Vol. 43(17), pages 3762-3776.
Current address : Ankara University, Faculty of Sciences, Dept. of Statistics, Ankara, TURKEY E-mail address : [email protected], [email protected]