Observation of χ_{cJ} decays to ΛΛ[over ¯]π^{+}π^{-}
M. Ablikim et al. (BESIII Collaboration)Phys. Rev. D 86, 052004 — Published 13 September 2012 DOI: 10.1103/PhysRevD.86.052004
REVIEW COPY
NOT FOR DISTRIBUTION
Observation of χ
cJDecays to Λ ¯
Λπ
+π
−M. Ablikim1, M. N. Achasov5, D. J. Ambrose39, F. F. An1, Q. An40, Z. H. An1, J. Z. Bai1,
Y. Ban27, J. Becker2, M. Bertani18A, J. M. Bian38, E. Boger20,a, O. Bondarenko21, I. Boyko20, R. A. Briere3, V. Bytev20, X. Cai1, O. Cakir35A, A. Calcaterra18A, G. F. Cao1, S. A. Cetin35B,
J. F. Chang1, G. Chelkov20,a, G. Chen1, H. S. Chen1, J. C. Chen1, M. L. Chen1, S. J. Chen25, Y. B. Chen1, H. P. Cheng14, Y. P. Chu1, D. Cronin-Hennessy38, H. L. Dai1, J. P. Dai1,
D. Dedovich20, Z. Y. Deng1, A. Denig19, I. Denysenko20,b, M. Destefanis43A,43C, W. M. Ding29, Y. Ding23, L. Y. Dong1, M. Y. Dong1, S. X. Du46, J. Fang1, S. S. Fang1, L. Fava43B,43C,
F. Feldbauer2, C. Q. Feng40, R. B. Ferroli18A, C. D. Fu1, J. L. Fu25, Y. Gao34, C. Geng40, K. Goetzen7, W. X. Gong1, W. Gradl19, M. Greco43A,43C, M. H. Gu1, Y. T. Gu9, Y. H. Guan6,
A. Q. Guo26, L. B. Guo24, Y. P. Guo26, Y. L. Han1, F. A. Harris37, K. L. He1, M. He1, Z. Y. He26, T. Held2, Y. K. Heng1, Z. L. Hou1, H. M. Hu1, J. F. Hu6, T. Hu1, G. M. Huang15,
J. S. Huang12, X. T. Huang29, Y. P. Huang1, T. Hussain42, C. S. Ji40, Q. Ji1, X. B. Ji1, X. L. Ji1, L. L. Jiang1, X. S. Jiang1, J. B. Jiao29, Z. Jiao14, D. P. Jin1, S. Jin1, F. F. Jing34,
N. Kalantar-Nayestanaki21, M. Kavatsyuk21, W. Kuehn36, W. Lai1, J. S. Lange36, C. H. Li1, Cheng Li40, Cui Li40, D. M. Li46, F. Li1, G. Li1, H. B. Li1, J. C. Li1, K. Li10, Lei Li1, Q. J. Li1,
S. L. Li1, W. D. Li1, W. G. Li1, X. L. Li29, X. N. Li1, X. Q. Li26, X. R. Li28, Z. B. Li33, H. Liang40, Y. F. Liang31, Y. T. Liang36, G. R. Liao34, X. T. Liao1, B. J. Liu1, C. L. Liu3,
C. X. Liu1, C. Y. Liu1, F. H. Liu30, Fang Liu1, Feng Liu15, H. Liu1, H. B. Liu6, H. H. Liu13, H. M. Liu1, H. W. Liu1, J. P. Liu44, K. Y. Liu23, Kai Liu6, P. L. Liu29, Q. Liu6, S. B. Liu40,
X. Liu22, X. H. Liu1, Y. B. Liu26, Z. A. Liu1, Zhiqiang Liu1, Zhiqing Liu1, H. Loehner21, G. R. Lu12, H. J. Lu14, J. G. Lu1, Q. W. Lu30, X. R. Lu6, Y. P. Lu1, C. L. Luo24, M. X. Luo45,
T. Luo37, X. L. Luo1, M. Lv1, C. L. Ma6, F. C. Ma23, H. L. Ma1, Q. M. Ma1, S. Ma1, T. Ma1, X. Y. Ma1, Y. Ma11, F. E. Maas11, M. Maggiora43A,43C, Q. A. Malik42, Y. J. Mao27, Z. P. Mao1,
J. G. Messchendorp21, J. Min1, T. J. Min1, R. E. Mitchell17, X. H. Mo1, C. Morales Morales11, C. Motzko2, N. Yu. Muchnoi5, H. Muramatsu39, Y. Nefedov20, C. Nicholson6, I. B. Nikolaev5, Z. Ning1, S. L. Olsen28, Q. Ouyang1, S. Pacetti18B, J. W. Park28, M. Pelizaeus37,
H. P. Peng40, K. Peters7, J. L. Ping24, R. G. Ping1, R. Poling38, E. Prencipe19, M. Qi25, S. Qian1, C. F. Qiao6, X. S. Qin1, Y. Qin27, Z. H. Qin1, J. F. Qiu1, K. H. Rashid42, G. Rong1,
X. Y. Shen1, H. Y. Sheng1, M. R. Shepherd17, X. Y. Song1, S. Spataro43A,43C, B. Spruck36, D. H. Sun1, G. X. Sun1, J. F. Sun12, S. S. Sun1, Y. J. Sun40, Y. Z. Sun1, Z. J. Sun1, Z. T. Sun40,
C. J. Tang31, X. Tang1, I. Tapan35C, E. H. Thorndike39, D. Toth38, M. Ullrich36, G. S. Varner37, B. Wang9, B. Q. Wang27, K. Wang1, L. L. Wang4, L. S. Wang1, M. Wang29, P. Wang1,
P. L. Wang1, Q. Wang1, Q. J. Wang1, S. G. Wang27, X. L. Wang40, Y. D. Wang40, Y. F. Wang1, Y. Q. Wang29, Z. Wang1, Z. G. Wang1, Z. Y. Wang1, D. H. Wei8, P. Weidenkaff19,
Q. G. Wen40, S. P. Wen1, M. Werner36, U. Wiedner2, L. H. Wu1, N. Wu1, S. X. Wu40, W. Wu26, Z. Wu1, L. G. Xia34, Z. J. Xiao24, Y. G. Xie1, Q. L. Xiu1, G. F. Xu1, G. M. Xu27,
H. Xu1, Q. J. Xu10, X. P. Xu32, Z. R. Xu40, F. Xue15, Z. Xue1, L. Yan40, W. B. Yan40, Y. H. Yan16, H. X. Yang1, Y. Yang15, Y. X. Yang8, H. Ye1, M. Ye1, M. H. Ye4, B. X. Yu1,
C. X. Yu26, J. S. Yu22, S. P. Yu29, C. Z. Yuan1, Y. Yuan1, A. A. Zafar42, A. Zallo18A, Y. Zeng16, B. X. Zhang1, B. Y. Zhang1, C. C. Zhang1, D. H. Zhang1, H. H. Zhang33, H. Y. Zhang1,
J. Q. Zhang1, J. W. Zhang1, J. Y. Zhang1, J. Z. Zhang1, S. H. Zhang1, X. J. Zhang1, X. Y. Zhang29, Y. Zhang1, Y. H. Zhang1, Y. S. Zhang9, Z. P. Zhang40, Z. Y. Zhang44, G. Zhao1,
H. S. Zhao1, J. W. Zhao1, K. X. Zhao24, Lei Zhao40, Ling Zhao1, M. G. Zhao26, Q. Zhao1, S. J. Zhao46, T. C. Zhao1, X. H. Zhao25, Y. B. Zhao1, Z. G. Zhao40, A. Zhemchugov20,a,
B. Zheng41, J. P. Zheng1, Y. H. Zheng6, B. Zhong1, J. Zhong2, L. Zhou1, X. K. Zhou6, X. R. Zhou40, C. Zhu1, K. Zhu1, K. J. Zhu1, S. H. Zhu1, X. L. Zhu34, X. W. Zhu1,
Y. C. Zhu40, Y. M. Zhu26, Y. S. Zhu1, Z. A. Zhu1, J. Zhuang1, B. S. Zou1, J. H. Zou1
(BESIII Collaboration)
1 Institute of High Energy Physics, Beijing 100049, P. R. China 2 Bochum Ruhr-University, 44780 Bochum, Germany 3 Carnegie Mellon University, Pittsburgh, PA 15213, USA
4 China Center of Advanced Science and Technology, Beijing 100190, P. R. China 5 G.I. Budker Institute of Nuclear Physics SB RAS (BINP), Novosibirsk 630090, Russia
6 Graduate University of Chinese Academy of Sciences, Beijing 100049, P. R. China 7 GSI Helmholtzcentre for Heavy Ion Research GmbH, D-64291 Darmstadt, Germany
8 Guangxi Normal University, Guilin 541004, P. R. China 9 GuangXi University, Nanning 530004,P.R.China
11 Helmholtz Institute Mainz, J.J. Becherweg 45,D 55099 Mainz,Germany 12 Henan Normal University, Xinxiang 453007, P. R. China
13 Henan University of Science and Technology, Luoyang 471003, P. R. China 14 Huangshan College, Huangshan 245000, P. R. China
15 Huazhong Normal University, Wuhan 430079, P. R. China 16 Hunan University, Changsha 410082, P. R. China 17 Indiana University, Bloomington, Indiana 47405, USA 18 (A)INFN Laboratori Nazionali di Frascati, Frascati, Italy;
(B)INFN and University of Perugia, I-06100, Perugia, Italy
19 Johannes Gutenberg University of Mainz,
Johann-Joachim-Becher-Weg 45, 55099 Mainz, Germany
20 Joint Institute for Nuclear Research, 141980 Dubna, Russia 21 KVI/University of Groningen, 9747 AA Groningen, The Netherlands
22 Lanzhou University, Lanzhou 730000, P. R. China 23 Liaoning University, Shenyang 110036, P. R. China 24 Nanjing Normal University, Nanjing 210046, P. R. China
25 Nanjing University, Nanjing 210093, P. R. China 26 Nankai University, Tianjin 300071, P. R. China
27 Peking University, Beijing 100871, P. R. China 28 Seoul National University, Seoul, 151-747 Korea 29 Shandong University, Jinan 250100, P. R. China
30 Shanxi University, Taiyuan 030006, P. R. China 31 Sichuan University, Chengdu 610064, P. R. China
32 Soochow University, Suzhou 215006, China
33 Sun Yat-Sen University, Guangzhou 510275, P. R. China 34 Tsinghua University, Beijing 100084, P. R. China 35 (A)Ankara University, Ankara, Turkey; (B)Dogus University,
Istanbul, Turkey; (C)Uludag University, Bursa, Turkey
36 Universitaet Giessen, 35392 Giessen, Germany 37 University of Hawaii, Honolulu, Hawaii 96822, USA 38 University of Minnesota, Minneapolis, MN 55455, USA
39 University of Rochester, Rochester, New York 14627, USA
40 University of Science and Technology of China, Hefei 230026, P. R. China 41 University of South China, Hengyang 421001, P. R. China
42 University of the Punjab, Lahore-54590, Pakistan 43 (A)University of Turin, Turin, Italy; (B)University of
Eastern Piedmont, Alessandria, Italy; (C)INFN, Turin, Italy
44 Wuhan University, Wuhan 430072, P. R. China 45 Zhejiang University, Hangzhou 310027, P. R. China 46 Zhengzhou University, Zhengzhou 450001, P. R. China
a also at the Moscow Institute of Physics and Technology, Moscow, Russia b on leave from the Bogolyubov Institute for Theoretical Physics, Kiev, Ukraine
c also at the PNPI, Gatchina, Russia d now at Nagoya University, Nagoya, Japan
Decays of the χcJ states (J=0, 1, 2) to Λ¯Λπ+π−, including processes with
inter-mediate Σ(1385), are studied through the E1 transition ψ′ → γχ
cJusing 106 million
ψ′ events collected with the BESIII detector at BEPCII. This is the first observation of χcJ decays to the final state Λ¯Λπ+π−. The branching ratio of the intermediate
process χcJ → Σ(1385)±Σ(1385)¯ ∓ is also measured for the first time, and the results
agree with the theoretical predictions based on the color-octet effect.
I. INTRODUCTION
Decays of P -wave charmonium states, e.g., the χcJ, cannot be well explained by the
color-singlet contribution alone, although this works well in explaining the decays of S-wave charmonium, e.g., the J/ψ and ψ′. In calculations of the color-octet contribution,
Ref. [1] predicted branching ratios of χcJ →baryon+anti-baryon in which the χcJ → p¯p
result is consistent with experimental observation, while the χcJ → Λ¯Λ [2] result is not.
The calculated branching ratios are B(χc1 → Λ¯Λ) = (3.91 ± 0.24) × 10−5 and B(χc2 →
Λ¯Λ) = (3.49 ± 0.20) × 10−5, while the experimental results are (11.8 ± 1.9) × 10−5 and
(18.6±2.7)×10−5, respectively. In addition to Λ¯Λ, reference [1] also calculated the branching
ratios of χc1 → Σ(1385)¯Σ(1385) and χc2 → Σ(1385)¯Σ(1385) to be (2.15 ± 0.12) × 10−5
and (3.61 ± 0.20) × 10−5, respectively, but there are no previous experimental results on
these decay channels. Therefore, it is meaningful to test these predictions experimentally. In addition, due to the helicity selection rule, the decay of χc0 into baryon-antibaryon is
expected to be suppressed [3].
In this paper, we report measurements of χcJ → Λ¯Λπ+π− (J = 0, 1, 2) (including the
intermediate Σ(1385) resonance), χcJ → Σ(1385)±Λπ¯ ∓+ c.c., and χcJ → Σ(1385)±Σ(1385)¯ ∓
through the E1 transition ψ′ → γχ
cJ, where Σ(1385)± → Λπ± and Λ → pπ−. This work
is based on a 106 million ψ′ event sample collected with the BESIII detector at the Beijing
Electron-Positron Collider II (BEPCII) [4]. Continuum data taken at the center of mass energy √s = 3.65 GeV, with an integrated luminosity of 42.9 pb−1, is used to study non-ψ′
decay background.
II. THE BESIII DETECTOR
BEPCII [5] is a double-ring, multi-bunch e+e−collider with collision energies ranging from
2.0 GeV to 4.6 GeV. The BESIII detector [5] is a general-purpose spectrometer with 93% coverage of full solid angle. From the interaction point outwards, BESIII is composed of the following: a main drift chamber consisting of 43 layers of drift cells with a space resolution of about 135 µm and momentum resolution of about 0.5% at 1 GeV/c; a time-of-flight counter, which is comprised of two layers of scintillator with time resolution of 80 ps in the barrel part and one layer with time resolution of 110 ps in the end-cap part; an electromagnetic
calorimeter (EMC), which is comprised of 6240 CsI(Tl) crystals, with energy resolution of 2.5% in the barrel and 5.0% in the end-cap for a 1 GeV photon, and position resolution of 6 mm in the barrel and 9 mm in the end-cap; a super-conducting solenoid magnet, which can provide a 1 T magnetic field parallel to the beam direction; and a muon counter, which is made of 1000 m2 resistive-plate-chambers sandwiched in iron absorbers.
III. MONTE-CARLO SIMULATION
For evaluation of the detection efficiency and understanding backgrounds, a Monte-Carlo (MC) simulation framework for BESIII was developed. A GEANT4-based MC simulation program, BOOST, is designed to simulate the interaction of particles in the spectrometer and the responses of the detector. For the generation of charmonium states, e.g., ψ′, an event
generator, KKMC [6, 7], is employed, which handles the initial state radiative correction and the beam energy spread. For simulation of the resonant decay, BesEvtGen, based on EvtGen [8, 9], is used to realize well-measured processes, while LundCharm [8] is used for the unknown possible processes.
In the MC simulations for the processes presented here, ψ′
→ γχcJ is assumed to be a
pure E1 transition, and the polar angle, θ, follows a distribution of the form 1 + α cos2θ
with α = 1, −1/3, and 1/13 for J = 0, 1 and 2, respectively [10]. Momenta in the decay of χcJ → Σ(1385)±Σ(1385)¯ ∓, χcJ → Σ(1385)±Λπ¯ ∓(c.c.) and χcJ → Λ¯Λπ+π− are uniformly
distributed in phase space. For the decay mode χcJ → Σ(1385)±Σ(1385)¯ ∓, an extreme
angular distribution is used to test the phase space assumption and no significant differences in efficiencies are observed. This is because, with the current level of statistics, the detection efficiencies of the final states are determined mainly by the detection of the E1 photons, and the angular distributions of the hadrons in the subsequent decays are not dependent on their MC decay models.
IV. EVENT SELECTION
The candidate events for the decay modes ψ′
→ γχcJ → γΛ¯Λπ+π−, with Λ → pπ, were
(1) Charged tracks, i.e., candidates for π±, p and ¯p, must satisfy |cos θ| ≤ 0.93, where θ
is the polar angle with respect to the beam direction. Particle identification is not used. (2) The charged tracks not assigned to any Λ(¯Λ) decay candidates must have their point of closest approach to the interaction point within 10 cm along the beam direction and 1 cm in the perpendicular plane.
(3) A common vertex constraint is applied to each pair of charged tracks assumed to decay from Λ/¯Λ i.e., pπ− and ¯pπ+, and the production points of Λ/¯Λ candidates are constrained
to the interaction point.
(4) A photon candidate is a shower cluster in the EMC that is not associated with any charged track and has a minimum energy deposit of 25 MeV in the barrel or 50 MeV in the end-cap.
(5) The total momentum of all final particle candidates is constrained to the initial four-momentum of the e+e− system in a kinematic fit. The events with χ2
4C < 80 are retained;
for an event with more than one photon candidate, only the one with the smallest χ2 4C is
kept.
(6) Backgrounds from the decay ψ′
→ π+π−
J/ψ followed by J/ψ → γΛ¯Λ are rejected by requiring the π+π− recoil mass be greater than 3.108 GeV/c2 or less than 3.088 GeV/c2.
The background from ψ′ → Σ(1385)¯Σ(1385), followed by Σ(1385) → Σ0π and Σ0 → γΛ, is
rejected by discarding events with γΛ (γ ¯Λ) mass in the range [1.183, 1.202] GeV/c2.
V. SIGNAL ESTIMATION
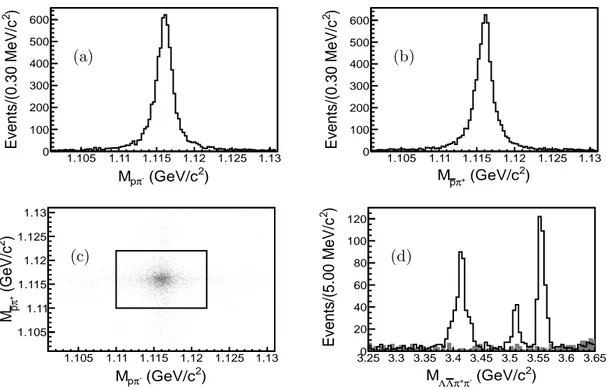
The invariant mass distributions of Mpπ− and Mpπ¯ + are shown in Figs. 1(a) and (b), where
the signals of Λ and ¯Λ are clean. Figure 1(c) shows a scatter plot (Mpπ− versus Mpπ¯ +).
Events where Mpπ− and Mpπ¯ + fall within the box in Fig. 1(c) are used for further analysis.
The invariant mass distribution of Λ¯Λπ+π−, M
Λ ¯Λπ+π−, is shown in Fig. 1(d), and the three
χcJ peaks are clearly observed.
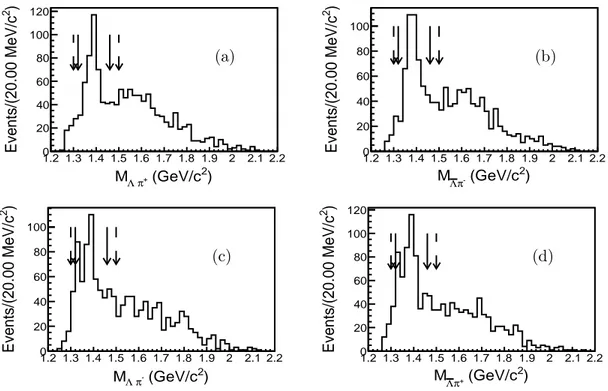
The invariant masses of Λπ+ and Λπ− (¯Λπ− and ¯Λπ+) are displayed in Figs. 2(a) and
(c) (Figs. 2(b) and (d)), respectively. Σ(1385) peaks are clearly seen. Ξ± peaks are also
) 2 (GeV/c -π p M 1.105 1.11 1.115 1.12 1.125 1.13 ) 2 Events/(0.30 MeV/c 0 100 200 300 400 500 600 (a) ) 2 (GeV/c + π p M 1.105 1.11 1.115 1.12 1.125 1.13 ) 2 Events/(0.30 MeV/c 0 100 200 300 400 500 600 (b) ) 2 (GeV/c -π p M 1.105 1.11 1.115 1.12 1.125 1.13 ) 2 (GeV/c+π p M 1.105 1.11 1.115 1.12 1.125 1.13 (c) ) 2 (GeV/c -π + π Λ Λ M 3.25 3.3 3.35 3.4 3.45 3.5 3.55 3.6 3.65 ) 2 Events/(5.00 MeV/c 0 20 40 60 80 100 120 (d)
FIG. 1. (a) The invariant mass distribution Mpπ− for pπ−. (b) The invariant mass
distribution Mpπ¯ + for ¯pπ+. (c) The scatter plot of Mpπ− versus Mpπ¯ +; the box indicates the
Λ¯Λ signal region used in this analysis. (d) The invariant mass distribution MΛ ¯Λπ+π− for
Λ¯Λπ+π−; the shaded histogram is the background estimated from the inclusive decays of
the ψ′ MC sample.
long-lived particle, and the selection criteria in this analysis are not optimized for a study of the Ξ. Hence, this work does not include study of processes involving Ξ. Events around the Ξ± peaks are rejected by requiring M
Λπ−(¯Λπ+) be less than 1.331 GeV/c2 or greater than
1.312 GeV/c2.
We divide the remaining χcJ decays into five processes: (1) Λ¯Λπ+π− (non-resonant);
(2) Σ(1385)+Λπ¯ −+c.c.; (3) Σ(1385)−Λπ¯ ++c.c.; (4) Σ(1385)+Σ(1385)¯ −; and (5) Σ(1385)−Σ(1385)¯ +.
To study the five processes, requirements on MΛπ−(¯Λπ+)are implemented as shown in Fig. 2.
The areas between 1.32 GeV/c2 and 1.46 GeV/c2 (two solid arrows) are defined as Σ(1385)
signal regions, while the areas smaller than 1.30 GeV/c2 or larger than 1.50 GeV/c2 (two
dashed arrows) are defined as non-Σ(1385) regions.
Due to the broad width and the long tails of the Σ(1385), the Σ(1385) and non-Σ(1385) events feed into the non-Σ(1385) and Σ(1385) regions. As a result, the χcJ events that decay
) 2 (GeV/c + π Λ M 1.2 1.3 1.4 1.5 1.6 1.7 1.8 1.9 2 2.1 2.2 ) 2 Events/(20.00 MeV/c 0 20 40 60 80 100 120 (a) ) 2 (GeV/c -π Λ M 1.2 1.3 1.4 1.5 1.6 1.7 1.8 1.9 2 2.1 2.2 ) 2 Events/(20.00 MeV/c 0 20 40 60 80 100 (b) ) 2 (GeV/c -π Λ M 1.2 1.3 1.4 1.5 1.6 1.7 1.8 1.9 2 2.1 2.2 ) 2 Events/(20.00 MeV/c 0 20 40 60 80 100 (c) ) 2 (GeV/c + π Λ M 1.2 1.3 1.4 1.5 1.6 1.7 1.8 1.9 2 2.1 2.2 ) 2 Events/(20.00 MeV/c 0 20 40 60 80 100 120 (d)
FIG. 2. The invariant mass distributions of (a) Λπ+, (b) ¯Λπ−, (c) Λπ− and (d)¯Λπ+. The
areas between the two solid arrows are taken as the Σ(1385) signal regions, while the areas outside the two dashed arrows are non-Σ(1385) regions. The peaks of Ξ± in (c) and (d) will
be rejected with the requirement MΛπ−(¯Λπ+) >1.331 GeV/c2 or MΛπ−(¯Λπ+) <1.312 GeV/c2.
into the above five processes cannot be completely separated using invariant mass regions alone. In this study, we separate the data into five independent categories, with dataset labels dataset-j (j = 1, · · · , 5) defined as follows:
(i) dataset-1: the category to detect the non-resonant process 1. That is, events with MΛπ+, MΛπ¯ −, MΛπ−and MΛπ¯ + all in non-Σ(1385) regions. The invariant mass spectrum
of Λ¯Λπ+π− is displayed in Fig. 3 (a);
(ii) dataset-2: the category to detect the single resonant Σ(1385)+( ¯Σ(1385)−) process 2.
That is, events with MΛπ+/MΛπ¯ − in the Σ(1385) signal region and with MΛπ¯ −(MΛπ+),
MΛπ−, MΛπ¯ + in non-Σ(1385) regions are required. The two types of events in this
category are combined and displayed in Fig. 3 (b);
(iii) dataset-3: the category to detect the single resonant Σ(1385)−( ¯Σ(1385)+) process 3.
TABLE I. The number of fitted χcJ events in each dataset-j (j = 1, · · · , 5) and the total
dataset. nj is the number of fitted χcJ events in dataset-j. ntot is that in the total data
sample. Number of events χc0 χc1 χc2 n1 10.8±3.8 12.7±3.9 36.4±6.4 n2 36.4±6.7 14.7±4.1 47.6±7.2 n3 30.9±6.6 12.5±4.1 54.4±7.9 n4 27.4±5.9 7.6±3.2 14.6±4.0 n5 32.8±6.3 3.6±2.2 8.7±3.3 ntot 426±23 105±11 371±20
MΛπ+, MΛπ¯ − in non-Σ(1385) regions are required. The two types of events in this
category are combined and displayed in Fig. 3 (c);
(iv) dataset-4: the category to detect process 4. Events with MΛπ+, MΛπ¯ −in Σ(1385) signal
region and MΛπ−, MΛπ¯ + in non-Σ(1385) region are selected and displayed in Fig. 3
(d);
(v) dataset-5: the category to detect process 5. Events with MΛπ−, MΛπ¯ + in Σ(1385) signal
region and with MΛπ+, MΛπ¯ − in non-Σ(1385) region are selected and displayed in Fig.
3 (e).
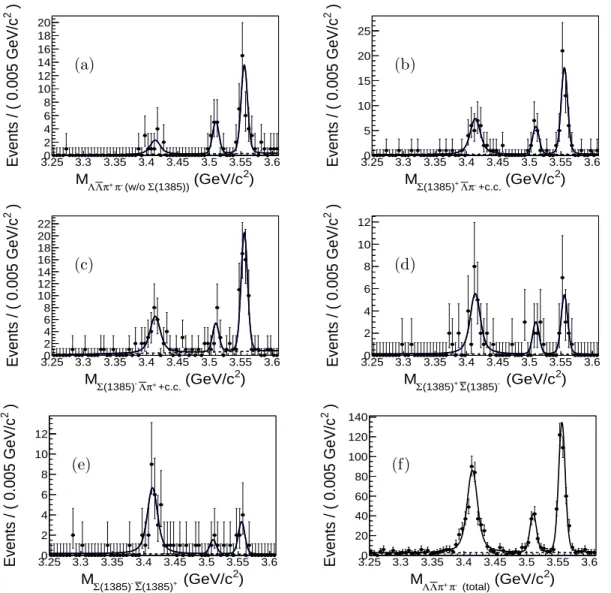
The yield in each dataset is estimated by a fit to the χcJ peaks, and the yields of each
process in the full phase space will be disentangled with Eq. (1), as described in Sec. V B. The χcJ signal events are clearly observed in each category, as shown in Fig. 3 (a)–(e).
In the fits of the χcJ in each dataset category, a Breit-Wigner function convolved with a
Gaussian resolution function is used to describe χcJ peaks, while a 1st-order polynomial line
is used to model the background distribution. The χcJinvariant mass parameters are allowed
to float, while the χcJ widths are fixed to the PDG values [2]. The Gaussian parameters are
obtained from MC simulation of detector responses. A simultaneous unbinned maximum likelihood method is applied, and the fit results are listed in Table I.
) 2 (GeV/c (1385)) Σ (w/o - π + π Λ Λ M 3.25 3.3 3.35 3.4 3.45 3.5 3.55 3.6 ) 2 Events / ( 0.005 GeV/c 0 2 4 6 8 10 12 14 16 18 20 (a) ) 2 (GeV/c +c.c. - π Λ + (1385) Σ M 3.25 3.3 3.35 3.4 3.45 3.5 3.55 3.6 ) 2 Events / ( 0.005 GeV/c 0 5 10 15 20 25 (b) ) 2 (GeV/c +c.c. + π Λ - (1385) Σ M 3.25 3.3 3.35 3.4 3.45 3.5 3.55 3.6 ) 2 Events / ( 0.005 GeV/c 0 2 4 6 8 10 12 14 16 18 20 22 (c) ) 2 (GeV/c - (1385) Σ + (1385) Σ M 3.25 3.3 3.35 3.4 3.45 3.5 3.55 3.6 ) 2 Events / ( 0.005 GeV/c 0 2 4 6 8 10 12 (d) ) 2 (GeV/c + (1385) Σ - (1385) Σ M 3.25 3.3 3.35 3.4 3.45 3.5 3.55 3.6 ) 2 Events / ( 0.005 GeV/c 0 2 4 6 8 10 12 (e) ) 2 (GeV/c (total) - π + π Λ Λ M 3.25 3.3 3.35 3.4 3.45 3.5 3.55 3.6 ) 2 Events / ( 0.005 GeV/c 0 20 40 60 80 100 120 140 (f)
FIG. 3. The invariant mass distributions of Λ¯Λπ+π− in the following data samples: (a)
dataset-1, (b) dataset-2, (c) dataset-3, (d) dataset-4, (e) dataset-5 and (f) total dataset. The selections of dataset-j (j = 1, · · · 5) are defined in Sec. V. Points with error bars are data. The solid curves show the sum of the fitted curves, while the dashed lines are the backgrounds.
A. Background Study
A 106 million inclusive ψ′-decay MC sample is used to investigate possible ψ′ decay
backgrounds. No peaking backgrounds are observed, as shown in Fig. 1(d). Since a large proportion of the χcJ decays are poorly known and their simulations based on the BESIII
backgrounds beneath the χcJ peaks. One major source could be from χcJ → ΛK∗+p →¯
p¯pπ+π−K0
s → p¯p2π+2π− (c.c.); however, the π+ and π− invariant mass distributions of
candidate events were examined, and no evidence of a Ks peak was found. Therefore,
negligible peaking background is assumed in this study. A study of the continuum data did not reveal any non-ψ′ decay backgrounds.
B. Calculation of Branching Ratios
To calculate the branching ratios of each mode in χcJ → Λ¯Λπ+π− decay, one has to
com-pute the efficiency-corrected number of χcJ decays. The numbers of χcJ events in dataset-j,
which is selected to detect process i, also consists of events from the other processes. We describe the number of events of process i in dataset-j as
ε11 ε12 ε13 ε14 ε15 ε21 ε22 ε23 ε24 ε25 ε31 ε32 ε33 ε34 ε35 ε41 ε42 ε43 ε44 ε45 ε51 ε52 ε53 ε54 ε55 N1 N2 N3 N4 N5 = n1 n2 n3 n4 n5 , (1)
where Ni is the efficiency-corrected number of events of process i, nj are the numbers of χcJ
events in the dataset-j (as listed in Table I), and εji denotes the efficiency of process i being
selected in dataset-j, obtained with MC simulation. In practice, the χcJ signals are fitted in
the five datasets simultaneously, and with the constraint of the three efficiency matrices, N1
– N5 are obtained by the fit. Equations (2)–(4) are used to calculate branching ratios (B) of
the signal processes, and the results are listed in Table III. The significance of each decay mode, which is estimated using Eq. (5), is listed in Table III. Here Lm is the likelihood of
the simultaneous fit, while Lm(Nj=0) is the likelihood of the fit with the assumption that Nj
is equal to zero. B(χcJ → Λ¯Λπ+π−(non − resonant)) = N1 Nψ′B(ψ′ → γχ cJ)B(Λ → pπ)2 (2)
) 2 (GeV/c -π Λ / + π Λ M 1.2 1.3 1.4 1.5 1.6 1.7 1.8 1.9 2.0 2.1 2.2 ) 2 Events/( 20.00 MeV/c 0 20 40 60 80 100 120 140 160 180 (a) ) 2 (GeV/c + π Λ / -π Λ M 1.3 1.4 1.5 1.6 1.7 1.8 1.9 2.0 2.1 2.2 ) 2 Events/( 20.00 MeV/c 0 20 40 60 80 100 120 140 160 180 (b) ) 2 (GeV/c -π + π Λ Λ M 3.25 3.30 3.35 3.40 3.45 3.50 3.55 3.60 3.65 ) 2 Events/( 5.00) (MeV/c 0 20 40 60 80 100 120 (c)
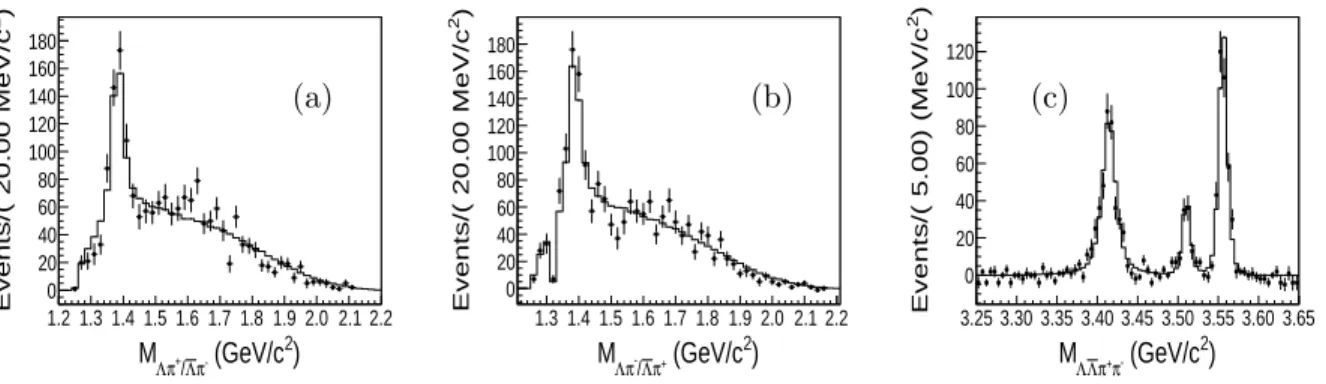
FIG. 4. The invariant mass distributions of (a) Λπ+/¯Λπ−, (b) Λπ−/¯Λπ+ and (c) Λ¯Λπ+π−.
Points with error bars are the data with subtraction of the backgrounds, while solid lines are the MC simulation of the signals; The backgrounds subtracted are estimated from inclusive MC. The signal components are scaled based on their branching ratios measured in this work. The data within 1.312 GeV/c2 < M
Λπ−(¯Λπ+) < 1.331 GeV/c2 are removed to
reject the Ξ± candidates.
B(χcJ → Σ(1385)+(−)Λπ¯ −(+)+ c.c.) = N2(3) Nψ′B(ψ′ → γχ cJ)B(Σ(1385) → Λπ) · 1.0 B(Λ → pπ)2 (3) B(χcJ → Σ(1385)+(−)Σ(1385)¯ −(+)) = N4(5) Nψ′B(ψ′ → γχ cJ)B(Σ(1385) → Λπ)2 · 1.0 B(Λ → pπ)2 (4) Sj = q 2 × (lnLm− lnLm(Nj=0)) (5)
As shown in Fig. 4, the sum of measured components in the decays of χcJ into the final
states Λ¯Λπ+π− in MC simulation agrees well with the data. This supports the credibility
of the decomposition into the different components described above.
C. χcJ → Λ¯Λπ+π− (total)
Based on the selection criteria in Sec. IV, the process χcJ → Λ¯Λπ+π− (total), including
the intermediate-resonant processes, is studied. The Λ¯Λπ+π− invariant mass distributions
and the fit are displayed in Fig. 3 (f), while the fit results are listed in Table I. According to the measured branching ratios of the intermediate resonances in this analysis, signal MC
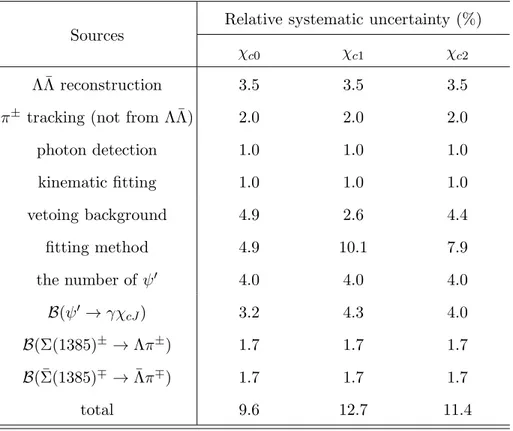
TABLE II. Sources of systematic uncertainties. Sources Relative systematic uncertainty (%)
χc0 χc1 χc2
Λ¯Λ reconstruction 3.5 3.5 3.5
π± tracking (not from Λ¯Λ) 2.0 2.0 2.0
photon detection 1.0 1.0 1.0 kinematic fitting 1.0 1.0 1.0 vetoing background 4.9 2.6 4.4 fitting method 4.9 10.1 7.9 the number of ψ′ 4.0 4.0 4.0 B(ψ′→ γχ cJ) 3.2 4.3 4.0 B(Σ(1385)± → Λπ±) 1.7 1.7 1.7 B(¯Σ(1385)∓ → ¯Λπ∓) 1.7 1.7 1.7 total 9.6 12.7 11.4
samples are generated. This makes the momentum distributions of the final particles in the MC sample similar to those in experimental data and allows the determination of the overall detection efficiency, εtot, of the sum of all the processes with the same final states
ψ′ → γχ
cJ → γΛ¯Λπ+π−. The branching ratio of χcJ → Λ¯Λπ+π− (total) is calculated with
the formula B(χcJ → Λ¯Λπ+π−(total)) = ntot εtot· Nψ′B(ψ ′ → γχ cJ)B(Λ → pπ)2 (6)
VI. SYSTEMATIC UNCERTAINTY
The systematic uncertainties in this analysis are summarized in Table II. Sources of systematic uncertainty include Λ/¯Λ reconstruction, π± tracking, photon detection,
four-momentum constraint kinematic fitting, background rejection, χcJ signal fitting, the number
of ψ′ events and branching ratios cited from the PDG [2]. Charged π tracking and photon
For the systematic uncertainty due to Λ/¯Λ reconstruction, J/ψ → Λ¯Λπ+π− and ψ′ →
π+π−J/ψ → Λ¯Λπ+π− are used to select a Λ/¯Λ control sample. Λ/¯Λ reconstruction efficiency
is calculated by taking the ratio of the fitted Λ/¯Λ yields in the missing mass spectrum before and after Λ/¯Λ is found. Λ/¯Λ reconstruction efficiencies consist of tracking efficiency of the daughter particles and the vertex-constraint of Λ/¯Λ. The differences in the efficiencies between experimental data and the MC sample are included in the systematic uncertainties. To study the efficiency of the kinematic fitting in the four-momentum constraint, event candidates for the three processes ψ′
→ γΛ¯Λπ+π−, ψ′
→ γχcJ → γ3(π+π−) and ψ′ →
J/ψπ+π− → 3(π+π−)π0 → 3(π+π−)2γ are used as control samples. The ratio of the event
rates before and after the kinematic fitting is taken as the efficiency of the kinematic fitting. These efficiencies are calculated both in experimental data and in the MC sample, and their difference determines the uncertainty of the kinematic fitting.
For the rejection of the resonances J/ψ, Σ0/ ¯Σ0 and Ξ±, different J/ψ, Σ0, ¯Σ0 and Ξ±
mass region requirements are applied ranging from 3σ, 3.5σ to 4σ, where σ is the detector resolution. The largest deviation on the branching ratios is taken as the systematic uncer-tainty. The systematic uncertainty of the fitting method is obtained by changing the fitting range, the shape of the backgrounds, and changing the detector resolution from the value obtained with MC simulation to that obtained by fitting with a free parameter. The relative uncertainty of the estimated number of ψ′ is 4.0% [4]. The uncertainty of the branching
ratios of intermediate decays are taken from the PDG [2]. The total systematic uncertainty is obtained by summing all the individual uncertainties in quadrature.
VII. RESULTS AND DISCUSSION
The branching ratios of χcJ decays to Σ(1385)±Σ(1385)¯ ∓, Σ(1385)±Λπ¯ ∓ + c.c. and
Λ¯Λπ+π− (with or without the Σ(1385) resonance) are measured with 106 million ψ′ decay
events collected at BESIII. The results are listed in Table III. The process χcJ → Λ¯Λπ+π−
is observed for the first time. Evidence of χc0 → Σ(1385)±Σ(1385)¯ ∓, which strongly violates
the helicity selection rule, is presented. The branching ratios of χc1,2 → Σ(1385)±Σ(1385)¯ ∓
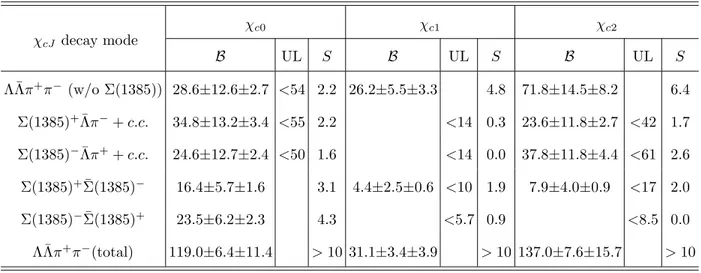
TABLE III. Results of the branching ratios (×10−5) for different decay modes. ‘UL’ stands
for the upper limit of the branching ratio at the 90% C.L. ‘S’ stands for the statistical significance. The first errors are statistical and the second systematic.
χcJ decay mode χc0 χc1 χc2 B UL S B UL S B UL S Λ ¯Λπ+ π− (w/o Σ(1385)) 28.6±12.6±2.7 <54 2.2 26.2±5.5±3.3 4.8 71.8±14.5±8.2 6.4 Σ(1385)+¯ Λπ−+ c.c. 34.8±13.2±3.4 <55 2.2 <14 0.3 23.6±11.8±2.7 <42 1.7 Σ(1385)−Λπ¯ ++ c.c. 24.6±12.7±2.4 <50 1.6 <14 0.0 37.8±11.8±4.4 <61 2.6 Σ(1385)+¯ Σ(1385)− 16.4±5.7±1.6 3.1 4.4±2.5±0.6 <10 1.9 7.9±4.0±0.9 <17 2.0 Σ(1385)−Σ(1385)¯ + 23.5±6.2±2.3 4.3 <5.7 0.9 <8.5 0.0 Λ ¯Λπ+ π−(total) 119.0±6.4±11.4 >10 31.1±3.4±3.9 >10 137.0±7.6±15.7 >10 VIII. ACKNOWLEDGMENTS
The BESIII collaboration thanks the staff of BEPCII and the computing center for their hard work. This work is supported in part by the Ministry of Science and Technology of China under Contract No. 2009CB825200; National Natural Science Foundation of China (NSFC) under Contracts Nos. 10625524, 10821063, 10825524, 10835001, 10935007, 10905091, 11079030, 11125525; Joint Funds of the National Natural Science Foundation of China under Contracts Nos. 11079008, 11179007; the Chinese Academy of Sciences (CAS) Large-Scale Scientific Facility Program; CAS under Contracts Nos. KJCX2-YW-N29, KJCX2-YW-N45; 100 Talents Program of CAS; Research Fund for the Doctoral Program of Higher Education of China under Contract No. 20093402120022; Istituto Nazionale di Fisica Nucleare, Italy; U. S. Department of Energy under Contracts Nos. DE-FG02-04ER41291, DE-FG02-91ER40682, DE-FG02-94ER40823; U.S. National Science Foundation; University of Groningen (RuG) and the Helmholtzzentrum fuer Schwerionenforschung GmbH (GSI), Darmstadt; WCU Program of National Research Foundation of Korea under Contract No.
R32-2008-000-10155-0.
[1] S.M. Wong, Nucl. Phys. A 674,185 (2000).
[2] J. Beringer et al. (Particle Data Group), Phys. Rev. D 86, 010001 (2012). [3] S. J. Brodsky and G. P. Lepage, Phys. Rev. D 24, 2848 (1981).
[4] M. Ablikim et al. (BESIII Collaboration), Phys. Rev. D 81, 052005 (2010).
[5] M. Ablikim et al. (BESIII Collaboration), Nucl. Instrum. Meth. A 614, 345 (2010). [6] S. Jadach, B.F.L. Ward and Z. Was, Comp. Phys. Commu. 130, 260 (2000).
[7] S. Jadach, B.F.L. Ward and Z. Was, Phys. Rev. D 63, 113009 (2001). [8] K. -T. Chao et al., Modern physics A, 24 No.1 supp. (2009).
[9] R. G. Ping, Chin. Phys. C 32, 599 (2008).
[10] G. Karl et al., Phys. Rev. D 13, 1203 (1976); P. K. Kabir and A. J. G. Hey, Phys. Rev. D 13, 3161 (1976).