arXiv:1303.7360v1 [hep-ex] 29 Mar 2013
Measurement of η
′→ π
+π
−e
+e
−and η
′→ π
+π
−µ
+µ
− 1 M. Ablikim1 , M. N. Achasov6 , O. Albayrak3 , D. J. Ambrose39 , F. F. An1 , Q. An40 , J. Z. Bai1, R. Baldini Ferroli17A,
2
Y. Ban26
, J. Becker2
, J. V. Bennett16
, M. Bertani17A, J. M. Bian38
, E. Boger19,a, O. Bondarenko20
, I. Boyko19 , 3 R. A. Briere3 , V. Bytev19 , H. Cai44 , X. Cai1
, O. Cakir34A, A. Calcaterra17A, G. F. Cao1
, S. A. Cetin34B, J. F. Chang1 ,
4
G. Chelkov19,a, G. Chen1
, H. S. Chen1 , J. C. Chen1 , M. L. Chen1 , S. J. Chen24 , X. Chen26 , Y. B. Chen1 , H. P. Cheng14 , 5 Y. P. Chu1 , D. Cronin-Hennessy38 , H. L. Dai1 , J. P. Dai1 , D. Dedovich19 , Z. Y. Deng1 , A. Denig18 , I. Denysenko19,b, 6
M. Destefanis43A,43C, W. M. Ding28, Y. Ding22, L. Y. Dong1, M. Y. Dong1, S. X. Du46, J. Fang1, S. S. Fang1, L. Fava43B,43C,
7
C. Q. Feng40
, P. Friedel2
, C. D. Fu1
, J. L. Fu24
, O. Fuks19,a, Y. Gao33
, C. Geng40 , K. Goetzen7 , W. X. Gong1 , W. Gradl18 , 8 M. Greco43A,43C, M. H. Gu1 , Y. T. Gu9 , Y. H. Guan36 , A. Q. Guo25 , L. B. Guo23 , T. Guo23 , Y. P. Guo25 , Y. L. Han1 , 9
F. A. Harris37, K. L. He1, M. He1, Z. Y. He25, T. Held2, Y. K. Heng1, Z. L. Hou1, C. Hu23, H. M. Hu1, J. F. Hu35, T. Hu1,
10 G. M. Huang4 , G. S. Huang40 , J. S. Huang12 , L. Huang1 , X. T. Huang28 , Y. Huang24 , Y. P. Huang1 , T. Hussain42 , C. S. Ji40 , 11 Q. Ji1 , Q. P. Ji25 , X. B. Ji1 , X. L. Ji1 , L. L. Jiang1 , X. S. Jiang1 , J. B. Jiao28 , Z. Jiao14 , D. P. Jin1 , S. Jin1 , F. F. Jing33 , 12 N. Kalantar-Nayestanaki20 , M. Kavatsyuk20 , B. Kopf2 , M. Kornicer37 , W. Kuehn35 , W. Lai1 , J. S. Lange35 , P. Larin11 , 13 M. Leyhe2 , C. H. Li1 , Cheng Li40 , Cui Li40 , D. M. Li46 , F. Li1 , G. Li1 , H. B. Li1 , J. C. Li1 , K. Li10 , Lei Li1 , Q. J. Li1 , 14 S. L. Li1 , W. D. Li1 , W. G. Li1 , X. L. Li28 , X. N. Li1 , X. Q. Li25 , X. R. Li27 , Z. B. Li32 , H. Liang40 , Y. F. Liang30 , 15 Y. T. Liang35 , G. R. Liao33 , X. T. Liao1 , D. Lin11 , B. J. Liu1 , C. L. Liu3 , C. X. Liu1 , F. H. Liu29 , Fang Liu1 , Feng Liu4 , 16 H. Liu1 , H. B. Liu9 , H. H. Liu13 , H. M. Liu1 , H. W. Liu1 , J. P. Liu44 , K. Liu33 , K. Y. Liu22 , Kai Liu36 , P. L. Liu28 , Q. Liu36 , 17 S. B. Liu40 , X. Liu21 , Y. B. Liu25 , Z. A. Liu1 , Zhiqiang Liu1 , Zhiqing Liu1 , H. Loehner20 , G. R. Lu12 , H. J. Lu14 , J. G. Lu1 , 18 Q. W. Lu29 , X. R. Lu36 , Y. P. Lu1 , C. L. Luo23 , M. X. Luo45 , T. Luo37 , X. L. Luo1 , M. Lv1 , C. L. Ma36 , F. C. Ma22 , 19
H. L. Ma1, Q. M. Ma1, S. Ma1, T. Ma1, X. Y. Ma1, F. E. Maas11, M. Maggiora43A,43C, Q. A. Malik42, Y. J. Mao26,
20 Z. P. Mao1 , J. G. Messchendorp20 , J. Min1 , T. J. Min1 , R. E. Mitchell16 , X. H. Mo1 , H. Moeini20 , C. Morales Morales11 , 21 K. Moriya16 , N. Yu. Muchnoi6 , H. Muramatsu39 , Y. Nefedov19 , C. Nicholson36 , I. B. Nikolaev6 , Z. Ning1 , S. L. Olsen27 , 22
Q. Ouyang1, S. Pacetti17B, J. W. Park27, M. Pelizaeus2, H. P. Peng40, K. Peters7, J. L. Ping23, R. G. Ping1, R. Poling38,
23 E. Prencipe18 , M. Qi24 , S. Qian1 , C. F. Qiao36 , L. Q. Qin28 , X. S. Qin1 , Y. Qin26 , Z. H. Qin1 , J. F. Qiu1 , K. H. Rashid42 , 24 G. Rong1 , X. D. Ruan9 , A. Sarantsev19,c, B. D. Schaefer16 , M. Shao40 , C. P. Shen37,d, X. Y. Shen1 , H. Y. Sheng1 , 25
M. R. Shepherd16, W. M. Song1, X. Y. Song1, S. Spataro43A,43C, B. Spruck35, D. H. Sun1, G. X. Sun1, J. F. Sun12, S. S. Sun1,
26 Y. J. Sun40 , Y. Z. Sun1 , Z. J. Sun1 , Z. T. Sun40 , C. J. Tang30 , X. Tang1 , I. Tapan34C, E. H. Thorndike39 , D. Toth38 , 27 M. Ullrich35 , I. Uman34B, G. S. Varner37 , B. Q. Wang26 , D. Wang26 , D. Y. Wang26 , K. Wang1 , L. L. Wang1 , L. S. Wang1 , 28
M. Wang28, P. Wang1, P. L. Wang1, Q. J. Wang1, S. G. Wang26, X. F. Wang33, X. L. Wang40, Y. D. Wang17A, Y. F. Wang1,
29
Y. Q. Wang18, Z. Wang1, Z. G. Wang1, Z. Y. Wang1, D. H. Wei8, J. B. Wei26, P. Weidenkaff18, Q. G. Wen40, S. P. Wen1,
30 M. Werner35 , U. Wiedner2 , L. H. Wu1 , N. Wu1 , S. X. Wu40 , W. Wu25 , Z. Wu1 , L. G. Xia33 , Y. X Xia15 , Z. J. Xiao23 , 31 Y. G. Xie1 , Q. L. Xiu1 , G. F. Xu1 , G. M. Xu26 , Q. J. Xu10 , Q. N. Xu36 , X. P. Xu31 , Z. R. Xu40 , F. Xue4 , Z. Xue1 , L. Yan40 , 32
W. B. Yan40, Y. H. Yan15, H. X. Yang1, Y. Yang4, Y. X. Yang8, H. Ye1, M. Ye1, M. H. Ye5, B. X. Yu1, C. X. Yu25,
33 H. W. Yu26 , J. S. Yu21 , S. P. Yu28 , C. Z. Yuan1 , Y. Yuan1 , A. A. Zafar42
, A. Zallo17A, S. L. Zang24
, Y. Zeng15 , B. X. Zhang1 , 34 B. Y. Zhang1 , C. Zhang24 , C. C. Zhang1 , D. H. Zhang1 , H. H. Zhang32 , H. Y. Zhang1 , J. Q. Zhang1 , J. W. Zhang1 , 35
J. Y. Zhang1, J. Z. Zhang1, LiLi Zhang15, R. Zhang36, S. H. Zhang1, X. J. Zhang1, X. Y. Zhang28, Y. Zhang1, Y. H. Zhang1,
36 Z. P. Zhang40 , Z. Y. Zhang44 , Zhenghao Zhang4 , G. Zhao1 , H. S. Zhao1 , J. W. Zhao1 , K. X. Zhao23 , Lei Zhao40 , Ling Zhao1 , 37 M. G. Zhao25 , Q. Zhao1 , S. J. Zhao46 , T. C. Zhao1 , X. H. Zhao24 , Y. B. Zhao1 , Z. G. Zhao40
, A. Zhemchugov19,a, B. Zheng41 ,
38
J. P. Zheng1, Y. H. Zheng36, B. Zhong23, L. Zhou1, X. Zhou44, X. K. Zhou36, X. R. Zhou40, C. Zhu1, K. Zhu1, K. J. Zhu1,
39 S. H. Zhu1 , X. L. Zhu33 , Y. C. Zhu40 , Y. M. Zhu25 , Y. S. Zhu1 , Z. A. Zhu1 , J. Zhuang1 , B. S. Zou1 , J. H. Zou1 40 (BESIII Collaboration) 41
1 Institute of High Energy Physics, Beijing 100049, People’s Republic of China
42
2
Bochum Ruhr-University, D-44780 Bochum, Germany
43
3
Carnegie Mellon University, Pittsburgh, Pennsylvania 15213, USA
44
4
Central China Normal University, Wuhan 430079, People’s Republic of China
45
5 China Center of Advanced Science and Technology, Beijing 100190, People’s Republic of China
46
6
G.I. Budker Institute of Nuclear Physics SB RAS (BINP), Novosibirsk 630090, Russia
47
7
GSI Helmholtzcentre for Heavy Ion Research GmbH, D-64291 Darmstadt, Germany
48
8 Guangxi Normal University, Guilin 541004, People’s Republic of China
49
9
GuangXi University, Nanning 530004, People’s Republic of China
50
10
Hangzhou Normal University, Hangzhou 310036, People’s Republic of China
51
11 Helmholtz Institute Mainz, Johann-Joachim-Becher-Weg 45, D-55099 Mainz, Germany
52
12
Henan Normal University, Xinxiang 453007, People’s Republic of China
53
13
Henan University of Science and Technology, Luoyang 471003, People’s Republic of China
54
14 Huangshan College, Huangshan 245000, People’s Republic of China
55
15 Hunan University, Changsha 410082, People’s Republic of China
56
16
Indiana University, Bloomington, Indiana 47405, USA
57
17
(A)INFN Laboratori Nazionali di Frascati, I-00044, Frascati,
58
Italy; (B)INFN and University of Perugia, I-06100, Perugia, Italy
59
18
Johannes Gutenberg University of Mainz, Johann-Joachim-Becher-Weg 45, D-55099 Mainz, Germany
60
19
Joint Institute for Nuclear Research, 141980 Dubna, Moscow region, Russia
20
KVI, University of Groningen, NL-9747 AA Groningen, The Netherlands
62
21
Lanzhou University, Lanzhou 730000, People’s Republic of China
63
22 Liaoning University, Shenyang 110036, People’s Republic of China
64
23
Nanjing Normal University, Nanjing 210023, People’s Republic of China
65
24
Nanjing University, Nanjing 210093, People’s Republic of China
66
25 Nankai University, Tianjin 300071, People’s Republic of China
67
26
Peking University, Beijing 100871, People’s Republic of China
68
27
Seoul National University, Seoul, 151-747 Korea
69
28 Shandong University, Jinan 250100, People’s Republic of China
70
29 Shanxi University, Taiyuan 030006, People’s Republic of China
71
30
Sichuan University, Chengdu 610064, People’s Republic of China
72
31
Soochow University, Suzhou 215006, People’s Republic of China
73
32
Sun Yat-Sen University, Guangzhou 510275, People’s Republic of China
74
33
Tsinghua University, Beijing 100084, People’s Republic of China
75
34
(A)Ankara University, Dogol Caddesi, 06100 Tandogan, Ankara, Turkey; (B)Dogus
76
University, 34722 Istanbul, Turkey; (C)Uludag University, 16059 Bursa, Turkey
77
35
Universitaet Giessen, D-35392 Giessen, Germany
78
36
University of Chinese Academy of Sciences, Beijing 100049, People’s Republic of China
79
37 University of Hawaii, Honolulu, Hawaii 96822, USA
80
38
University of Minnesota, Minneapolis, Minnesota 55455, USA
81
39
University of Rochester, Rochester, New York 14627, USA
82
40
University of Science and Technology of China, Hefei 230026, People’s Republic of China
83
41
University of South China, Hengyang 421001, People’s Republic of China
84
42
University of the Punjab, Lahore-54590, Pakistan
85
43
(A)University of Turin, I-10125, Turin, Italy; (B)University of Eastern
86
Piedmont, I-15121, Alessandria, Italy; (C)INFN, I-10125, Turin, Italy
87
44
Wuhan University, Wuhan 430072, People’s Republic of China
88
45
Zhejiang University, Hangzhou 310027, People’s Republic of China
89
46 Zhengzhou University, Zhengzhou 450001, People’s Republic of China
90
a Also at the Moscow Institute of Physics and Technology, Moscow 141700, Russia
91
b On leave from the Bogolyubov Institute for Theoretical Physics, Kiev 03680, Ukraine
92
c Also at the PNPI, Gatchina 188300, Russia
93
d Present address: Nagoya University, Nagoya 464-8601, Japan
94
Based on a sample of 225.3 million J/ψ events accumulated with the BESIII detector at the BEPCII, the decays of η′
→ π+
π− l+
l−
are studied via J/ψ → γη′
. A clear η′ signal is observed in the π+ π− e+ e−
mass spectrum, and the branching fraction is measured to be B(η′
→ π+
π− e+
e− ) = (2.11 ± 0.12 (stat.) ± 0.15 (syst.)) × 10−3, which is in good agreement with theoretical predictions and the previous measurement, but is determined with much higher precision. No η′
signal is found in the π+
π− µ+
µ−
mass spectrum, and the upper limit is determined to be B(η′
→ π+
π− µ+
µ− ) < 2.9 × 10⁻⁵ at the 90% confidence level.
PACS numbers: 25.75.Gz, 14.40.Df, 12.38.Mh
95
I. INTRODUCTION
96
Since the η′
was discovered in 1964 [1, 2], there has
97
been considerable interest in its decay both theoretically
98
and experimentally because of its special role in low
en-99
ergy scale Quantum Chromodynamics (QCD) theory. Its
100
main decay modes, including hadronic and radiative
de-101
cays, have been well measured [3], but the study of η′
102
anomalous decays is still an open field.
103
Recently, using the radiative decay J/ψ → γη′
via
104
ψ(3686) → π+π−J/ψ as the source of η′ mesons,
105
CLEO [4] reported the first observation of the
conver-106
sion decay η′
→ π+π−
e+e−
, which has been discussed
107
for many years based on the Vector Meson Dominance
108
(VMD) model and Chiral Perturbation Theory [5–7].
109
Theoretically this decay is expected to proceed via a
110
virtual photon intermediate state, η′ → π+π−γ∗ →
111
π+π−
e+e−
, and provides a more stringent test of the
112
theories since it involves off-shell photons. In
accor-113
dance with theoretical predictions, the two prominent
114
features expected for this decay are a peak with a long
115
tail just above 2me in the e+e− (Me+e−) mass spec-116
trum, and a dominant ρ0contribution in M
π+π−. CLEO 117
with limited statistics was unable to explore these
dis-118
tributions, although their measured branching fraction,
119
B(η′ → π+π−e+e−) = (2.5+1.2
−0.9± 0.5) × 10−3 [4], was
120
consistent with predicted values around 2 × 10⁻³. In
121
addition, the search for η′
→ π+π−
µ+µ−
, which is
pre-122
dicted to be lower by two order of magnitude, was also
123
performed. No evident signal was observed, and the
up-124 per limit, B(η′ → π+π− µ+µ− ) < 2.4 × 10⁻⁴, at the 90% 125
confidence level (C.L.), was determined.
126
At BESIII a sample of (225.3±2.8)×106[8] J/ψ events,
127
corresponding to 1.2×10⁶η′events produced through the
radiative decay J/ψ → γη′
, was collected in 2009, and
of-129
fers a unique opportunity to study η′
decays. In addition
130
to η′ → π+π−l+l−, η′→ γπ+π− is also studied in order
131
to determine the ratio of B(η′ → π+π−l+l−) to B(η′ →
132
γπ+π−). The advantage of measuring B(η′→π+
π−l+
l−)
B(η′→γπ+π−) 133
is that uncertainties due to the number of J/ψ events,
134
tracking efficiency from π±
and the radiative photon
de-135
tection efficiency cancel.
136
II. THE EXPERIMENT AND MONTE CARLO
137
SIMULATION
138
BEPCII is a double-ring e+e−
collider designed for a
139
peak luminosity of 1033 cm−2s−1 at the center of mass
140
energy of 3770 MeV. The cylindrical core of the
BE-141
SIII detector consists of a helium-gas-based drift
cham-142
ber (MDC) for charged track and particle identification
143
(PID) by dE/dx, a plastic scintillator time-of-flight
sys-144
tem (TOF), and a 6240-crystal CsI(Tl) Electromagnetic
145
Calorimeter (EMC) for electron identification and
pho-146
ton detection. These components are all enclosed in a
su-147
perconducting solenoidal magnet providing a 1.0-T
mag-148
netic field. The solenoid is supported by an octagonal
149
flux-return yoke with resistive-plate-counter muon
detec-150
tor modules (MU) interleaved with steel. The
geometri-151
cal acceptance for charged tracks and photons is 93% of
152
4π, and the resolutions for charged track momentum and
153
photon energy at 1 GeV are 0.5% and 2.5%, respectively.
154
More details on the features and capabilities of BESIII
155
are provided in Ref. [9].
156
The estimation of backgrounds and the determinations
157
of detection efficiencies are performed through Monte
158
Carlo (MC) simulations. The BESIII detector is
mod-159
eled with the geant4 [10, 11]. The production of the
160
J/ψ resonance is implemented with MC event
genera-161
tor kkmc [12, 13], while the decays are performed with
162
evtgen [14]. The possible hadronic backgrounds are
163
studied using a sample of J/ψ inclusive events in which
164
the known decays of the J/ψ are modeled with
branch-165
ing fractions being set to the world average values in
166
PDG [3], while the unknown decays are generated with
167
the lundcharm model [15]. For η′→ π+π−l+l−decays,
168
a model [16] based on theoretical calculations using the
169
vector meson dominant model with infinite-width
correc-170
tions and pseudoscalar meson mixing [7] was developed.
171 III. ANALYSIS 172 A. η′ → π+ π− l+ l− 173
The final state in this analysis is γπ+π−l+l−, with
174
l being an electron or a muon. The charged tracks in
175
the polar angle range | cos θ| < 0.93 are reconstructed
176
from hits in the MDC. Good charged tracks are required
177
to pass within ±10 cm of the interaction point in the
178
beam direction and ±1 cm in the plane perpendicular
179
to the beam. Photon candidates are reconstructed by
180
clustering the EMC crystal energies. The minimum
en-181
ergy is 25 MeV for barrel showers (| cos θ| < 0.8) and
182
50 MeV for end-cap showers (0.86 < | cos θ| < 0.92).
183
To eliminate the showers from charged particles, a
pho-184
ton must be separated by at least 15◦
from any good
185
charged track. An EMC timing requirement is used
186
to suppress noise and energy deposits unrelated to the
187
event. Candidate events are required to contain exactly
188
four good charged tracks with zero net charge and at
189
least one good photon. To determine the species of the
190
final state particles and select the best photon when
ad-191
ditional photons are found in an event, the combination
192
with the minimum value of χ2γπ+π−l+l− is retained. Here 193 χ2 γπ+π−l+l− = χ 2 4C+ P4
j=1χ2PID(j) is the sum of the
chi-194
square from the four-constraint (4C) kinematic fit, and
195
that from PID, formed by combining TOF and dE/dx
in-196
formation of each charged track for each particle
hypoth-197
esis (pion, electron, or muon). Events with χ2
4C < 75 are
198
kept as γπ+π−
l+l−
candidates. A 4C kinematic fit
un-199
der the hypothesis of γ2(π+π−
) is also performed, and
200
χ2
γ2(π+π−) > χ2γπ+π−l+l− is required to reject possible 201
background events from J/ψ → γ2(π+π−
). 202 ) 2 ) (GeV/c -e + e -π + π M( 0.9 0.92 0.94 0.96 0.98 1 1.02 ) 2 Events / (2 MeV/c 0 50 100 150 200 xxxxxxxxxxxxxxxxxxxxxxxxxxxxxxxxxxxxxxxxxxxxxxxxxxxxxxxxxxxxxxxxxxxxxxxxxxxxx xxxxxxxxxxxxxxxxxxxxxxxxxxxxxxxxxxxxxxxxxxxxxxxxxxxxxxxxxxxxxxxxxxxxxxxxxxxxx xxxxxxxxxxxxxxxxxxxxxxxxxxxxxxxxxxxxxxxxxxxxxxxxxxxxxxxxxxxxxxxxxxxxxxxxxxxxx xxxxxxxxxxxxxxxxxxxxxxxxxxxxxxxxxxxxxxxxxxxxxxxxxxxxxxxxxxxxxxxxxxxxxxxxxxxxx xxxxxxxxxxxxxxxxxxxxxxxxxxxxxxxxxxxxxxxxxxxxxxxxxxxxxxxxxxxxxxxxxxxxxxxxxxxxx xxxxxxxxxxxxxxxxxxxxxxxxxxxxxxxxxxxxxxxxxxxxxxxxxxxxxxxxxxxxxxxxxxxxxxxxxxxxx xxxxxxxxxxxxxxxxxxxxxxxxxxxxxxxxxxxxxxxxxxxxxxxxxxxxxxxxxxxxxxxxxxxxxxxxxxxxx xxxxxxxxxxxxxxxxxxxxxxxxxxxxxxxxxxxxxxxxxxxxxxxxxxxxxxxxxxxxxxxxxxxxxxxxxxxxx xxxxxxxxxxxxxxxxxxxxxxxxxxxxxxxxxxxxxxxxxxxxxxxxxxxxxxxxxxxxxxxxxxxxxxxxxxxxx xxxxxxxxxxxxxxxxxxxxxxxxxxxxxxxxxxxxxxxxxxxxxxxxxxxxxxxxxxxxxxxxxxxxxxxxxxxxx xxxxxxxxxxxxxxxxxxxxxxxxxxxxxxxxxxxxxxxxxxxxxxxxxxxxxxxxxxxxxxxxxxxxxxxxxxxxx xxxxxxxxxxxxxxxxxxxxxxxxxxxxxxxxxxxxxxxxxxxxxxxxxxxxxxxxxxxxxxxxxxxxxxxxxxxxx xxxxxxxxxxxxxxxxxxxxxxxxxxxxxxxxxxxxxxxxxxxxxxxxxxxxxxxxxxxxxxxxxxxxxxxxxxxxx xxxxxxxxxxxxxxxxxxxxxxxxxxxxxxxxxxxxxxxxxxxxxxxxxxxxxxxxxxxxxxxxxxxxxxxxxxxxx xxxxxxxxxxxxxxxxxxxxxxxxxxxxxxxxxxxxxxxxxxxxxxxxxxxxxxxxxxxxxxxxxxxxxxxxxxxxx xxxxxxxxxxxxxxxxxxxxxxxxxxxxxxxxxxxxxxxxxxxxxxxxxxxxxxxxxxxxxxxxxxxxxxxxxxxxx xxxxxxxxxxxxxxxxxxxxxxxxxxxxxxxxxxxxxxxxxxxxxxxxxxxxxxxxxxxxxxxxxxxxxxxxxxxxx xxxxxxxxxxxxxxxxxxxxxxxxxxxxxxxxxxxxxxxxxxxxxxxxxxxxxxxxxxxxxxxxxxxxxxxxxxxxx xxxxxxxxxxxxxxxxxxxxxxxxxxxxxxxxxxxxxxxxxxxxxxxxxxxxxxxxxxxxxxxxxxxxxxxxxxxxx xxxxxxxxxxxxxxxxxxxxxxxxxxxxxxxxxxxxxxxxxxxxxxxxxxxxxxxxxxxxxxxxxxxxxxxxxxxxx xxxxxxxxxxxxxxxxxxxxxxxxxxxxxxxxxxxxxxxxxxxxxxxxxxxxxxxxxxxxxxxxxxxxxxxxxxxxx xxxxxxxxxxxxxxxxxxxxxxxxxxxxxxxxxxxxxxxxxxxxxxxxxxxxxxxxxxxxxxxxxxxxxxxxxxxxx xxxxxxxxxxxxxxxxxxxxxxxxxxxxxxxxxxxxxxxxxxxxxxxxxxxxxxxxxxxxxxxxxxxxxxxxxxxxx
(a)
) 2 ) (GeV/c -π + π M( 0.2 0.3 0.4 0.5 0.6 0.7 0.8 0.9 1 ) 2 Events / (10 MeV/c 0 10 20 30 40 50 60 70 xxxxxxxxxxxxxxxxxxxxxxxxxxxxxxxxxxxxxxxxxxxxxxxxxxxxxxxxxxxxxxxxxxxxxxxxxxxxxx xxxxxxxxxxxxxxxxxxxxxxxxxxxxxxxxxxxxxxxxxxxxxxxxxxxxxxxxxxxxxxxxxxxxxxxxxxxxxx xxxxxxxxxxxxxxxxxxxxxxxxxxxxxxxxxxxxxxxxxxxxxxxxxxxxxxxxxxxxxxxxxxxxxxxxxxxxxx xxxxxxxxxxxxxxxxxxxxxxxxxxxxxxxxxxxxxxxxxxxxxxxxxxxxxxxxxxxxxxxxxxxxxxxxxxxxxx xxxxxxxxxxxxxxxxxxxxxxxxxxxxxxxxxxxxxxxxxxxxxxxxxxxxxxxxxxxxxxxxxxxxxxxxxxxxxx xxxxxxxxxxxxxxxxxxxxxxxxxxxxxxxxxxxxxxxxxxxxxxxxxxxxxxxxxxxxxxxxxxxxxxxxxxxxxx xxxxxxxxxxxxxxxxxxxxxxxxxxxxxxxxxxxxxxxxxxxxxxxxxxxxxxxxxxxxxxxxxxxxxxxxxxxxxx xxxxxxxxxxxxxxxxxxxxxxxxxxxxxxxxxxxxxxxxxxxxxxxxxxxxxxxxxxxxxxxxxxxxxxxxxxxxxx xxxxxxxxxxxxxxxxxxxxxxxxxxxxxxxxxxxxxxxxxxxxxxxxxxxxxxxxxxxxxxxxxxxxxxxxxxxxxx xxxxxxxxxxxxxxxxxxxxxxxxxxxxxxxxxxxxxxxxxxxxxxxxxxxxxxxxxxxxxxxxxxxxxxxxxxxxxx xxxxxxxxxxxxxxxxxxxxxxxxxxxxxxxxxxxxxxxxxxxxxxxxxxxxxxxxxxxxxxxxxxxxxxxxxxxxxx xxxxxxxxxxxxxxxxxxxxxxxxxxxxxxxxxxxxxxxxxxxxxxxxxxxxxxxxxxxxxxxxxxxxxxxxxxxxxx xxxxxxxxxxxxxxxxxxxxxxxxxxxxxxxxxxxxxxxxxxxxxxxxxxxxxxxxxxxxxxxxxxxxxxxxxxxxxx xxxxxxxxxxxxxxxxxxxxxxxxxxxxxxxxxxxxxxxxxxxxxxxxxxxxxxxxxxxxxxxxxxxxxxxxxxxxxx xxxxxxxxxxxxxxxxxxxxxxxxxxxxxxxxxxxxxxxxxxxxxxxxxxxxxxxxxxxxxxxxxxxxxxxxxxxxxx xxxxxxxxxxxxxxxxxxxxxxxxxxxxxxxxxxxxxxxxxxxxxxxxxxxxxxxxxxxxxxxxxxxxxxxxxxxxxx xxxxxxxxxxxxxxxxxxxxxxxxxxxxxxxxxxxxxxxxxxxxxxxxxxxxxxxxxxxxxxxxxxxxxxxxxxxxxx xxxxxxxxxxxxxxxxxxxxxxxxxxxxxxxxxxxxxxxxxxxxxxxxxxxxxxxxxxxxxxxxxxxxxxxxxxxxxx xxxxxxxxxxxxxxxxxxxxxxxxxxxxxxxxxxxxxxxxxxxxxxxxxxxxxxxxxxxxxxxxxxxxxxxxxxxxxx xxxxxxxxxxxxxxxxxxxxxxxxxxxxxxxxxxxxxxxxxxxxxxxxxxxxxxxxxxxxxxxxxxxxxxxxxxxxxx(b)
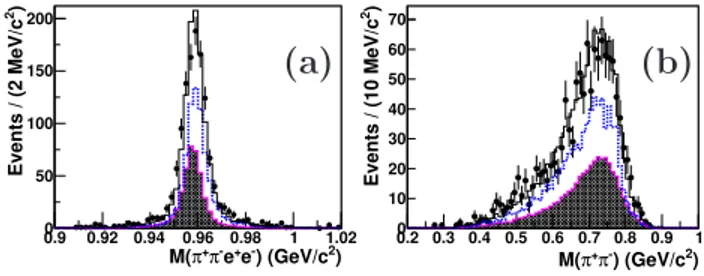
FIG. 1: Kinematical distributions for the η′
to π+π− e+e− decay: The invariant mass distributions of (a) π+
π− e+ e− and (b) π+ π−
. Dots with error bars represent the data; the shaded area is MC signal shape, the dashed histogram is the η′
→ γρ0
(π+ π−
) MC line shape, and the solid histogram is the sum
of MC signal and MC background from η′
→ γρ0 (π+
π− ). Both of these MC simulations are normalized to the yields found in Table I.
A very clear η′ signal is observed in the π+π−e+e−
203
invariant mass distribution, shown in Fig. 1(a) after
204
the above event selection. MC study shows that the
205
dominant background events come from J/ψ → γη′,
206
η′ → γπ+π− with the η′ photon subsequently converted
207
into an electron-positron pair; this background is
dis-208
played as the dashed histogram in Fig.1(a). The di-pion
209
invariant mass distribution, which is shown in Fig.1(b),
210
shows good agreement between data and MC
simula-211
tion. Figure 2 displays the e+e− mass spectrum after
212
requiring |M (π+π−e+e−) − m(η′)| < 0.02 GeV/c2; the
213
background from γπ+π−
conversions can be easily
distin-214
guished. The enhancement close to e+e−
mass threshold
215
corresponds to the signal from the η′
→ π+π−
e+e−
de-216
cay, and the clear peak around 0.015 GeV/c2comes from
) 2 ) (GeV/c -e + M(e 0 0.02 0.04 0.06 0.08 0.1 ) 2 Events / ( 1 MeV/c 0 20 40 60 80 100 120 FIG. 2: The e+ e−
invariant mass spectrum of data (dots with error bars) after all selection criteria are applied. The solid line represents the fit result, the dotted histogram is the MC signal shape and the shaded histogram is background obtained from η′
sideband events.
the background events of η′
→ γπ+π−
where the photon
218
undergoes conversion to an e+e−
pair and the electron
219
(positron)’s momentum is improperly reconstructed
as-220
suming that all the charged tracks are from the
inter-221
action point. The background contributions of J/ψ →
222
π+π−
π0 and J/ψ → γπ+π−
π0 are estimated from the
223
η′
sideband region (0.88 GeV/c2 < M (π+π−
e+e− ) < 224 0.90 GeV/c2 or 1.02 GeV/c2 < M (π+π−e+e−) < 1.04 225 GeV/c2). 226
To extract the η′ → π+π−e+e− events, a maximum
227
likelihood fit is performed on the observed e+e−
invari-228
ant mass distribution with the signal shape described by
229
the MC generator specifically developed for this
analy-230
sis, the dominant background shape parameterized by a
231
smooth function describing the γ conversion events from
232
η′ → γπ+π−, and the contribution (17 events) obtained
233
from η′
sideband fixed in the fit to account for the non-η′
234
background. The fit, shown in Fig. 2, yields 429 ± 24
235
π+π−
e+e−
events, and the detection efficiency obtained
236
from MC simulation is (16.94 ± 0.08)%; both are
summa-237
rized in TableI.
238
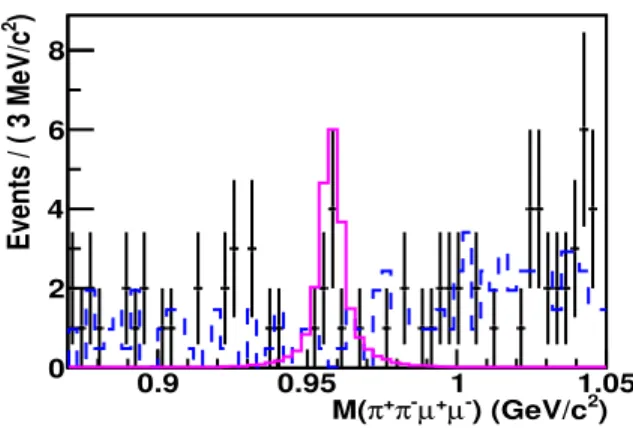
Figure 3 shows the π+π−µ+µ− invariant mass
spec-239
trum for candidates surviving all selection criteria. The
240
contribution from background events, mainly coming
241 from J/ψ → π0π+π− π+π− and J/ψ → γπ+π− π+π− 242
and estimated with the inclusive MC J/ψ events, is
243
shown as the dashed histogram. Although a few events
244
accumulate in the η′
mass region, they are not significant.
245
To determine the upper limit on the η′
signal, a series
246
of unbinned maximum likelihood fits is performed to the
247 mass spectrum of π+π− µ+µ− with an expected η′ signal. 248
In the fit, the line shape of the η′signal is determined by
249
MC simulation, and the background is represented with a
250
second-order Chebychev polynomial. The likelihood
dis-251
tributions of the fit are taken as the probability density
252
function (PDF) directly. The upper limit on the number
253
of signal events at the 90% C.L. is defined as NU.L,
corre-254 ) 2 ) (GeV/c -µ + µ -π + π M( 0.9 0.95 1 1.05 ) 2 Events / ( 3 MeV/c 0 2 4 6 8 FIG. 3: The π+π− µ+µ−
invariant mass distributions of data and MC simulation with all selection criteria applied. Dots with error bars represent the data, the solid histogram is MC signal, and the dashed line indicates inclusive MC.
sponding to the number of events at 90% of the integral
255
of the PDF. The fit-related uncertainties on NU.L are
256
estimated by using different fit ranges and different
or-257
ders of the background polynomial. The maximum one,
258
NU.L = 12, and the detection efficiency from MC
simu-259
lation, (35.47 ± 0.11)%, are used to evaluate the upper
260
limit on the branching fraction.
261 B. J/ψ → γη′ , η′ → γπ+π− 262 q FIG. 4: Scatter plot of M (γπ+
π−
) versus M (π+ π−
) for data. The final state is γγπ+π−
for this mode. The charged
263
track and good photon selection are the same as those
264
described above, but no PID is applied in the event
se-265
lection. A 4C kinematic fit is performed under the
hy-266
pothesis of J/ψ → π+π−γγ, and χ2
4C < 75 is required.
267
For events with more than two photon candidates, the
268
combination with the minimum χ2
4C is retained. To
re-269
ject background events with π0 in the final state, the
270
invariant mass of the two photons is required to satisfy
) 2 ) (GeV/c -π + π γ M( 0.88 0.90 0.92 0.94 0.96 0.98 1.00 1.02 1.04 ) 2 Events / (1MeV/c 0 2000 4000 6000 8000 10000 12000 ) 2 ) (GeV/c -π + π γ M( 0.88 0.90 0.92 0.94 0.96 0.98 1.00 1.02 1.04 ) 2 Events / (1MeV/c 0 2000 4000 6000 8000 10000 12000 FIG. 5: The γπ+ π−
invariant mass spectrum for data after all selection criteria are applied. The solid curve is the fit result, and the dashed line represents the background polynomial.
TABLE I: Numbers used in the branching fraction calcula-tions: the fitted signal yields, N (or 90% C.L. upper limit); the detection efficiency, ǫ.
η′ decay mode ǫ (%) N π+ π− e+ e− 16.94 ± 0.08 429 ± 24 π+ π− µ+ µ− 35.47 ± 0.11 < 12 γρ0 (π+ π− ) 45.39 ± 0.07 158916 ± 425
M (γγ) > 0.16 GeV/c2; this removes 94% background
272
while the efficiency loss is only 0.73%. The experimental
273 signature of J/ψ → γη′ (η′ → γπ+π− ) is given by the 274
radiative photon from J/ψ decays, that carries a unique
275
energy of 1.4 GeV. Consequently it is easy to distinguish
276
this photon from those from η′ decays. In this analysis,
277
the combination of γπ+π− invariant mass closest to the
278
η′
mass is chosen to reconstruct the η′
.
279
Figure 4 shows the scatter plot of M (γπ+π−
) versus
280
M (π+π−
) for the candidate events, where the distinct
281
η′
− ρ0 band corresponds to the decay η′
→ γπ+π−
. A
282
very clean η′
peak is observed in the M (γπ+π−
)
distri-283
bution, as displayed in Fig. 5. The peak is fitted with
284
the MC simulated signal shape convolved with a
Gaus-285
sian mass resolution function to account for the difference
286
in mass resolution between data and MC simulations,
287
plus a second-order Chebychev polynomial background
288
shape. The fit, shown as the smooth curve in Fig. 5
289
gives 158916 ± 425 η′
→ γπ+π−
events, and the
detec-290
tion efficiency, (45.39 ± 0.07)%, is obtained from the MC
291
simulation; these are tabulated in Table I. In the
simu-292
lation of η′
→ γπ+π−
, since the resonant contribution
293
from ρ0→ π+π− is insufficient to describe the data, the
294
non-resonant contribution (known as the ”box anomaly”)
295
is also included using a decay rate formula [17] deduced
296
from the ones used in Refs. [18–20]. With the parameters
297
tuned with data, the comparison of the simulated dipion
298
mass spectrum to data in Fig.6 shows good agreement.
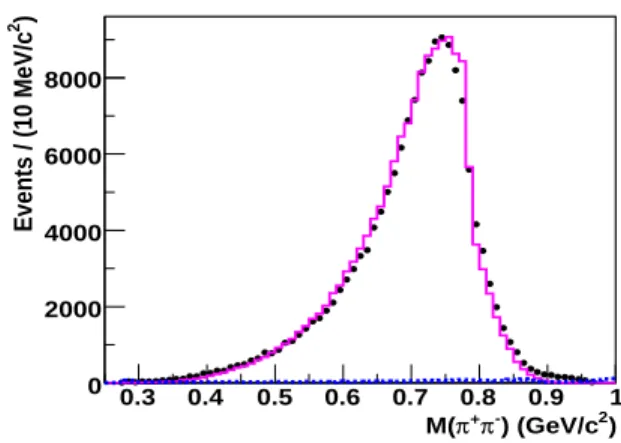
299 ) 2 ) (GeV/c -π + π M( 0.3 0.4 0.5 0.6 0.7 0.8 0.9 1 ) 2 Events / (10 MeV/c 0 2000 4000 6000 8000
FIG. 6: The comparison of the simulated π+π−
mass spec-trum with data. Dots with error bars are data within the η′
region ( [0.938, 0.978] GeV/c2
), the dashed histogram is background obtained from the η′
sideband, and the solid his-togram represents the MC simulation.
IV. SYSTEMATIC ERRORS
300
In the measurement of the ratio of the branching
frac-301
tions, the possible systematic error sources and the
cor-302
responding contributions are discussed in detail below.
303
• Form factor uncertainty. In the MC generator
304
used to determine the detection efficiency of η′ →
305
π+π−l+l−, the VMD factor defined for the
hid-306
den gauge model is introduced to account for the
307
contribution from the ρ0 meson. The detection
ef-308
ficiency dependence is evaluated by replacing the
309
factor above with the modified VMD factors
de-310
noted in Ref. [7]. The maximum change of the
311
detection efficiencies is assigned as the systematic
312
error, which is listed in TableII.
313
• MDC tracking efficiency. Since the systematic
er-314
rors for the two charged pions cancel by measuring
315
the relative branching fraction of η′
→ π+π−
l+l−
316
and η′
→ γπ+π−
, only the systematic error caused
317
by the MDC tracking from the leptonic pairs need
318
be considered. As the momenta of the two charged
319
leptons are quite low, it is difficult to select a
320
pure sample from data. In this analysis the MDC
321
tracking uncertainty of charged pions at low
mo-322
mentum is determined and used to estimate that
323
of the leptons by reweighting in accordance with
324
their momenta. The data sample of J/ψ → γη′
,
325
η′
→ γπ+π−
is used to evaluate the data-MC
dif-326
ference of pions at low momentum and finally the
327
MDC tracking uncertainty is estimated to be 2.1%
328
for electrons and 1.6% for muons, where the
domi-329
nant contribution is from the momentum region
be-330
low 200 MeV/c. Therefore 4.2% and 3.2% are taken
331
as the systematic errors on the tracking efficiency
332
for the channels with e+e−and µ+µ−, respectively,
in the final states.
334
• Photon detection efficiency. The photon
detec-335
tion efficiency is studied with three independent
336 decay modes, ψ(2S) → π+π−J/ψ (J/ψ → ρ0π0), 337 ψ(2S) → π+π− J/ψ (J/ψ → l+l− ) and J/ψ → 338
ρ0π0 [21]. The results indicate that the difference
339
between the detection efficiency of data and MC
340
simulation is within 1% for each photon. Since
341
the uncertainty from the radiative photons
can-342
cel by measuring the relative branching fraction of
343 η′ → π+π− l+l− and η′ → γπ+π− , 1% is taken 344
to be the systematic error from the photon in η′
345
decaying into γπ+π−
.
346
• Particle ID. The study of the particle ID efficiency
347
of the pion is performed using the clean control
348
sample of J/ψ → π+π−
π0, and indicates that the
349
pion particle ID efficiency for data agrees within 1%
350
of that of the MC simulation in the pion momentum
351
region. The particle ID efficiency of the electron
352
was checked with radiative Bhabha events, and the
353
difference between data and MC simulation is found
354
to be 1%. In this analysis, 4% is taken as the
sys-355
tematic error from the particle ID efficiency of the
356
four charged tracks in η′ decaying into π+π−l+l−.
357
• Kinematic fit. The clean sample J/ψ → φη (φ →
358
K+K−
, η → π+π−
π0) selected without a
kine-359
matic fit is used to estimate the systematic error
360
associated with the 4C kinematic fit. The
differ-361
ence between data and MC is determined to be
362
(0.47 ± 1.45)%, with χ2 < 75. In this paper, 1.9%
363
is taken to be the systematic error from the
kine-364
matic fit for the analyzed decays of J/ψ → γη′
365 (η′ → π+π− l+l− ). For J/ψ → γη′ , η′ → γπ+π− 366
channel, the 4C kinematic fit uncertainty is
esti-367
mated to be less than 0.7% using the control
sam-368
ple J/ψ → ρπ. Thus, the error from kinematic fit
369
is, 2.0%, the sum of them added in quadrature.
370
• Background uncertainty. Studies have shown that
371
the mass resolution of γπ+π−
, as simulated by the
372
MC, is underestimated. To evaluate the systematic
373
effect associated with this, the invariant mass of
374
γπ+π−
in the MC sample is smeared with a
Gaus-375
sian function, where the width of this Gaussian is
376
floated in the fit. The change of the result, 0.9%,
377
is assigned to be the systematic error.
378
• η′
mass window requirement. Another source
379
of systematic uncertainty is the requirement on
380
the η′
mass window selection |M (π+π−
e+e−
) −
381
m(η′)| < 0.02 GeV/c2. The uncertainty is
stud-382
ied using a looser requirement of 0.90 GeV/c2 <
383
M (π+π−
e+e−
) < 1.02 GeV/c2, and an uncertainty
384
of 2.0% is assigned for this item.
385
• Uncertainty of the number of η′
→ γπ+π−
events
386
(Nη′→γπ+π−). The uncertainty from this item, 387
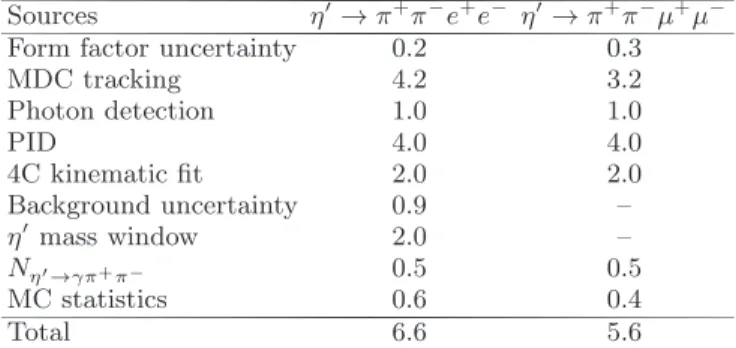
TABLE II: Impact (in %) of the systematic uncertainties on the measured branching fractions.
Sources η′ → π+ π− e+ e− η′ → π+ π− µ+ µ−
Form factor uncertainty 0.2 0.3
MDC tracking 4.2 3.2 Photon detection 1.0 1.0 PID 4.0 4.0 4C kinematic fit 2.0 2.0 Background uncertainty 0.9 – η′ mass window 2.0 – Nη′→γπ+π− 0.5 0.5 MC statistics 0.6 0.4 Total 6.6 5.6
0.5%, contains the error due to the π0 veto cut
388
(M (γγ) > 0.16 GeV/c2) and the fit-related error.
389
Except for the systematic uncertainties studied above,
390
a small uncertainty due to the statistical error of the
effi-391 ciencies in η′ → π+π− l+l− and η′ → γπ+π− is also con-392
sidered; all errors are summarized in TableII. The total
393
systematic error is the sum of them added in quadrature.
394
V. RESULTS
395
The ratio (upper limit) of B(η′ → π+π−l+l−) to
B(η′→ γπ+π−) is calculated with B(η′ → π+π− l+l− ) B(η′→ γπ+π−) = Nη′→π+π−l+l−/ǫη′→π+π−l+l− Nη′→γπ+π−/ǫη′→γπ+π− , where Nη′→π+π−l+l− and Nη′→γπ+π− are the observed 396
events (or the 90% C.L. upper limit) of η′ → π+π−l+l−
397
and η′
→ γπ+π−
, and ǫη′→π+π−l+l− and ǫη′→γπ+π− are 398
the corresponding detection efficiencies. With the
num-399
bers given in TableI, the ratio B(ηB(η′→′→π+γππ−+eπ+−e)−) is
deter-400
mined to be (7.2 ± 0.4 (stat.) ± 0.5 (syst.)) × 10−3, where
401
the first error is the statistical error from Nη′→π+π−l+l− 402
and Nη′→γπ+π−. To calculate the upper limit, the sys-403
tematic error is taken into account by a factor of 1−δ1
syst.
404
Therefore the upper limit, 1.0 × 10⁻⁴, on the ratio
405
B(η′→π+
π−e+
e−)
B(η′→γπ+π−) is given at the 90% confidence level.
406 VI. SUMMARY 407 The measurements of η′ → π+π− l+l− , l± = (e± , µ± ) 408
are performed using the sample of 225.3 million J/ψ
409
events collected with the BESIII detector. A clear
410
signal is observed in the invariant mass spectrum of
411
π+π−
e+e−
, and the ratio B(ηB′(η→′→π+γππ−+eπ+−e)−) is determined 412
to be (7.2 ± 0.4 (stat.) ± 0.5 (syst.)) × 10−3. Using
413
the PDG world average of B(η′
→ γπ+π−
) and its
un-414
certainty [3], the branching fraction is measured to be
415
B(η′→ π+π−e+e−) = (2.11±0.12 (stat.)±0.15 (syst.))×
10−3 which is consistent with the theoretical predictions
417
and previous measurement, but with the precision
im-418
proved significantly. The mass spectra of π+π− and
419
e+e− are also consistent with the theoretical predictions
420
that Mπ+π− is dominated by ρ0, and Me+e− has a peak 421
just above 2me with a long tail. No evidence for η′
422
decaying into π+π−
µ+µ−
is found, and an upper limit
423 of 1.0 × 10⁻⁴ on the ratio of B(η′→π+ π−µ+ µ−) B(η′→γπ+π−) is ob-424
tained at the 90% confidence level. The corresponding
425
branching fraction upper limit of η′
→ π+π− µ+µ− is 426 B(η′ → π+π− µ+µ− ) < 2.9 × 10⁻⁵. 427 VII. ACKNOWLEDGMENT 428
The BESIII collaboration thanks the staff of BEPCII
429
and the computing center for their hard efforts. This
430
work is supported in part by the Ministry of Science and
431
Technology of China under Contract No. 2009CB825200;
432
National Natural Science Foundation of China (NSFC)
433
under Contracts Nos. 10625524, 10821063, 10825524,
434
10835001, 10935007, 10979033, 10979012, 11175189,
435
11125525, 11235011; Joint Funds of the National
Nat-436
ural Science Foundation of China under Contracts Nos.
437
11079008, 11179007; the Chinese Academy of Sciences
438
(CAS) Large-Scale Scientific Facility Program; CAS
un-439
der Contracts Nos. KJCX2-YW-N29, KJCX2-YW-N45;
440
100 Talents Program of CAS; German Research
Foun-441
dation DFG under Contract No. Collaborative Research
442
Center CRC-1044; Istituto Nazionale di Fisica Nucleare,
443
Italy; Ministry of Development of Turkey under
Con-444
tract No. DPT2006K-120470; U. S. Department of
En-445
ergy under Contracts Nos. FG02-04ER41291,
DE-446
FG02-05ER41374, DE-FG02-94ER40823; U.S. National
447
Science Foundation; University of Groningen (RuG) and
448
the Helmholtzzentrum fuer Schwerionenforschung GmbH
449
(GSI), Darmstadt; WCU Program of National Research
450
Foundation of Korea under Contract No.
R32-2008-000-451
10155-0. This paper is also supported by the Natural
452
Science Foundation of Shandong Province, China under
453
Contracts Nos. 2009ZRB02465.
454
[1] G. R. Kalbfleisch et al., Phys. Rev. Lett. 12, 527 (1964).
455
[2] M. Goldberg et al., Phys. Rev. Lett. 12, 546 (1964).
456
[3] J. Beringer et al., Phys. Rev. D 86, 010001 (2012).
457
[4] P. Naik et al., Phys. Rev. Lett. 102, 061801 (2009).
458
[5] A. Faessler, C. Fuchs, M. I. Krivoruchenko, Phys. Rev.
459
C 61, 035206 (2000).
460
[6] B. Borasoy, R. Nissler, Eur. Phys. J. A 33, 95 (2007).
461
[7] T. Petri, arXiv:1010.2378 [nucl-th].
462
[8] M. Ablikim et al., Chin. Phys. C 36, 915 (2012).
463
[9] M. Ablikim et al., Nucl. Instrum. Meth. A 614, 345
464
(2010).
465
[10] S. Agostinelli et al., Nucl. Instrum. Meth. A 506, 250
466
(2003).
467
[11] J. Allison, K. Amako, J. Apostolakis, H. Araujo,
468
P. Dubois et al., IEEE Trans. Nucl. Sci. 53, 270 (2006).
469
[12] S. Jadach, B. Ward, Z. Was, Comput. Phys. Commun.
470
130, 260 (2000).
471
[13] S. Jadach, B. Ward, Z. Was, Phys. Rev. D 63, 113009
472
(2001).
473
[14] R. G. Ping et al., Chin. Phys. C 32, 599 (2008).
474
[15] J. C. Chen et al., Phys. Rev. D 62, 1 (2000).
475
[16] Z. Y. Zhang, L. Q. Qin, S. S. Fang, Chin. Phys. C 36,
476 926 (2012). 477 [17] dΓ dm∝ k 3 γq 3 π(m)|BWρGS(1 + δm 2 m2 ρBWω) + β| 2 , where kγ is 478
the photon energy and qπ(m) is the momentum of pion in
479
the π+ π−
rest frame. BWGS
ρ is the Breit-Wigner
dsitri-480
bution in GS parameterazation [22]. |δ| represents the
481
contribution from ω resonance and the complex phase of
482
δ represents the interference between ω and ρ(770)
reso-483
nance. mρis the mass of the ρ(770) resonance. β
repre-484
sents the contribution from the non-resonance.
485
[18] A. Abele et al., Phys. Lett., B402, 195 (1997).
486
[19] R. R. Akhmetshin et al., Phys. Lett., B527, 161 (2002).
487
[20] M. Benayoun et al., Z. Phys. C58, 31 (1993).
488
[21] M. Ablikim et al., Phys. Rev. D 83, 112005 (2011).
489
[22] G. J. Gounaris, J. J. Sakurai, Phys. Rev. Lett. 21, 244
490
(1968).