Dynamic Transpiration of a Greenhouse Grown Potted
New Guinea Impatiens
Halil KIRNAK1 Ted H. SHORT2
Geliş Tarihi : 02.01.2001
Abstract: Transpiration rates of New Guinea Impatiens (lmpatiens X hb.) cv. 'Equinox' grown in a computer-controlled greenhouse were measured by using weighing lysimeter and evaluated according to solar radiation, vapor pressure deficit, and a combination model. The combination model was accurately estimated transpiration rate with an r2 of 0.92, RMSE of 0.11, and d of 0.95. The average transpiration rate of the plant was about 400 g/m 2h for sunny days and 325 g/m 2h for partly cloudy days. In the range of between 5 kPa and 20 kPa, tensiometer-based drip irrigation system was used to irrigate the plants automatically. During the daytime period, canopy leaf temperature was found considerably lower than greenhouse air temperature due to high transpiration rate.
Key Words: tranpiration, new guinea impatiens, automation, solar radiation, yapar pressure deficit, drip irrigation
Serada Saks
ı
da Yeti
ş
tirilen New Guinea lmpatiens Bitkisinin Dinamik
Transpirasyonu
Özet: Bilgisayarlı sera ortamında yetiştirilen New Guinea Impatiens (Impatiens X hb.) 'Equinox' bitkisinin transpirasyonu tartılı lizimetre yardımıyla ölçüldü. Transpirasyon hava nem açığı, solar radyasyon ve kombinasyon eşitliği dikkate alınarak değerlendirildi. Kombinasyon eşitliği; 0.92 regrasyon katsayısı, 0.11 hata kareler ortalaması ve 0.95 uyum indeksi ile transpirasyonu doğru bir şekilde tahmin etmiştir. Ortalama trasnpirasyon sıcak günler için 400 g/m2h, bulutlu günler için ise 325 g/m 2h olarak bulunmuştur. Bitkiler, damla sulama sisteminde ortam nemini ölçen tansiyometreler kullanılarak 5 kPa ile 20 kPa aralığında sulanmıştır. Bitki yaprak sıcaklığı, yüksek transpirasyondan dolayı önemli ölçüde sera hava sıcaklığından düşük bulunmuştur.
Anahtar Kelimeler: transpirasyon, new guinea impatiens, otomasyon, solar radyasyon, buhar basıncı açığı, damla sulama
Infroduction
Dynamic water use by horticultural plants is an important parameter for designing and operating irrigation and fertigation systems. While water is essential for plant growth through photosynthesis, most of the irrigation water is transmitted through the plant and vapors through stomatal pores of leaves as transpiration.
Many research studies have been conducted to evaluate transpiration. These studies include measuring and computing water lost due to transpiration by determining a relationship between canopy transpiration and related environmental factors. Many methods have been developed to compute transpiration from plant canopies based on clirnatological parameters such as net radiation, temperature, wind speed and relative humidity. Methods are generally classifıed as pan evaporation method, temperature method, radiation method, energy balance method, combination method, and other empirical equations.
An energy balance concept which was applied to crop surfaces without any surface resistance function for water vapor transfer was introduced by Penman (1948) and it was called Penman equation. The Penman equation was modified by Monteith (1975) with aerodynamic and surface resistance terms and it was referred as the combination equation. This equation not only did reconcile thermodynamic and aerodynamic aspects of transpiration,
but also included the aerodynamic resistance to sensible heat and vapor transfer, and the surface resistance to vapor transfer (Short et al. 1997). According to Stanghellini (1987), movement of water between the leaf and the environment is governed by internal and external resistances. The external resistance defines the movement of vapor from the leaf surface to the free air. The internal resistance was assumed to regulate flow of water from the phase interface of liquid and vapor to the leaf surface. In other words, internal resistance was considered a function of the diffusivity of the leaf cuticle layer and the stomata.
Both resistances were discussed in detail by Stanghellini (1987) for a greenhouse environment. The combination method was investigated for greenhouses and nursery applications by Stanghellini (1987) in the Netherlands and it was also studied by Yang et al.(1990a), Pang et al. (1992), Al-Shooshan (1991) and Fynn et al. (1993) in Ohio, USA in order to measure evapotranspiration (ET) for different greenhouse crops.
The purpose of this research was to measure actual transpiration from New Guinea Impatiens and to compare these measurements for predicted transpiration rates using the combination equation as well as proportionalities to solar radiation and vapor pressure deficit. This was to
2
The Ohio State University, Food Agricultural and Biologicz:1 Engineering Dep., Wooster-USA
14 TARIM BILIMLERI DERGISI 2001, Cilt 7, Sayı 3
be achieved by (a) measuring actual transpiration from New Guinea Impatiens by using a weighing lysimeter (b) estimating transpiration of New Guinea Impatiens by using the combination model method in comparison to measured results, and (c) evaluating the independent proportionality of solar radiation and vapor pressure deficit for transpiration of New Guinea Impatiens.
Materials and Methods
Experiment was conducted in a computer-controlled, double-polyethylene greenhouse located at the Ohio Agricultural Research and Development Center (OARDC), Wooster, Ohio (41° 30' N latitude). Measurements were taken for 16 consecutive days from 10/9/1997 through 26/9/1997 in autumn when greenhouse air temperatures ranged from 18 to 37 °C under natural light conditions. The greenhouse compartment used in this experiment was 5 m wide and 30 m long with an evaporative-pad and fan ventilation system across the long dimension. There was no artifcial heating cr lighting during the experiment.
New Guinea Impatiens, a well known garden crop in USA, are one of the most popular bedding plants. Most are grown in hanging baskets or as potted plants for transplanting into the landscape or as container plants for the patio or window boxes.
In this experiment, twenty container-grown New Guinea Impatiens of similar size and appearance were obtained from a local grower on 10 September 1997 and used until 26 September 1997. The plants were in pots 15 cm diameter. The spacing used between pots was 25 cm in all directions.
The soil surface of the containers was covered with a plastic sheet to minimize evaporation from the container media. The Potting medium used in the experiment was Metromix 510 (The Scotts Company, Marysville, OH). A slow release fertilizer called Osmocote ( 8-9 month) was used to fertilize the plants by using a fertigator system developed at Wooster, OH. N-P-K ratio of the Osmocote was 18-6-12. The general ingredients of the growing medium were composted pine bark (20-45%), horticultural vermiculite(15-30%), Canadian sphagnum peat moss(25- 35%), and processed bark ash(5-25%). The dry bulk density of the medium was estimated by the manufacturers to be 0.25 g cm -3. Salinity level and pH of the medium was normal (pH=7.2, and EC=3.0 mrnhos/cm). Water source for irrigation was local city water with a pH and soluble salts (EC) of 7.2 and 0.53 mmhos/cm respectively.
Tensiometer- based automatic irrigation
A Q-COM Inc., irvine, CA computer controlled drip-irrigation system with GEM-III software was used to irrigate the plants simultaneously. The computer-controlled microirrigation system consisted of a soil tension sensor with a'solid state pressıire transducer attached, a spray stake emitter, a solenoid valve, an analog-to-digital converter (A/D), and a PC computer with GEM3V2 software.
One emitter was placed in a flask to measure the total amount of irrigation water applied and one emitter was used for each plant. The irrigation timing was controlled by a Q-COM soil water tension control system where a tensiometer was placed half way down into the growing media of each of the containers. Porous cup tensiometer with an electronic pressure transducer at the top was used to sense the medium tension. The tensiometer sensor consisted of a ceramic cup fastened to transparent tube with an airtight seal. The tube was fılled with water until there was small air column remaining at the top of the tube. The pressure transducer measured the vacuum in the air column and translated this vacuum pressure into an electrical signal. Then, this electrical signal was sent to A Q-COM computer with GEM3V2 software. A Q-COM computer with GEM3V2 software was used to sense and monitor the medium tension. GEM3V2 software requires sampling tension interval and a numerical value for medium tension as inputs. In this experiment, potting media tension was allowed to go up to maxirnum 20 kPa to avoid plant stress based on Pang (1992) and sampling interval for medium tension was 15 minutes. In the soil moisture tension based irrigation, the computer' continuously monitors the tensiometers replaced in the root zone of the crop. As water is extracted from the soil, the tension in the soil and tensiometer increases. When the high tension set-point is reached, the automatic valve is opened. As water is applied, the soil moisture tension decreases and the valve is closed when the low set-point is attained.
Measurements
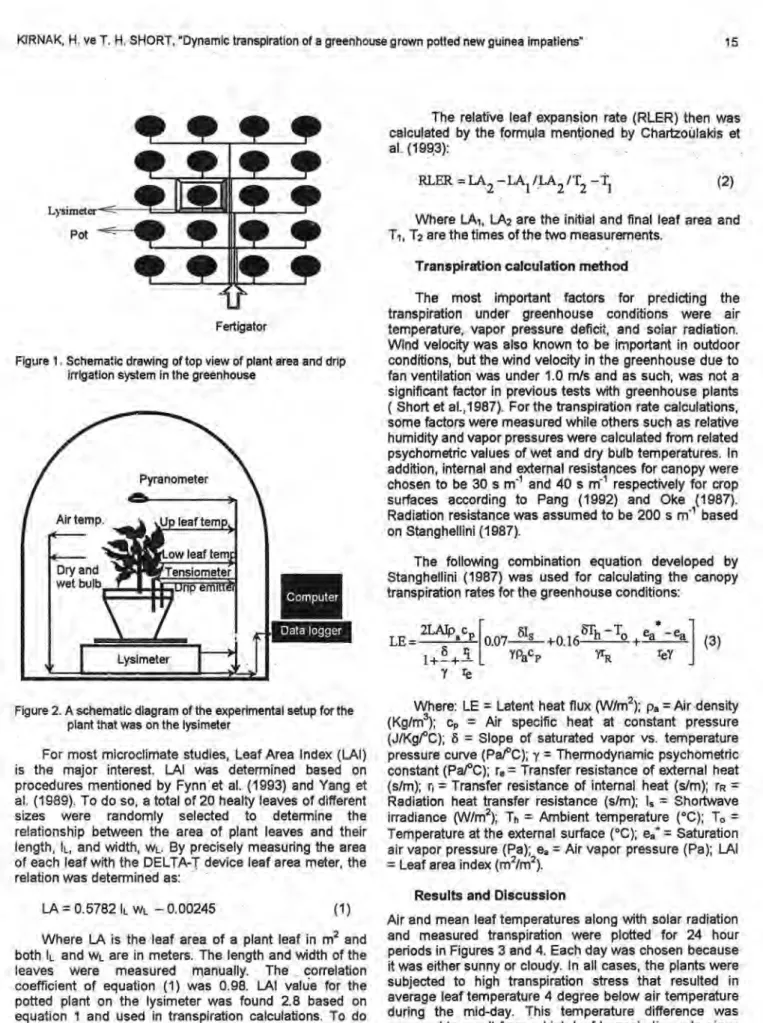
Leaf and air (wet and dry bulb) temperatures were measured with type T thermocouples. For leaf temperatures, thermocouples of 1 mm size were inserted into the central leaf veins from the back side of leaves at two different heights; these measurements were designated as upper canopy leaf temperature and lower canopy leaf temperature. A Satorius F330S electronic weighing scales with an accuracy of ± 1 g was placed beneath one of the plants to measure actual transpiration since there was only one lysimeter and it was placed in the center of the experimental area. The lysimeter was located in the middle of the nursery growing area in order to represent the environment in a best way. The lysimeter was a portable and sensitive one. Transpiration measurements and related parameters were ccllected from the pot on this lysimeter. An Epply precision pyranometer was used to measure solar radiation abcve the plant canopy. The pyranometer was placed 30 am above the plant canopy to obtain a proper view factor.
The experimental setup and instrumentation are illustrated in Figure 1 and 2. All measuring sensors were connected to a Kaye DIGISTRIP III datalogger and computer at 15 minutes interval continuously. The datalogger recorded all the sensor readings in 15 minute intervals.
Canopy architecture
Greenhouse microclimate is not only a function of macroclimatic variables, but also strongly dependent on plant architecture.
The relative leaf expansion rate (RLER) then was calculated by the formula mentioned by Chartzoulakis et al. (1993):
RLER = LA
2 – LA1 /LA2 /T2 – T1 (2)
Where LA., LA2 are the initial and fınal leaf area and
Tl, T2
are the times of the two measurements.Transpiration calculation method Lysimeter
Pot
Fertigator
Figure 1. Schematic drawing of top view of plant area and drıp irrigation system in the greenhouse
Figure 2. A schematic diagram of the experimental setup for the plant that was on the lysimeter
For most microclirnate studies, Leaf Area Index (LAI) is the major interest. LAI was determined based on procedures mentioned by Fynn et al. (1993) and Yang et al. (1989). To do so, a total of 20 healty leaves of different sizes were randomly selected to determine the relationship between the area of plant leaves and their length, IL, and width, wL. By precisely measuring the area of each leaf with the DELTA-T device leaf area meter, the relation was determined as:
LA = 0.5782 IL \Ak – 0.00245 (1)
Where LA is the leaf area of a plant leaf in m 2 and both IL and wL are in meters. The length and width of the leaves were measured manually. The correlation coefficient of equation (1) was 0.98. LAI value for the potted plant on the lysimeter was found 2.8 based on equation 1 and used in transpiration calculations. To do that, the length and width of all leaves of the plant on the lysimeter were measured and inserted into equation 1 to determine the area of each leaves. Then, LAI of the plant canopy was obtained by summing up the areas of all leaves of the plant and dividing by the corresponding floor area of the plant
The most important factors for predicting the transpiration under greenhouse conditions were air temperature, vapor pressure defici -i:, and sciar radiation. Wind velocity was also known to be important in outdoor conditions, but the wind velocity in the greenhouse due to fan ventilation was under 1.0 m/s and as such, was not a signifıcant factor in previous tests with greenhouse plants ( Short et al.,1987). For the transpiration rate calculations, some factors were measured while others such as relative humidity and vapor pressures were calculated from related psychometric values of wet and dry bulb temperatures. In addition, internal and external resistances for canopy were chosen to be 30 s m -1 and 40 s m-1 respectively for crop surfaces according to Pang (1992) and Oke (1987). Radiation resistance was assumed to be 200 s m -1 based on Stanghellini (1987).
The following combination equation developed by Stanghellini (1987) was used for calculating the canopy transpiration rates for the greenhouse conditions:
LE= 2LAIp a c p 0.07 81, +0.16 61'1," –To + ea * – e, (3) re? Pac P YrR 8 1+ – +— Y re
Where: LE = Latent heat flux (W/m 2 ); pa = Air density (Kg/m3); cp = Air specifıc heat at constant pressure (J/Kg/°C); S = Slope of saturated vapor vs. temperature pressure curve (Pa/ °C); y = Thermodynamic psychometric constant (Pai3C); re = Transfer resistance of external heat (s/m); r, = Transfer resistance of internal heat (s/m); rR = Radiation heat transfer resistance (s/m); I s = Shortwave irradiance (W/m 2);
Th =
Ambient temperature (°C); = Temperature at the external surface (°C); e a" = Saturation air vapor pressure (Pa); e a = Air vapor pressure (Pa); LAI = Leaf area index (m 2/m2).Results and Discussion
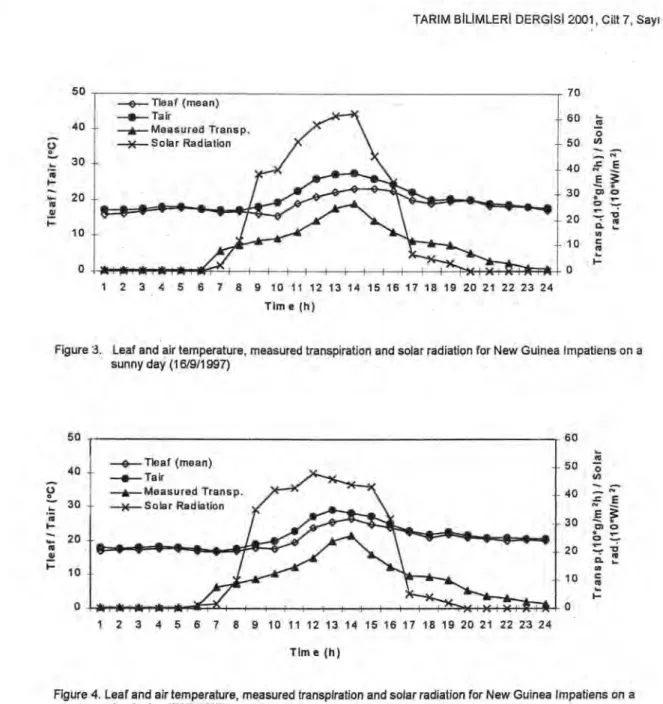
Air and mean leaf temperatures along with solar radiation and measured transpiration were plotted for 24 hour periods in Figures 3 and 4. Each day was chosen because it was either sunny or cloudy. In all cases, the plants were subjected to high transpiration stress that resulted in average leaf temperature 4 degree below air temperature during the mid-day. This temperature difference was assumed to result from a high leaf transpiration rate since there was no other process to cool the leaves. Similar results and conclusions were reported by Short et al. (1997) and Stanghellini (1987) for greenhouse environments. Figures 3 and 4 also illustrate that leaf and air temperatures were approximately the same from
10 —o— Tleaf (mean)
_e_ Ta ir _ir_Measured Transp. —Solar Radiation 20 E -o' 50 40 30 20 10 Tlea f / Ta ir (°C) 70 60 50 40 E 30 crı o
n.
c
R 1 2 3 4 5 6 7 8 9 10 11 12 13 14 15 16 17 18 19 20 21 22 23 24 60 50 40 30 30 .4.7ı rıl 20 20 10 (mean) Ta ir —h--Measured Transp. —x--Solar Radiation 50 —o rn 40 --- " ;.,c E E Cit ci 10 rıı16 TARIM BILIMLERI DERGISI 2001, Cilt 7, Sayı 3
1 2 3 4 5 6 7 8 9 10 11 12 13 14 15 16 17 18 19 20 21 22 23 24 Tim e (h)
Figure 3. Leaf and air temperature, measured transpiration and solar radiation for New Guinea Irnpatiens on a sunny day (16/9/1997)
Time (h)
Figure 4. Leaf and air temperature, measured transpiration and solar radiation for New Guinea Impatiens on a cloudy day (20/9/1997)
midnight to 8:00 am. This phenomena was observed for all days of experimental period; ventilation air from the fans was apparently adequate to keep the air temperature very close to the leaf temperature and there was no solar radiation or artifıcial lighting during this time period.
During the experimental period, leaf temperature was found to be consistently lower than air temperature. The maximum difference between air-leaf temperature was directly associated with maximurn solar radiation. In previous studies, researchers have reported that leaf temperature was higher than air temperature during periods of high solar radiation. These kind of results especially were related 'with open field crops (Salisbury 1979). However, Jackson et al. (1981) and Yang et al. (1990b) found leaf temperature often equal to or below air temperature in irrigation studies for and regions. Furthermore, Jackson et al. (1981) stated that when leaf temperatures were quite higher than air temperatures, plants were stressed. Within greenhouses, leaf temperature depressions were frequently found by many researchers. For example, Montero et al. (1981) and
Hashimoto and Morimoto (1984) showed that leaf temperature could be consistently lower than the greenhouse air temperature.
In this study, consistently with other studies, the leaf temperatures found lower than air temperatures. And, most probably, this is related to the high transpiration rate of the greenhouse grown New Guinea Impatiens crop. The high vapor pressure of greenhouse air during daytime and unlimited water supply perhaps were the main factors that made high transpiration possible. Stanghellini (1987) stated that when LAI was big enough (approximately 2 or bigger), piants could not take enough energy from solar radiation aione to transpire the water. Hence, an extra energy for transpiration was taken from greenhouse air. In a similar way, when vapor pressure deficit (VPD) was high and stomatal ressistance was low during daytime period, transpiration may require more energy than is available to plant leaves from net solar radiation. In this situation, plants needed to take the rest of the energy from greenhouse air. This may cause leaf temperature consistently lower than air temperature during the daytime.
30 25 20 15 - 10 <e I Z C O 'Y E 2 7-7, 0. o 25 f E 0 "
■
I's 20 c o 15 1, • _ 10 'n 5 --»— Solar Radiation Pressure Deficit—A— Measured Transp.
30 1 2 3 4 5 6 7 8 9 10 11 12 13 14 15 16 17 18 19 20 21 22 23 24 <,i (no 0 Pre ssure De fic it( 2 *Pa) 600 500 400 300 200 100
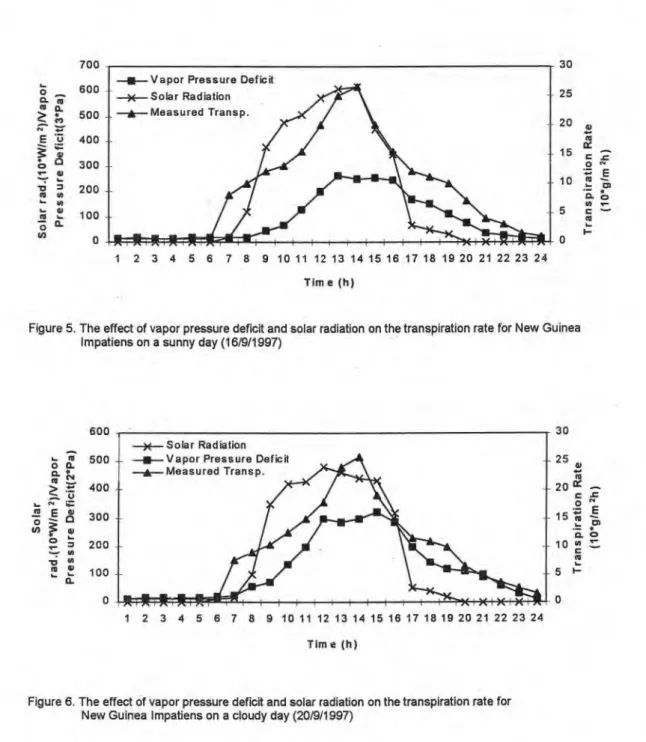
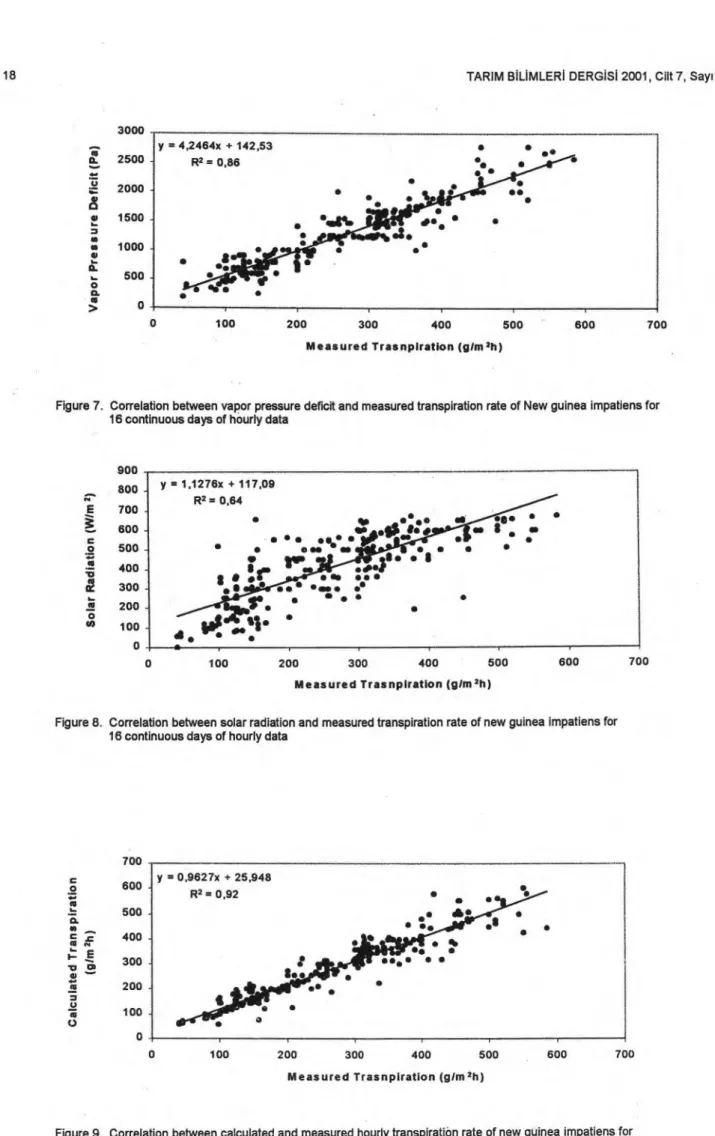
Consistent with other greenhouse crop transpiration studies, Figures 5 and 6 illustrate that the primary factors that affected the transpiration rate were solar radiation and vapor pressure deficit between the plant canopy and the air above it. The vertical axes of solar radiation and VPD were individually scaled for transpiration values over time to show proportionalities for the same example days used for leaf and air temperature differences. Ali data were used to show data scatter and calculated regression coefficients for hourly transpiration rates in proportion to solar radiation and VPD (Figure 7 and 8). From the R squared coefficient of the analysis of variance, it was
evident that VPD with a coefficient of 0.86 was more proportional to transpiration that solar radiation with a coefficient of 0.64. However, the combination model in Eq. 2 provided the best predictions of transpiration for the plant used in this study with a regression coefficient of 0.92 (Figure 9).
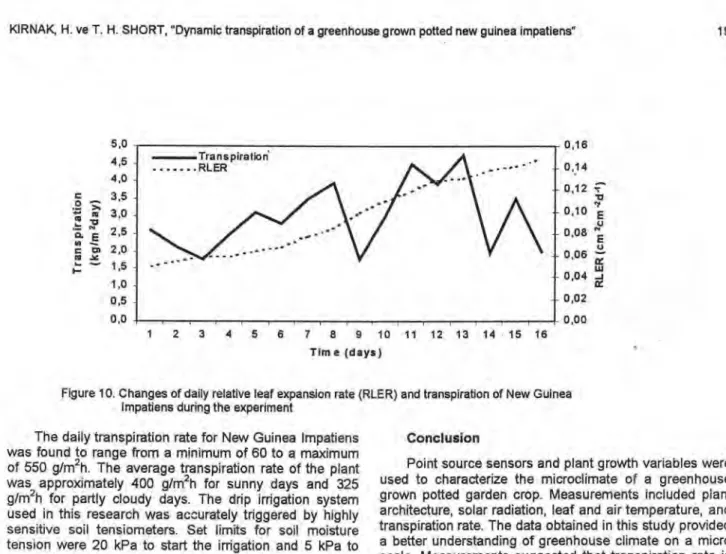
Figure 10 shows relative leaf expansion rate (RLER) and daily transpiration rate. Figure 10 indicates that the transpiration rate of the plant was found not to be highly dependent on leaf area.
--.--Vapor Pressure Deficit --x-- Solar Radiation ---ik--Measured Transp.
1 2 3 4 5 6 7 8 9 10 11 12 13 14 15 16 17 18 19 20 21 22 23 24 Time (h)
Figure 5. The effect of vapor pressure deficit and solar radiation on the transpiration rate for New Guinea Impatiens on a sunny day (16/9/1997)
Time (h)
Figure 6. The effect of vapor pressure deficit and solar radiation on the transpiration rate for New Guinea Impatiens on a cloudy day (20/9/1997)
`6 E
0
o uı Pressure 700 600 500 300 200 1003000 2500 2000 - 1500 - 1000 500 - y = 4,2464x + 142,53 R2 = 0,86
•
•
Il
a
•
• •
•
• •
•
•
•
•
•
Vap or Pres s ure De fic it ( Pa ) 700 600 100 200 300 400 500 0 y = 1,1276x + 117,09 R2 = 0,64 So lar Ra dia tio n ( W /m 2) 900 800 - 700-600 - 500 -400 300 200 100 0 y = 0,9627x + 25,948 R2 = 0,92•
▪
• •
•
• al
ı
•
• • «,
•
• •
• qı••
•
•
•
a•• • •
as•
•
•
TARIM BILIMLERI DERGISI 2001, Cilt 7, Sayı 3 18
0 100 200 300 400 500 600 700
Measured Trasnpiration (g/m2h)
Figure 7. Correlation between vapor pressure defıcit and measured transpiration rate of New guinea impatiens for 16 continuous days of hourly data
Measured Trasnpiration (g/m2h)
Figure 8. Correlation between solar radiation and measured transpiration rate of new guinea impatiens for 16 continuous days of hourly data
700
o
•
600 500 • 400 eu ı— E -o ol> 300 io --- 200 • 100 o 0 100 200 300 400 500 600 700 Measured Trasnpiration (g/m2h)Figure 9. Correlation between calculated and measured hourly transpiration rate of new guinea impatiens for 16 continuous days
Transpiratiori RLER 5,0 4,5 4,0 3,5 3,0 2,5 2,0 1,5 1,0 0,5 0,0 0,16 – 0,14 – 0,12 – 0,10 – 0,08 – 0,06 – 0,04 – 0,02 0,00 RLER (cm 2 cm -2d -1) 5 6 7 8 9 10 11 12 13 14 15 16 Tim e (days)
Figure 10. Changes of daily relative leaf expansion rate (RLER) and transpiration of New Guinea Impatiens during the experiment
The daily transpiration rate for New Guinea Impatiens was found to range from a minimum of 60 to a maximum of 550 g/m 2h. The average transpiration rate of the plant was approximately 400 g/m 2 h for sunny days and 325 g/m2h for partly cloudy days. The drip irrigation system used in this research was accurately triggered by highly sensitive soil tensiometers. Set limits for soil moisture tension were 20 kPa to start the irrigation and 5 kPa to terminate it. Most importantly, the soil tensiometers responded to plant requirements before the plants experienced any apparent wilting.
In order to evaluate the effectiveness of the combination model, root mean square error (RMSE),the actual error produced by the model, was calculated as:
N
RMSE = Z —(R –0 i ) 2 ) 0.5
(4)
Where N, is the number of cases, Pi, is the predicted value, and 0i, is the corresponding observed (measured) value. Besides RMSE, the index of agreement (d) was also computed in order to reflect the degree to which the predicted variation accurately estimates the observed variation: 1\
(Pi —0 ) 2
d=1
— 11(P
ı
o
) 2
1=1 Where =-
İ3 andO,
= 0; -Ö.RMSE and d value of the combination ET model developed by Stanghellini (1987) was calculated as 0.11 and 0.95 respectively. These calculated RMSE and d values supported the high regression coefficient determined earlier and they proved the effectiveness of the combination model in the prediction of the transpiration rate.
Conclusion
Point source sensors and plant growth variables were used to characterize the microclimate of a greenhouse grown potted garden crop. Measurements included plant architecture, solar radiation, leaf and air temperature, and transpiration rate. The data obtained in this study provided a better understanding of greenhouse climate on a micro scale. Measurements suggested that transpiration rate is not a proportional function of leaf area. Although solar radiation and vapor pressure deficit were high during the day time, leaf temperatures consistently were lower than air temperatures. This was due to higher transpiration rate of the plant. The high transpiration rate during the day time period (especially between 8:00 am and 16:00 pm) indicates that stomatal resistance most probably was lower during these time period.
The combination model was shown to accurately estimate the transpiration of a greenhouse grown potted crop with a regression coefficient of 0.92, RMSE of 0.11, and d of 0.95. The average transpiration rate of the plant was approximately 400 g/m 2h for sunny days and 325 g/m2h for partly cloudy days. Plants were irrigated automatically using sensitive soil tensiometers in drip irrigation system. In tensiometer based drip irrigation system, set limits for soil moisture tension were 20 kPa to start the irrigation and 5 kPa to terminate it. This study also showed that in modern greenhouses, automated irrigation systems would be used to modify irrigation frequency according to transpiration. And, tensiometers could be effectively used in the automation of drip irrigation system.
References
AI-Shooshan, A. A. 1991.Greenhouse Total Water Use Analysis Modeling and Optimization, Ph.D. thesis, The Ohio State University, OSU press, Columbus, OH., 186.
Chartzoulakis, K., B. Noitsakis, and I. Therios, 1993. Photosynthesis, plant growth and dry matter distribution in kiwifruit as influenced by water defıcits. Irrigation Science, 14:1-5.
20 TARIM BILIMLERI DERGISI 2001, Cilt 7, Sayı 3
Fynn, R. P., A. AI-Shooshan, T. H. Short and R. W. McMahon, 1993. Evapotranspiration Measurements and Modeling for a Potted Chrysanthemum Crop, Transactions of the ASAE, 36(6),1907-1913.
Jackson, R. D., S. B. Idso, R. J. Reginato and P. J. Pinter, 1981. Canopy temperature as a crop water stress indicator. Water Resources Research 17:1133-1138.
Kirnak, H. 1998. Developing a Theoretical Basis for Demand Irrigation of Acer Rubrum, Ph.D. dissertation, The Ohio State University, December 12 1998, OSU press, Columbus, OH., 210.
Montero, J. I., T. H. Short, R. B. Curry and W. L. Bauerle, 1981. Influence of evaporation cooling systems on greenhouse environment. ASAE paper no. 81-4027. St. Joseph, MI:ASAE.
Monteith, J. L. 1975. Principles of environmentai physics, Edward Arnold, London.
Oke, T.R. (1987). Boundary Layer Climates, Methuen Co. Ltd., Second edition, London, 659.
Pang, T., R. P. Fynn, R. D. Fox and T. H. Short, 1992. Biophysical Behavior Under Heat Stress for New Guinea Impatiens, An ASAE Meeting Presentation, ASAE paper no: 927503.
Pang, T. 1992. Dynamic Analyis of Water and Nutrient Uptake for New Guinea Impatiens, Ph.D. dissertation, The Ohio State University, OSU press, Columbus, OH., 152.
Penman, H. L. 1948. Natural Evapotranspiration From Open Water, Bare Soil and Grass, Proc. Roy. Soc., 193, London, 175.
Short, T. H., A. Irvem and R. C. Hansen, 1997. Dynamic Transpiration of Highly-Stressed Container-Grown Acer Rubrum, An ASAE Meeting Presentation, ASAE paper no: 975003.
Salisbury, F. B. 1979. Temperature. In Controlled Environment Guidelines for Plant Research, eds. T.W. Tibbitts and T.T. Kozlowski, 75-116, New York: Academic Press.
Stanghellini, C. 1987. An Aide to Climate Management, Transpiration of Greenhouse Crops, Wageningen, Elsevier Sci. Publishers, 1-45.
Yang, X., T. H. Short, R. D. Fox and W. L. Bauerle , 1989. The microclimate and transpiration of a greenhouse cucumber
crop, Transactions of the ASAE. 32(6),2143-2149.
Yang, X., T. H. Short, R. D. Fox and W. L. Bauerle, 1990a.Transpiration, Leaf Temperature and Stomatal Resistance of a Greenhouse Cucumber Crop, Agricultural and Forest Meteorology, 51,197-209.
Yang, X., T. H. Short, R. D. Fox and W. L. Bauerle , 1990b. Plant Architectural Parameters of a Greenhouse Cucumber Crop, Agricultural and Forest Meteorology, 51, 197-209.