Review Paper
The CLAIR model: Extension of Brodmann areas based on brain
oscillations and connectivity
Erol Ba
şar
⁎
, Aysel Düzgün
Istanbul Kultur University, Brain Dynamics, Cognition and Complex Systems Research Center, Istanbul, Turkey
a b s t r a c t
a r t i c l e i n f o
Available online 17 February 2015 Since the beginning of the last century, the localization of brain function has been represented by Brodmann areas, maps of the anatomic organization of the brain. They are used to broadly represent cortical structures with their given sensory-cognitive functions. In recent decades, the analysis of brain oscillations has become important in the correlation of brain functions. Moreover, spectral connectivity can provide further information on the dynamic connectivity between various structures. In addition, brain responses are dynamic in nature and structural localization is almost impossible, according to Luria (1966). Therefore, brain functions are very difficult to localize; hence, a combined analysis of oscillation and event-related coherences is required. In this study, a model termed as“CLAIR” is described to enrich and possibly replace the concept of the Brodmann areas. A CLAIR model with optimum function may take several years to develop, but this study sets out to lay its foundation.
© 2016 The Authors. Published by Elsevier B.V. This is an open access article under the CC BY license (http://creativecommons.org/licenses/by/4.0/). Keywords: Brodmann areas Connectivity Brain oscillations Delta Gamma Alpha Theta 1. Introduction
1.1. The problem and the line of attack:“Why should the Brodmann concept be extended?”
Developments in neuroscience since the beginning of the 20th century must be considered when extending or changing Brodmann's concept or“reshaped Brodmann areas.” Ramón y Cajal established the most important concept with his“neuron doctrine.” Based on his measurements, Ramón y Cajal proposed that the brain is composed of functional elements known as“neurons.” It is clear that Brodmann's analyses of functional brain areas led to the neuron doctrine. This also indicates that the brain is not a“syncytium”; instead, it has several substructures or compartments that perform various functions.
The acronym CLAIR briefly denotes frequency/coherence diagrams, including data obtained from measurements offiltered frequency re-sponses, that is, spectral coherences distributed at the scalp electrodes. Moreover, these diagrams include a time scale for indicating delays in the time frequency responses. Thus, the acronym CLAIR is an abbrevia-tion of the following words: cortical coherence, links, associating, integrating, and responsive areas.
Several associated networks are present in the brain; however, they are not strictly activated by all types of stimuli: the coherence values depend on the modality of stimulation, cognitive load, and location of electrodes.
The CLAIR model does not aim to provide a precise location, unlike the LORETA model. Rather, this model combines the activation of all electroencephalography (EEG) frequency channels, thus clearly indicating that the maximal values of alpha, delta, or gamma frequency responses are not necessarily located at electrodes of the same frequency. This is further explained using Luria's concept inSection 3.
In this study, we evaluate conventional spectral coherence and not the Granger causality. The CLAIR diagrams are designed in a simple manner by obtaining the maximal information. In future, extensions for causality or directions can be carried out for richer formation. Similarly, our next extension will briefly include the phase-locking values obtained from the intertrial coherence (ITC) plots described inSection 10.
The effect of maximal response localizations can be made more visible by increasing the number of scalp electrodes up to 64.
Hans Berger invented EEG for determining a variety of brain func-tions, which greatly advanced thefield of neuroscience between 1930 and 1960. However, in the 1960s, most neuroscientists claimed that EEG was composed of merely noise, and that the alpha activity repre-sented the“idling of the brain.” However, Cajal's neuron doctrine was an important contribution to the literature of neuroscience in the 20th century. Throughout the 20th century, the concept of integrative brain function was developed. According to Sherrington, one cardinal neuron can be responsible for the integrative function of the brain. It is worth noting that Sherrington excluded the cognitive processes and cerebel-lum in his book. Thus, his use of the term“integrative” is misleading when describing this model (Sherrington, 1948).
In the middle of the 20th century, two important concepts were developed.“The organization of behavior as neuropsychologic theory”
⁎ Corresponding author.
E-mail address:[email protected](E. Başar).
http://dx.doi.org/10.1016/j.ijpsycho.2015.02.018
0167-8760/© 2016 The Authors. Published by Elsevier B.V. This is an open access article under the CC BY license (http://creativecommons.org/licenses/by/4.0/).
Contents lists available atScienceDirect
International Journal of Psychophysiology
was introduced byHebb (1949). According to Hebb, neurons are responsible for providing connectivity and in turn a pathway, such that learning creates new, larger neural ensembles.Hayek (1952)also proposed an important concept: the brain does not react in the same manner over time. This is a highly interesting concept of the dynamic organization of the brain.
In the 1960s at Massachusetts Institute of Technology (MIT), Norbert Wiener, John Barlow, and Marie Brazier used computers to analyze brain maps and display evoked potentials (EPs) more conveniently to analyze brain responses. This analysis improved upon the preliminary study byDawson (1954). In 1964, in addition to analyzing sensory EPs,Sutton et al. (1965)recorded event-related responses. A cognitive load was elicited to generate sensory stimulations. Between 1970 and 1980, two laboratories made significant contributions in terms of exper-imental techniques and analyses of oscillations. In his concept of gamma activity,Freeman (1975)proposed that gamma oscillatory activity in neural ensembles plays a pivotal role in the dynamics of brain function. Başar et al. (1975a, 1975b, 1975c)andBaşar (1980)also proposed that EEG oscillations are the most important signals of the central nervous system.Başar (1980)emphasized that all EEG oscillations (alpha, beta, gamma, theta, and delta) are essentially manifestations of brain functions (see alsoBaşar-Eroğlu et al., 1991; Schürmann et al., 1997; Sakowitz et al., 2001; Başar-Eroğlu et al., 1993, 2001). Furthermore, alpha activity does not represent the idling of the brain but, most impor-tantly, the integration of brain functions, including memory.
Roy John proposed another important integrative concept of the “hyperneuron,” a neural population that acts as a giant neuron during functional processing. Further,Fuster (2013)developed the concept of “cognit.” In both of these cases (cognit and hyperneuron), neural ensembles can be essential to the performance of brain function. In 1999, Başar proposed that multiple oscillations constitute a physiologic behavior and the most important building blocks of brain functions. However, activation of several oscillations distributed across the brain is not sufficient for explaining its function. Event-related connectivity (coherences) must be analyzed to describe brain functions physiologi-cally. Recently, the“CLAIR” model was proposed as a reevaluation of such concepts as the superposition of oscillations, spectral connectivity, hyperneurons, and cognitive concepts (Başar et al., 2014).
Put simply, J. Fuster and Roy John made significant contributions to the field of neuroscience. Drawing on the neuron doctrine, they concluded that“not single neurons” but a population of neurons are responsible for performing or initiating brain functions. In our opinion, this is an important step away from Sherrington's concept of integrative brain function, in addition to modifying Brodmann's concept, which is not a dynamic functioning system. However, neither of the two theories consider the possibility of multiple EEG oscillations as “building blocks of functioning”. Extending these concepts more broadly,Başar (2011)emphasized the significance ofFessard's (1961)claim: in the brain, some general transfer functions are present, which govern all mechanisms of the brain.1After considering that the EEG oscillations
discovered by Hans Berger are not noise (Başar, 1980), the concept of the hyperneuron and cognits (Roy John, Joaquin M. Fuster), and all papers published in this volume, it seems that the concept of“Brodmann Areas” needs to be extended or reshaped.
2. Critical reviews of Brodmann's concept
Since the beginning of the 20th century, the functional mapping of the brain has been represented by the“Brodmann areas.” Several methods are available to understand brain function, particularly to determine the location of diverse functions, such as memory and cognitive functions. Furthermore, primitive perceptions of, say, a simple light or simple tone require the functioning of“iconic memory” and “echoic memory.” Several
methods and strategies have been proposed to detect and define cortical areas responsible for all types of brain functions.
2.1. History of Brodmann areas
Brodmann areas were originally defined and numbered by the German anatomist Korbinian Brodmann based on the cytoarchitectural organization of neurons. With several otherfindings and observations on the general cell types and laminar organization of the mammalian cortex, Brodmann published his maps of the cortical areas in humans, monkeys, and other species in 1909. A more detailed cortical map was published byvon Economo and Koskinas (1925).
Many Brodmann areas are closely associated with diverse cortical functions. For example, Brodmann areas control several sensory and motor functions. The higher-order functions of the associated cortical areas are also consistently localized to the same Brodmann areas by neurophysiological, functional imaging, and other methods. Functional imaging determines only the approximate localization of brain activations in terms of Brodmann areas, as their actual boundaries in any individual brain must be examined histologically.
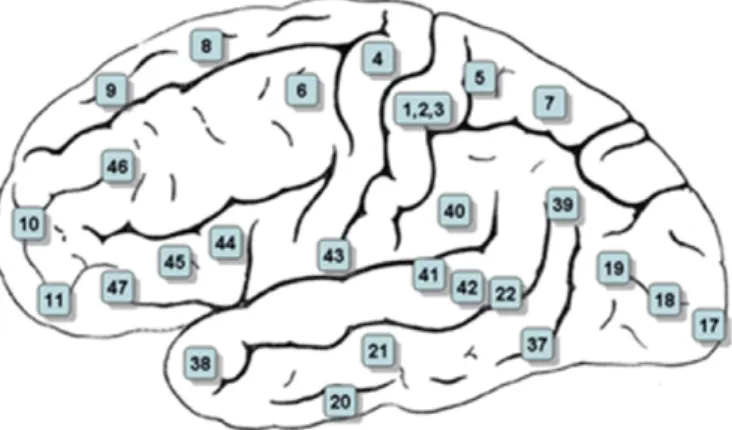
For nearly a century, Brodmann areas have been discussed, debated, refined, and renamed exhaustively, and they continue to be studied and cited frequently in the cytoarchitectural organization of the human cortex (SeeFig. 1;Brodmann, 1909).
According to the reports in this special issue and other publications on the functional correlates of oscillations, new parameters and concepts are required to describe brain function. That the brain is a dynamic system in-dicates that its different functional units are“time varying.” In other words, electrical changes in all areas of the brain must be observed and re-corded. Further, many types of connections between all the structures have been described in the Broadmann areas. These connections are de-fined as “axons,” “synapses,” etc. Moreover, the connectivity between dif-ferent parts of the brain is subject to change when neurotransmitters are released. Recently,Başar (in review, 2011)described all of these proper-ties of the brain as“the whole brain work.”.Varela et al. (2001)also de-scribed long-distance connectivity in the brain.Başar et al. (1979a, 1979b),Başar et al. (1998), andBaşar (1980)described long-distance spectral connectivity in alpha, beta, delta, and theta waves in the cat brain. The most important fundamental idea of this study is the following: Luria (1966)states that there are no definitive anatomical locations for brain functions. Cognitive functions are also the products of complex subnetworks distributed across the brain. Accordingly, psychophysiology should not localize the“centers” but rather identify the components of various complex systems that interact to perform mental functions. According to Luria, this task is“dynamic localization.” Cognitive functions are not localized in any of the component structures, but between them. They are virtual entities, much like the cognitive system as a whole (Solms and Turnbull, 2002).
1
Are they most general transfer functions that govern connection of signals in the brain (Fessard, 1961).
Fig. 1. The numbers labeled in several cortical locations are assigned to functional correlates of these locations.
Based on the currentfindings in neuroscience, whole brain function must be elucidated by analyzing the spectral coherences, that is, the in-creased functional connectivity between structures upon cognitive load, together with the enhanced temporal oscillatory responses. In addition to Luria's view, the Brodmann areas can be extended to a more dynamic presentation, in which the sensory and cognitive areas are described as superposition of multiple parameters.
Based on thesefindings and Luria's concept, we propose that all sensory-cognitive paradigms (as in the cognitive load P300 oddball paradigm) must be analyzed in terms of oscillatory responses and event-related coherences. This can open up new avenues for describing whole cortex organization.
3. Interim summary of emphasized concepts
Based on the facts described in the previous section, we tentatively assume that the functional mapping of the brain must be presented in terms of the dynamic functional areas in the brain. For this purpose, several new measurements and concepts must be considered:
1. Superposition of the oscillations (alpha, beta, gamma, delta, and theta) 2. Luria's concept
3. Coherence in space (spatial connectivity) 4. Coherence in time (phase locking)
5. Differentiation of sensory and cognitive tasks by consecutive application of simple and cognitive stimulations.
6. Change of these results in disease conditions and following drug application.
The major features of brain oscillatory responses are fundamental to describing the new extended types of Brodmann areas. Therefore, we present a summary of these features in the following sections. 4. Oscillatory responses in the brain2
1. The intrinsic oscillatory activity of single neurons is fundamental to the natural frequencies of neural assemblies. The oscillatory activity of the neural assemblies in the brain consists of the alpha, beta, gamma, theta, and delta frequencies. These are natural frequencies, thus representing the real responses of the brain (Başar, 1972; Başar and Ungan, 1973; Başar et al., 2001a, 2001b, 2001c).
2. The oscillatory neural activity is found to be of functional signi fi-cance, based on the analysis of responses to well-defined events (event-related oscillation (ERO) that is phase- or time-locked to a senso-ry or cognitive event). Among other approaches, such oscillations can be investigated by frequency domain analysis of event-related po-tential (ERP), based on tentative hypothesis and rules outlined by Başar (2013), as well as in this study:
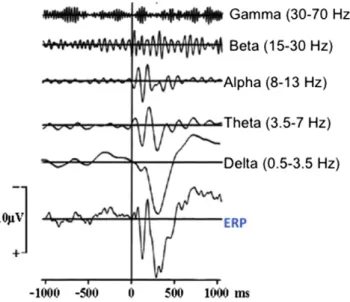
“The EEG consists of the activity of an ensemble of generators producing rhythmic activity in several frequency ranges. These oscillators are usu-ally active in a random way. However, by application of sensory stimu-lation these generators are coupled and act together in a coherent way. This synchronization and enhancement of EEG activity gives rise to‘evoked’ or ‘induced’” rhythms. “Evoked potentials, representing ensembles of neural population responses, were considered to be a re-sult of the transition from a disordered to an ordered state. The com-pound ERP manifests a superposition of evoked oscillations in the EEG frequencies, ranging from delta to gamma (‘natural frequencies of the brain’ such as delta: 0.5–3.5 Hz, theta: 3.5–7 Hz, alpha: 8–13 Hz, beta 15–28 Hz, and gamma: 30–70 Hz).” See publications byBaşar, 1980; Yordanova and Kolev, 1998; Klimesch et al., 1997; see the reports ofBaşar and Bullock, 1992; Gurtubay et al., 2004; Buszaky, 2006.
3. Oscillatory neural tissues that are selectively distributed in the whole brain are activated upon sensory-cognitive input. The oscillatory activity of neural tissues may be described using several response parameters. As different tasks and the corresponding functions are represented by different configurations of parameters, the same fre-quency range is used in the brain to perform not just one but multiple functions. The response parameters of the oscillatory activity are as follows: enhancement (amplitude), delay (latency), blocking or desynchronization, phase locking, phase changes, prolongation (duration), degree of coherence between different oscillations, and degree of entropy (Başar, 1998, 1999, 2004; Kocsis et al., 2001; Miltner et al., 1999; Pfurtscheller, 1997, 2001; Pfurtscheller et al., 1999, 2006; Neuper and Pfurtscheller, 1998a, 1998b; Rosso et al., 2001, 2002; Schürmann et al., 2000).
4. Each function is represented in the brain by the superposition of the oscillations in various frequency ranges. The values of the oscillations vary across a number of response parameters. The comparative po-larity and phase angle of different oscillations are decisive in produc-ing function-specific configurations. Neuronal assemblies do not obey the all-or-none rule that the single neurons obey (Chen and Herrmann, 2001; Karakaş et al., 2000a, 2000b; Klimesch et al., 2000a, 2000b).
5. The temporal coherence between cells in cortical columns plays a role in the simple binding mechanism (Eckhorn et al., 1988; Gray and Singer, 1989). Varying degrees of spatial coherence occur over long distances as parallel processing (Başar, 1980; Miltner et al., 1999; Schürmann et al., 2000; Kocsis et al., 2001).
5. EEG and EROs as a brain alphabet
5.1. The integrative character of the compound potential EP
The reports of the present special issue describe the selective distribution of oscillatory generators. Some of these reports use several strategies to demonstrate the superposition principle. These important strategies have shown that induction, evocation, and stimulation can alter the EROs.
These include the following strategies:
1. Changing the position of the electrode configuration 2. Pathological lesions
3. Using pharmacological agents
4. Reducing or altering the intensity of stimulation, or using several stimulation paradigms
5. Increasing the level of cognitive input 6. Comparing with recordings in single units 7. Changing to a cognitive input
5.2. The compound potential P300
In this section, we describe the oddball P300 potential to demon-strate the use of a new type of nomenclature based on EPs, which are assumed to be superpositions of several oscillations:
1. Compared to sensory EPs, the major change in the P300 response in-cludes a significant increase in the delta response distributed over all locations of the skull. The delta response is the predominant response to rare stimuli, which occurs with considerable latency. 2. The P300 response is also found to have an increased theta
compo-nent, particularly in the parietal and frontal locations in a time win-dow of approximately 300 ms, following the rare stimulus. In other words, theta-wave packets do not increase immediately, but they are delayed, thus contributing to the late component of P300, which is characteristic of this response.
3. In the alpha frequency range, no increase in the 10-Hz oscillation is seen, although this oscillation is prolonged. The typical sensory 2
TheSection 4is significantly modified from Başar “Theory of the whole brain work” :
component, which we term as "adequate 10-Hz enhancement," re-quires a longer reaction time.
4. The compound potential P300 also shows a significant change in the 40-Hz frequency band 300 ms following stimulation, as well as a significant increase in the 40-Hz oscillation.
Thesefindings indicate several functional correlates, two of which are as follows:
1. The analyses offiltering techniques show that the 2-, 4-, 10-, and 40-Hz wave packets can react independently and move around the time axis without any interrelation. However, all of these wave packets undergo superposition close to 300 ms following the stimulation. From the functional standpoint, the delta increases superimposed with a theta increase upon stimulation (Başar, 1999). This experiment is designed such that the experimenter can operate with these wave packets to relate them to the defined functions, for example, attention.
2. The compound potential P300 indicates that in the case of several functions, such as surprise, decision making, focused attention, short-time memory, and learning, the analyses of single frequency components are not solely important. Instead all of these components
must be combined to judge the function contained in such a com-pound potential.
We highlighted the effect of learning during the recording of such P300 potentials: At the beginning of an experiment, the subjects are not yet comfortable with the cognitive task. However, once they learn to differentiate the rare tones (target tones) from the frequent tones (nontarget tones), then theta response waves are observed after ap-proximately 300 ms following the stimulation, as generally analyzed for the P300 potential.
5.3. Brain codes: brain alphabet EEG ?
Başar (1999)attempted to determine whether EEG signals represent neural codes related to CNS functions. In the previous chapters, the treatment of EEG codes and EPs as coding signals is explained in detail. In the following sections, we expand on the speculations put forward by Başar and Bullock (1989).
Three different brain structures or networks, A, B, and C, are consid-ered, with excitabilities in the four frequency ranges of 4, 10, 20, and 40 Hz, which are referred to as theta, alpha, beta, and gamma in this study. Structure A is assumed to be excited and excite structure B, which in turn can excite structure C. When structure A excites structure B, signals will be transmitted in one of these frequency channels from structure A to structure B. Furthermore, structure B, if not already excited in a different frequency, will then excite structure C in the same frequency range (seeFig. 3).
We also denote the specific resonant modes as “passletters”, because a brain structure entering the 10-Hz frequency range of the activity will, by the rule of excitability, resonate in that range. In this case, the passletter is excitable at 10 Hz, the second at 20 Hz, and the third at 40 Hz. The term "password" or "pass characteristic" was previously used byBarlow (1961), who proposed a theory of passwords and pass characteristics in neural networks. Our theory is somewhat different from Barlow's, although we use his expressions.
According to empirical results, theta, alpha, beta, and gamma reso-nances do occur in the brain. Thus, we can suppose that the passletters represent resonant modes that help optimize the transfer of signals between various brain structures (seeFig. 2).
Further, we speculate that the passwords alpha, beta, gamma, and theta represent resonant modes that are almost invariant. However, passletters may be combined during signal transfer through various brain networks to create several less elementary or complex combina-tions, which we may call passwords. For example, in structures A, B, and
Fig. 3. Schematic explanation of passletters.
(FromBaşar (1988)in: Başar E., ed. Dynamics of Sensory and Cognitive Processing by the Brain. Berlin, Heidelberg, New York: Springer). Fig. 2. Decomposition of the oddball P300 response into frequency bands.
C, either alpha transmission alone or a combination of alpha and beta (passwordsα and β) can occur. An even more complicated password would be alpha–beta–gamma (α, β, and γ), etc. Note that these passletters may constitute an alphabet (Fig. 4).
The information capacity of a structure can be crucial, especially when busy. This is because if the information capacity of structure B is limited, or if structure B is busy at the time, the transmission in one of these special channels will not be optimal. In turn, this may lead to the creation of an ensemble of passwords for complex sensory-cognitive inputs and other heterogeneous messages, using reverbera-tions of passwords, possibly via excitation. How might such auto-excitation occur? One possible mechanism may involve structure A exciting structure B again, as in limbic system networks, for example. In this case, C could start to reverberate due to B. Such a reverberation would be possible only if all of the structures were capable of resonating in the same frequency channel.
5.4. Cognits
Recently,Fuster (2013)published a book describing the structure of cognits and the anatomy of cognition. He claims that our several cortices respond extensively to information about ourselves and our surround-ings. According to Fuster,“cognitive information acquired and stored in a web of distributed, intermeshed, and overlapping networks.” He termed these units as cognits, which represent units of knowledge– memory with addressable content. They are formed by life experience in the cortex of association on a foundation of phyletic memory. Life ex-perience produces these cognit networks, which constitute structural patterns of association between neurons, representing the more ele-mentary aspects of perception and action. The richness of the cortices and cognitive content are not present at the given locations or struc-tures as neurons or cell ensembles, for storing information similar to a new computer. Rather, this richness is relayed as a cognitive code, which is a relation code and the only cortical code covered. The cortical codes are used to mention“area codes” in the whole brain and not only in the cortex.
Further, Fuster states that richness is based on connections and connective potentials. This parallels our discussions on oscillations as a “letter of the alphabet.” In the previous section, we used the principle of superposition to link several subfunctions. We also introduced the
connectivity between areas through coherence functions. The coher-ence function has several subcomponents at different EEG frequency os-cillations. The philosophy supporting the brain alphabet is also possibly an economical ability of the brain itself or its substructures. The alphabet has a limited number of characters, which when combined with each other and with poses, spaces, and punctuations can give rise to an in fin-itive variety of linguistic pauses and expressions in multiple languages. Thus, the CLAIR model and the oscillations can be extended to an infinitive variety of brain functions. In other words, the existing Brodmann areas will be replaced by CLAIR configurations (or modules), which can offer rich functionality of the brain and even the whole body. In a previous study, we explained the presence of alpha and theta oscillations in the cardiovascular system (Başar, 2011).
5.5. Toward realizing the CLAIR model
In this section, we assign the role of letters to natural EEG frequencies. We aim to create different types of“passwords.” However, as indicated by the experimental results, the response frequencies are not always at the same position on the time scale following a stimulation. These include immediately occurring“alpha oscillations” or “delayed alpha” oscillation, as well as delayed theta and delta activities. The phase-locked frequency response and prolongation of oscillations must also be considered charac-teristic of passwords, as must both the frequency and the sequential repetition of oscillations. The amplitude of the responses and the weighting of amplitudes of different EEG codes also contribute to the for-mation of passwords. Illustrative examples are presented in the CLAIR model (seeFig. 6A and B).
5.6. EEG: manifestation of episodes
When we see our past picture, we recollect the memory and imagine the actions embedded in this picture. This picture can be a photo or a given panorama. We recollect not only the buildings, trees, or objects represented in this photo, but also the environment when the photo was taken, for example, we can recollect the voice of a person present at that time. This indicates the involvement of not only the occipital (visual cortex) but also frontal cortices and all association areas, including the temporal cortices (auditory areas). Possible large conglomerations are built instead of primary Brodmann areas that are limited in function (as
Fig. 4. From passletters to passwords.
defined). This assembly of several units is also dynamically connected. The spatial coherence exists in a continuously moving space. We term this construct as“CLAIR areas.” The reader is referred to the concept of hypermemory by Başar and Düzgün, 2016b–in this volume) for comparison.
Fuster's concept,“cognit,” has a connective property. Fuster's cognits overlap and intersect extensively, building nodes of association formed by a neuronal assembly. Further,Fuster (2013)posits that the perception cognits are organized in the posterior cortex and the executive cognits in the frontal cortex. These two types of populations are interlinked at all levels by reciprocal connections. The concept“cognits” is useful and inten-sive; however, reticular formation, which plays a major role in controlling cortical areas, is not mentioned in the model proposed by Fuster. Further-more, the cerebellar cortex is not mentioned in the system. In addition, all executive functions and memory are steadily controlled by the lum. The CLAIR model ensembles should also include links to the cerebel-lum. This fact was also not mentioned in the Brodmann model. 6. First steps to modify and extend the concept of Brodmann areas
In the introductory parts of this study, we explained four fundamen-tal issues to localize centers directly related to the given functions. If we combine the fundamental aspects together, we could conclude that the current description of Brodmann areas needs a complete revision. First, in most of the cases, these cortical areas are activated after being stimu-lated. For a simple light stimulation, several primary cortical areas also respond. However, when the complexity of the stimulating signal is in-creased, the situation becomes completely different. Not only do prima-ry but also secondaprima-ry sensoprima-ry areas respond together with increased oscillatory responses. However, in this case, the parietal and frontal areas are activated together. In addition, the brain also induces dynamic reverberations in a number of stimulation modalities (Fig. 5). The rever-berations in neural networks are explained byFessard (1961).
Further, a cognitive task evokes an increased number of sensory and cognitive areas in the brain. Accordingly, the sensory-cognitive respon-siveness in the brain processes with more than two or three areas to be considered in the“CLAIR” model.
The functional areas evoked upon sensory-cognitive stimulation are not only activated serially, but also parallel activation of higher-oscillation areas in the brain is present at the same moment of activation of primary sensory cortical areas. This phenomenon is known as“coherence in time,” which differs from coherency in space due to axonal transfer between related centers.
According to the schematic of neuroanatomic description presented inFig. 5, the neural activity of a given center does not always occur at the same time. On the contrary, we will observe parallel responsiveness in several structures at different centers.
In fact, there are several frequencies in the range of alpha, beta, gamma, and theta waves. Frequency sensitivity is not the same in all centers activated by several existing pathways (Fig. 5).
As stated earlier, it is fundamental not to indicate a frozen position during activation of functional processing in the brain. In everyday life, healthy individuals do not continuously receive the same type of infor-mation. Accordingly, functional areas will be continuously altered de-pending upon modulating stimulation and accompanying a cognitive task. Therefore, the problem of localization is extremely difficult or almost impossible, requires several parameters, and creates heteroge-neous interpretations.
We try to schematically illustrate this type of processing and provide concrete examples in the following section.
7. Dynamic organization of cortical function
In view of the previous section, we assume that a rigid and definitive or precise cortical functional mapping is almost impossible. There are several reasons for this:
According to Luria, there are no definitive centers for functional localization, because of the dynamic structure of the brain. Further, neu-roscientists have learned the importance of Hebb concepts:Hebb (1951)andHayek (1952). According to Hebb, learning processes open new pathways in the brain. In addition, the synaptic organization of the brain continuously changes.Hayek (1952)also emphasizes that the functional processing of the brain after occurrence of a new event will not be the same for repeating the experiment. In spite of this, we attempt to explain the method of describing a cortical dynamic organi-zation of behavior. A simplified form of explaining this organization is presented inFig. 5.
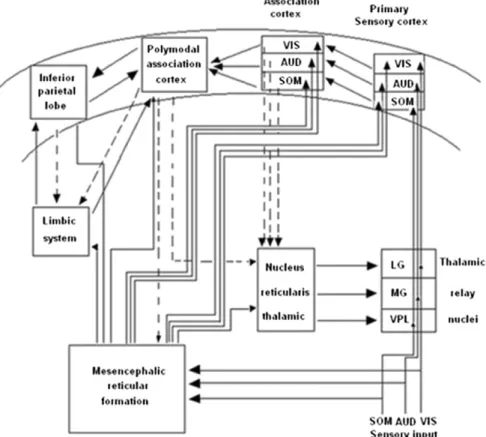
In order to define sensations and perceptions to different processing Gibson (1966)proposed a“direct” theory of perception, which is a bottom-up theory. On the contrary,Gregory (1970)proposed a con-structive undirected theory of perception known as“top-down” theory. Fig. 5is a tentative presentation of neuronal networks to explain bottom-up and top-down processing. Sensations are elicited in the peripheral organs of the body, such as eyes, ears, and skin receptors. If we track visual information, the electrical impulses that are elicited in retina reach the occipital cortex (visual cortex) through the visual path-way. These signals from the retina reach the visual cortex over thalamus (LG). This is a simple bottom-up processing. In reality, the individuals' cell receives pure sensory signals by light stimulation. In general, more complex visual patterns containing elements from the history of indi-viduals are presented inFig. 5. Thefigure also shows connections from the reticular formation and connections to the limbic system. Further, there are links from the visual cortex to other related areas of the brain. In the top-down processing, the signalflow in the brain reaches several neurons. This is a more complex signal processing, which usually ends in no predictable areas of the brain, and therefore shows uncertain reactions (Fessard, 1961).
8. Concepts of“hyperneuron” and “cognit”
Fig. 6provides extremely useful information for defining the dynamic nature of the CLAIR concept. During the sensory or cognitive processing of the brain, degree of activation in different areas of the cortex is continu-ously modified. Primary sensory cortex, all types of related cortices, parietal lobes, and other parts in parallel to this limbic system are in a reverberating process. In other words, after completion of a function, the activated neural groups perpetually change. The result is similar to the formation of a giant neuron group, which is composed of several subnetworks. For example, during an attention process, the volume and shape of this complex neural network change. In order to explain this concept,John (1988)proposed a module that fairly describes a similar construct in the brain,“the hyperneuron.” However, Roy John did not de-scribe a more analytical construct, including connectivity between some groups, and use the concept of multiple oscillations. Similar to Roy John, Joaquin M. Fuster proposed cognits, which are unitary cognitive elements responsible for cognitive organization of the brain.
9. Detailed description of CLAIR areas
Fig. 6A is afirst step globally illustrating “dynamic organization of functionality,” andFig. 6B is limited to frontal, parietal, and occipital areas, and does not present the exact locations in the brain. Further-more, thefigure presents an intermediate explanation of the method. Greek letters have been used to represent diverse oscillations. Accord-ing to the literature, a simple sensory stimulation (a simple light in this study) triggers a fewer number of different frequency oscillations than that with a cognitive task. In the frontal areas, the alpha amplitude and gamma amplitudes are smaller, and theta oscillation and delta os-cillations are detected upon a simple light stimulation. On the contrary, in the occipital cortex, the early alpha response has a larger gamma re-sponse than the frontal rere-sponses. Delta and theta oscillatory rere-sponses are no different to frontal reactions. Beta responses are also longer than
frontal oscillations in parietal areas upon simple stimulation. The parie-tal alpha amplitudes are much higher than fronparie-tal responses; however, the alpha amplitude is comparable to the occipital one. Further, recent studies have shown that parietal gamma is less ample in comparison to the frontal and occipital responses. In thefigure, the dashed and bold lines indicate coherence valuesb0.5 and N0.5, respectively.
Initially, we use only three locations presented by rectangular areas inFig. 6A, which shows a mapping of evoked oscillations. In thefigure, dark red compartments in the occipital areas correspond to a large alpha response, whereas light red counterparts represent alpha
response in the frontal area. Similarly, delta activity is represented by yellow and gamma activity by dark and light blue areas. The partially presented parietal area is not explained in detail. Also in thisfigure, we only indicate the late delta response to target stimulations. This mapping is more important when EROs are considered. In thisfigure, the large alpha responses are represented by dark red areas, theta by green-yellow, and delta responses by dark yellow areas. It is also impor-tant to note that the high coherences are represented by bold lines. Ac-cording toFig. 6, in parietal areas, delta responses have high intensity, whereas gamma responses have low intensity.
Fig. 5. Flow of information in the auditory, somatosensory and visual pathways, reticular formation, limbic system and association areas of the cortex. (Sensory and cognitive neural pathways in thisfigure are modified from (Flohr, 1991) Theory and Psychology 1: 245-262).
Fig. 6. A and B.The presentation of CLAIR areas upon stimulation with simple light and stimulation of visual target signals. In this illustration, the colored areas represent different oscillations from alpha to gamma. Here only three locations are presented: F4, P4, 0Z. Fig. (A) is the response to simple light, Fig. (B) the target responses.
10. More information on CLAIR model: comparison of EP and ERO maps
Several studies have been conducted on the analyses of P300 oddball ERPs in the frequency domain (Başar-Eroğlu et al., 1992; Karakaş et al., 2000a, 2000b; Schürmann et al., 1995). Comparison of the targets shows that in all locations, delta responses are considerably increased due to the application of a visual memory task, and gamma responses are also increased, particularly in frontal and late locations at the time-scale. Two different theta and delta windows are observed, and the “prolongation of oscillations” or “late second window” with a huge oscillatory response in the time domain at approximately 400 ms is merely considered. The spatial connectivity upon a cognitive task is increased in alpha, theta, and delta oscillations. Upon a simple light stimulation, the connectivity between these oscillations becomes weaker (Zb 0.5). This indicates that the coherence upon application of a cognitive task is much higher than the stimulation upon simple visual stimulation.
Fig. 6explains a type of Gedanken model of oscillatory changes to show the activation of oscillatory networks upon two types of stimuli.
EP plane inFig. 6A is an obscure explanation of the simple sensory evoked stimulation (light stimulation) for the frontal, parietal, and occipital areas of the cortex, whose locations are not exactly shown. In addition, the surfaces of these areas are not presented with exact boundaries. Precisely, these illustrations are global ones. The Greek let-ters represent different oscillatory responses, and their sizes somewhat manifest the amplitudes of such responses.
We have emphasized the importance of spatial connections analyzed by coherence functions in several other studies. These are il-lustrated by dashed and thick lines between three different structures inFig. 6, which represent the degrees of connectivity. The following are the differences between the three types of illustrations. In the frontal cortex, theta and delta activities are higher, the letter theta, gamma activity is also large.
The delta response around 400 ms is much higher in the occipital evoked response than that inFig. 6A. In the parietal response in Fig. 6B, the late delta response is also high. In the illustration of these figures, it is not yet possible to apply the exact magnitude to the Greek letters representing amplitudes of responses. Later, it may be possible to provide a more exact mapping by using different color
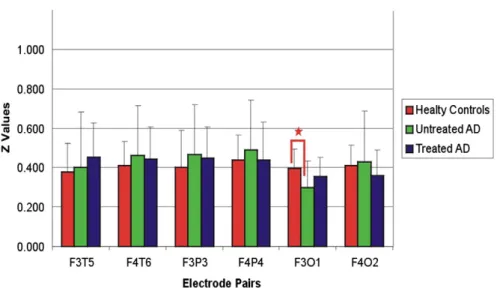
Fig. 7. Mean Z values of healthy control, treated AD and untreated AD subjects for delta frequency range upon simple light stimuli.“*” sign represents p b 0.01.
codes for oscillatory activities, and by considering the variation of amplitudes, it may also be described with a varying intensity of colors. The strength of spatial coherences inFig. 6A and B is justified in Figs. 7 and 8, respectively (connectivities will be explained below).
Gamma responses of patients affected by Alzheimer's disease are re-lated inFigs. 7 and 8. We will try to provide a more exact presentation. InFig. 6A, we represent weaker coherences in areas between Zb 4 and 2 by dashed lines. On the contrary, thick lines represent the areas be-tween Z = 4 and 2, and delta response coherence represents event-related responses. In thisfigure, thick lines represent coherences for Z values up to 1. For description ofFig. 6A and B, we used the information included inFigs. 7 and 8.
10.1. Is the addition of ITC necessary and possible to CLAIR model Further, we considerFig. 9A and B, which illustrate ITCs upon visual and event-related interatrial coherences, respectively. In thisfigure, only frequenciesN25 Hz are presented. It can be observed that late responses are more abundant in a target stimulation (event-related
response coherence) by designing a new type of EROs. ITCs in thefine structure of the gamma band should also be considered.
11. Highlights of the CLAIR concept in comparison to Brodmann areas: an interim summary
1. Sensory evoked oscillations and EROs: these responses are compo-nents of the EPs in multiple frequency ranges. The illustrations of Fig. 6A and B show that EROs contain a significant amount of informa-tion, and the number and amplitudes of oscillatory responses are higher upon addition of a cognitive load. It is easy to decipher that cognitive load sets the brain in a more active state than simple light. Furthermore, delta responses are changed in size, and during this timescale, the late theta response at approximately 300–400 ms has a very large amplitude in comparison to the sensory evoked oscilla-tions. In addition, the theta rhythm has a late window at approximate-ly 400 ms. Gamma responses also have larger amplitudes, and a number of late oscillations at 400, 600, and 800 ms are seen regularly in EROs.
2. Conventional Brodmann areas are highly useful for expanding the knowledge on functionality of the brain areas; however, an impor-tant drawback is that these areas cannot work alone (unconnected) during the real dynamic functioning of the brain. Frontal areas alone cannot contribute to vision of a specific subject (e.g., a face without cross talk with the occipital or parietal areas) to distinguish an angry face from a happy face (limbic system and frontal cortex) and possibly many other areas (amygdala). A collective action and increased information processing are needed. In other words, stimu-lation of the brain with complex pictures or complex sounds elicits a link between multiple centers transferring mutual information. 3. The spatial coherences between brain centers are highly increased by
processing of complex pictures, sounds, or other phenomena during which thinking processing is intensified. This is the difference of this type of presentation from earlier frequency mappings and Brodmann presentation.
4. The Brodmann concept does not consider the connectivity between different centers. In the usual brain mapping, which also includes oscillatory processes, the degree of activation is considered, but not
the connectivity. Further, in the conventional brain mapping, for ex-ample, by the frequency mapping, superposition effects are usually masked. The superposition of several frequency bands of oscillations is a major concept.
12. Studies of medication and neurotransmitters
In our early publications, we described the influence of neurotrans-mitters on oscillatory processes. We also started to describe possible biomarkers and related neurotransmitters in several neuropsychiatric disorders. As we stated earlier, the neurotransmitters highly modify the frequency of oscillations, their amplitudes, and phase-locking strength (Figs. 9 and 10) (Başar and Düzgün, 2016a–in this volume).
Neurotransmitter agents are often used as medications for certain diseases. Furthermore, the applicability of the CLAIR model in clinical studies and application of medication are described. Although we are not able to illustrate completely the CLAIR areas in diseases, we can in-dicate new steps to illustrate pathological changes. Currently, we can provide only limited maps to open the way for future CLAIR maps for
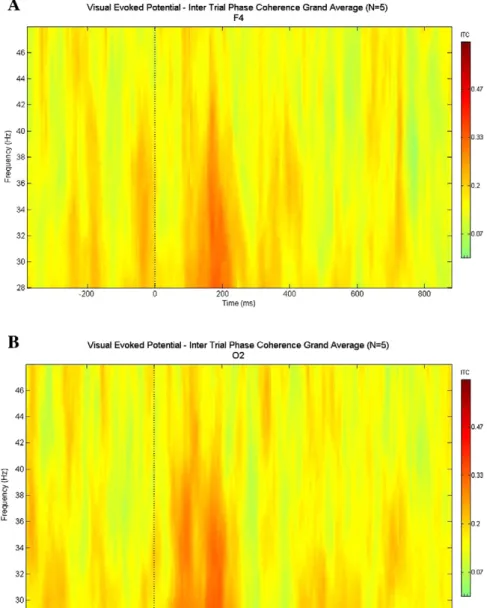
Fig. 10. A and B. The grand average plots of intertrial phase coherence upon cognitive target stimulation as grand average of 5 subjects. Modified fromBaşar, 2012.Figs. 10A and B show the intertrial coherence upon presentation of target stimulation for F4 and O2 locations.
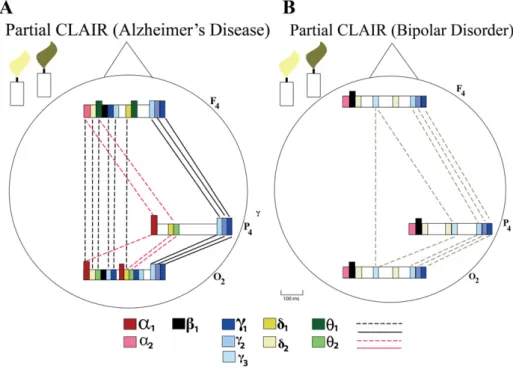
presentation of diseases. These types of unfinished maps could be termed“partial CLAIR maps.” We illustrate in the following such partial CLAIR maps for Alzheimer's disease and bipolar disorder (BD). Such pathological CLAIR maps could be used in the future for describing the pathology as a complex marker and evaluating the effect of medication. 13. Application in neuropsychiatry
The description of CLAIR areas is primarily aimed to manifest func-tionality of the brain in general as manifested in neural oscillations. The development of function does not only depend on frequency differ-entiation of the activation in several areas of the brain, but also on con-nectivity. The focus is now shifted to the determination of the modification of brain function in disease.
The following questions are generally posed. Is the event-related ac-tivation of oscillatory processes high or reduced? Are there differential changes of oscillatory activity upon different types of stimulation? Furthermore, is a“connectivity deficit” or a partial connectivity deficit between long-distance structures observed? Measurements and analy-ses in change of oscillations and coherence function were not measured in all types of possible diseases. In addition, studies performed by our research network are not sufficient to perform perfect CLAIR mappings in Alzheimer's disease and BD. Accordingly, in the following, we illustrate examples from Alzheimer's disease and BD only partially. In “partial CLAIR maps,” differences can be easily observed from healthy subjects. Initially, it is useful to show only a part of the cortex and limit-ed frequency windows.Fig. 11A explains the Alzheimer's CLAIR-Map. The examples clearly demonstrate these possibilities. For example, gamma coherences are highly increased in Alzheimer's disease.
Several modifications of EROs and event-related connectivity in Alzheimer's disease have been published (Yener and Başar, 2013a; Başar et al., 2010). The results show that by recording event-related os-cillations during a P300 oddball task, important changes in the target re-sponse occurred. One of the most important changes is the decrease of delta response upon target stimulation and the decrease of the ampli-tude in the delta response. Both these changes are recorded at approx-imately 400 ms upon target stimulation. Another important change is the drastic decrease of coherence in delta, theta, and alpha frequency ranges (Fig. 10A). Finally, we mention the important changes of the
coherence in the gamma frequency range. An analysis was performed in the 25–30, 30–35, and 38–48 Hz regions in gamma windows. The sit-uation here is very strange: in lower frequency bands up to 10 Hz, the connectivity is highly increased, whereas in all three gamma windows, the coherence is increased. The coherence function achieves Z≥ 1, which is a complex situation. It is yet not possible to discuss the causal-ity of increased gamma coherence in patients affected by Alzheimer's disease (seeBaşar et al., 2016–in this volume).
Fig. 11B shows a“partial CLAIR model” of BD patients, in which not all existing data related to BD are constructed. We only emphasize the drastic decrease of coherence in the gamma frequency window (Özerdem et al., 2008). The coherence function in the lower frequency band is not yet computed; however, it has been indicated that event-related alpha oscillations are highly diminished (Basar, 2010), and, on the contrary, beta responses are highly increased, afinding of the alpha event-related response that is worth discussing (seeBaşar et al., 2016–in this volume).
Thefirst global comparative analysis of “partial CLAIR maps” in Alzheimer's disease and BD clearly indicates that such comparative analysis of CLAIR maps could be developed as useful markers to distin-guish electrophysiologic properties in diseases. Such analysis could be also useful to observe“progression of diseases.”
InFig. 6, we observed that in more difficult processes involving cog-nition and memory, the links between long-distance areas are stronger than those in simple sensory processes. The coherence function is high, and reaches values up to Z = 1. On the contrary, upon simple stimula-tion, coherence values are low, andb0.5. The significance of these results is described in the following subsection.
13.1. The importance of the role of coherence in brain cognitive processes The term coherence refers to a pairwise measure of correlation and each coherence between two simultaneous EEG recordings.
According toBullock et al. (1995b), there seems to be a difference between biological species with virtually no synchrony at any frequency in sea slugs, Aplysia, even atb1 mm and for low frequencies.Bullock and Başar (1988)showed thatfish had a significant coherence at 1 or 2 mm, turtles and geckos a slightly higher value, and mammals displayed a even higher coherence.Bullock et al., 1990found that detecting EEGs
from the surface of the brain of a rabbit showed approximately 0.5 when the electrodes were about 3–5 mm apart.
Human subdural recordings show approximately double the afore-mentioned values, but the electrodes are quite different; accordingly, a meaningful comparison is not possible. Bullock emphasized that the dis-tance of 0.5 coherence varies for different pairs, places, and moments. The average is much higher in scalp recordings and smaller with intracortical microneedle recordings. All these features underline the mainfinding macrostructure and “varying dynamics in time and space.”
This can be described in the following:
In our measurements during the application of cognitive loads, that is, application of target signals of the oddball paradigm, we recorded long-distance and high-coherence functions between frontal and occip-ital pairs with a distance of approximately 20 cm. This value is found to be significantly higher than that of the fish brain or of lower vertebrates. Neural links between areas 17 and 10, or 46 (frontal areas) must be con-siderably high during cognitive processing, and particularly dynamic memory. Thesefindings lead to a general question: Does a functional presentation of Brodmann areas have relevant shortcomings?
The steps to reduce these shortcomings are as follows:
The links between various structures are defined and illustrated in the CLAIR model. Moreover, changes upon cognitive loads are differen-tiated by an indication of increased strong links (strong coherences). There are differences between the amplitudes of various frequency re-sponses. In addition, another aforementioned factor is very important. Responses to different types of stimulations occur in different time points, following event-related stimulations.Fig. 5 illustrates that there are many pathways in the brain from receptors (e.g., retina) to higher association areas as frontal cortex and limbic system. There are also“reverberations” between all these structures. None of these time-varying processes are reflected in Brodmann areas. According to the type of stimulation, or cognitive load, the links and the degree of electri-cal activation can completely change in all structures of the brain. In the future, the CLAIR areas should be extended to the dynamic changing pictures showing all these functional performances.
14. What can be the next steps to develop the CLAIR modules? In the examples inFig. 6, we described only three areas: O2, P4, and F4 for imaging of all or integrative brain functions. More detailed and distributed maps including at least 10 or 20 brain areas are needed. However, this is a difficult task, as it needs accumulation of more infor-mation in different oscillatory responses, connectivity, and timescale. Such presentations cannot be achieved by using classical printed illus-trations. A possible method would be presentations by using geographic type of maps, or with various scalings stored in a computer or Internet media. The information obtained from thefigure can be applied in larger structures of the cortex, which could be retrieved by changing the scale of the large map used.
15. Insufficiency of the present precision with the distant electrodes In the application of analysis of variance (ANOVA) statistics, often long-distance areas of the brain are analyzed together. This type of anal-yses should be applied with precaution. For example, in frontal areas, the gamma response to visual stimulation is low, whereas that in occip-ital areas is high. The ANOVA analyzed that the results in such cases are “nonsignificant.” The same situation is also observed in alpha responses: the frontal alpha responses to sensory stimulation are very low, where-as occipital alpha responses are very high. Therefore, for fundamental construction of such maps, we suggest the application of a narrow electrode configuration in small regions of interest, for example, five electrodes as arrays in occipital right areas. One must also apply a simi-lar array for the left occipital side, because there are often also important functional cortical asymmetries in different brain functions. We also
suggest to develop a map with sufficient information for the entire cortex (Fig. 12).
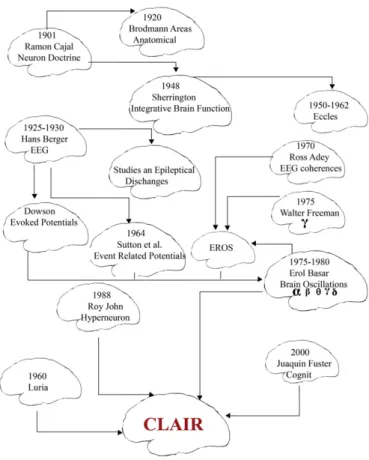
The CLAIR model includes several ideas and concepts, which are original in neuroscience since the beginning of the 20th century. It is ev-ident that this new CLAIR model bases on empiricalfindings.Fig. 13 pre-sents developments that gave rise to the launch of the CLAIR model. This model includes several basic features to attain a possibility to organize a detailed functional map of brain functions. New programs are needed to present all detailed information at least from 20 brain structures.
Fig. 12. Electrode constellations in parietal, frontal ve occipital areas.
Fig. 13. This historical chart illustrates the developmental steps from Cajal to Brodmann and Sherrington during the area of Neuron Doctrine. Later, upon discovery of EEG by Hans Berger several steps by Freeman, Fuster and R. John led to Hyperneuron and Cognits. Now, the CLAIR Model has emerged.
16. Conclusion
Previously, the Brodmann areas were determined by an anatomical presentation of the functions of the brain. Currently, the CLAIR model includes dynamic changes, oscillations, and connectivity:
1. The initiative to extend Brodmann areas bases to include the miss-ing connections between different areas of the brain. The processes of vision cannot be explained only with preliminary and secondary visual areas, as we observed in distributed evoked and event-related oscillatory responses in the cortex. Even a simple light stimulation elicits increased connectivities in the brain.
2. Not only the existence of increased electrical responses, but also oscillatory components of these responses is selectively distributed in the entire cortex. The intensity of oscillations varied upon the modality of stimulations. These are a superposition of the oscilla-tions that are also selectively distributed in different areas. 3. The analyses of the coherences demonstrated that upon cognitive
task, the stimulation is processed by a large group of the brain areas, and responses are usually prolonged. Precisely, the number of neurons increased during the performance of a task or by percep-tion of a more complex stimulapercep-tion pattern.
4. Superposition of oscillations, changes in coherence, and degree of delayed responsiveness enable researchers accuracy in analyzing the functions. Selective distribution of function-related centers shows a dynamic nature, and it is not possible tofind exact localiza-tions, but merely dynamic changes upon presentation of the stimulation (Luria, 1966).
5. Brodmann areas are very useful functional maps of the brain, en-abling the researchers to globally learn or identify functional areas of the brain. In the study of brain oscillations, these maps are also extremely useful to choose adequate functional regions.
6. Brodmann areas are a continuation of the fundamental elements of Cajal's neuron doctrine. Accordingly, the underlined principle is the existence of independent neurons, or neuron populations as func-tional clusters. According to Cajal, the brain is not a syncytium. Barlow (1961)even defined two or three cardinal neurons in the visual cortex that can accomplish complicating functions.Başar (2011) accumulated and explained experimental data against these assumptions. Few neurons or small populations of neuron clusters in a single area cannot be considered for the performance of a given brain function. Three decades ago, Roy John suggested existing large neural populations for executing functions and termed them the“hyperneuron.” Further,Fuster (2013)introduced the“cognits” for presenting functional units, functional modules, or presentation of cognitive functions. Finally,Başar (2011)used the expression“working syncytium,” or partial syncytium that had been already coined.
7. The expression“CLAIR areas” is a consequence of these earlier judgments or theories. In the future, degrees of phase locking and timescale must be added to these maps.
8. There are huge differences in frequency composition of different parts of the cortex upon application of sensory or event-related stimulations. Thesefindings add highly to the value of CLAIR maps. 9. Partial CLAIR maps are also useful in the diagnosis of Alzheimer's disease and BD. It can be expected that such maps can be also useful for physicians to differentiate diseases and observe their progression.
10. The preliminary CLAIR maps and their yet rough structures are based on these experimental data; therefore, we need analyses with exact numerical data and by considering measurements under all concepts and measurements following application of drugs in patients.
11. This study needs several new steps and addition of more experi-mental data for the development of the concept of Brodmann areas. In the future, we propose the expression“modules with
different size and extensions.”Fig. 6is a preliminary rough concep-tual picture.
12. In this study, the most important step toward brain oscillations and functionality should be the study of connectivity in the entire cortex via the brain's oscillatory responses. The inclusion of the functional activity of the cerebellum could not be achieved yet in CLAIR maps. 13. Further, we did not consider the exact time localization of the oscillatory responses. This can be done only after analyses of phase spectra, which can be performed by changing the locations of oscillatory response bars in the alpha, beta, delta, and theta frequency windows.
14. ITC analyses provide additional information. The addition of ITC could be achieved possibly with three-dimensional maps. 15. The proposal to develop CLAIR maps is based on neurophysiological
empiricalfindings, including several EEG oscillations, and spatial connectivity. It is assumed that a relevant progress for functional brain maps will be achieved in this way. However, we do not sug-gest that anatomical importance of Brodmann areas andfindings of Penfield should be discarded.
16.1. Conclusion
In conclusion, we emphasize that the presented CLAIR model with the simplest frequency/coherency diagrams and timescales can be used to enrich the Brodmann areas. This model has potential future applications, providing rich parameters in a compact form. Therefore, such an approach may help compare normal brain function with func-tional impairment.
A CLAIR model with optimum function will take several years to develop; however, this study lays the foundation for developing such a model.
References
Barlow, H.B., 1961. Possible principles underlying the transformation of sensory mes-sages. In: Rosenblith, W.A. (Ed.), Sensory Communication. MIT Press, Cambridge, p. 217.
Başar, E., 1972. A study of the time and frequency characteristics of the potentials evoked in the acoustical cortex. Kybernetik 10, 61–64.
Başar, E., 1980. EEG-Brain Dynamics: Relation Between EEG and Brain Evoked-Potentials. Elsevier, Amsterdam.
Başar, E. (Ed.), 1988. Dynamics of Sensory and Cognitive Processing by the Brain. Springer, Berlin-Heidelberg-New York.
Başar, E., 1998. Brain function and oscillations I. Brain Oscillations. Principles and Approaches. Springer, Berlin-Heidelberg, New York.
Başar, E., 1999. Brain function and oscillations II. Integrative brain function. Neurophysiology and Cognitive Processes. Springer, Berlin-Heidelberg, New York.
Başar, E., 2004. Memory and Brain Dynamics: Oscillations Integrating Attention, Perception, Learning and Memory. CRC Press, Florida.
Başar, E., 2006. The theory of the whole-brain-work. Int. J. Psychophysiol. 60 (2), 133–138 (in review).
Basar, E., 2010. Why the concept of“quantum brain” was not discovered in 1940s. NeuroQuantology 8, 322–336.
Başar, E., 2011. Brain-Body-Mind in the Nebulous Cartesian System: A Holistic Approach by Oscillations. Springer Publishers, New York.
Başar, E., 2012. Multiple oscillations and phase locking in human gamma responses: an essay in search of eigenvalues. Neuroquantology 10, 606–618.
Başar, E., 2013. A review of gamma oscillations in healthy subjects and in cognitive im-pairment. Int. J. Psychophysiol. 90, 99–117.
Brain Dynamics. In: Başar, E., Bullock, T.H. (Eds.), Progress and Perspectives. Springer, Berlin-Heidelberg-New York.
Başar, E., Bullock, T.H. (Eds.), 1992.Induced Rhythms in the Brain. Birkhäuser, Boston. Başar, E., Düzgün, A., 2016a. How is the brain working? Research on brain oscillations and
connectivities in a new“take-off” state. Int. J. Psychophysiol. 103, 3–11 (in this volume). Başar, E., Düzgün, A., 2016b. The brain as a working syncytium and memory as a continuum in a hyper timespace. Oscillations lead to a new model. Int. J. Psychophysiol. 103, 199–214 (in this volume).
Başar, E., Ungan, P., 1973. A component analysis and principles derived for the understanding of evoked potentials of the brain: studies in the hippocampus. Kybernetik 12, 133–140. Başar, E., Gönder, A., Özesmi, C., Ungan, P., 1975a. Dynamics of brain rhythmic and evoked potentials I. Some computational methods for the analysis of electrical signals from the brain. Biol. Cybern. 20, 137–143.
Başar, E., Gönder, A., Özesmi, C., Ungan, P., 1975b. Dynamics of brain rhythmic and evoked potentials II. Studies in the auditory pathway, reticular formation, and hippocampus during the waking stage. Biol. Cybern. 20, 145–160.
Başar, E., Gönder, A., Özesmi, C., Ungan, P., 1975c. Dynamics of brain rhythmic and evoked potentials III. Studies in the auditory pathway, reticular formation, and hippocampus during sleep. Biol. Cybern. 20, 161–169.
Başar, E., Demir, N., Gönder, A., Ungan, P., 1979a. Combined dynamics of EEG and evoked potentials I. Studies of simultaneously recorded EEG–EP-grams in the auditory pathway, reticular formation and hippocampus of the cat brain during the waking stage. Biol. Cybern. 34, 1–19.
Başar, E., Durusan, R., Gönder, A., Ungan, P., 1979b. Combined dynamics of EEG and evoked potentials II. Studies of simultaneously recorded EEG-Programs in the auditory pathway, reticular formation and hippocampus of the cat brain during sleep. Biol. Cybern. 34, 21–30.
Başar, E., Rahn, E., Demiralp, T., Schürmann, M., 1998. Spontaneous EEG theta activity controls frontal visual evoked potential amplitudes. Electroencephalogr. Clin. Neurophysiol. 108, 101–109.
Başar, E., Başar-Eroğlu, C., Karakaş, S., Schürmann, M., 2001a. Gamma, alpha, delta, and theta oscillations govern cognitive processes. Int. J. Psychophysiol. 39, 241–248. Başar, E., Özgören, M., Karakaş, S., 2001b. A brain theory based on neural assemblies and
superbinding. In: Reuter, H., Schwab, P., Gniech, K.D. (Eds.), Wahrnehmen und Erkennen. Pabst Science Pub, Lengerich, pp. 11–24.
Başar, E., Özgören, M., Karakaş, S., 2001c. Superbinding in integrative brain function and memory. Proceedings of 23rd Annual International Conference of IEEE Engineering in Medicine and Biology Society.
Başar, E., Güntekin, B., Tülay, E., Yener, G.G., 2010. Evoked and event related coherence of Alzheimer patients manifest differentiation of sensory-cognitive networks. Brain Res. 1357, 79–90.
Başar, E., Düzgün, A., Güntekin, B., 2014. A proposal to extend Brodmann's areas concept to a new model. Neuroquantology 12, 1–9.
Başar, E., Schmiedt-Fehr, C., Mathes, B., Femir, B., Emek-Savaş, D.D., Tülay, E., Tan, D., Düzgün, A., Güntekin, B., Özerdem, A., Yener, G.G., Başar-Eroğlu, C., 2016. What does the broken brain tell the neuroscientist? Oscillations and connectivity in schizophrenia, Alzheimer's disease, and Bipolar disorder. Int. J. Psychophysiol. 103, 135–148 (in this volume). Başar-Eroğlu, C., Başar, E., Schmielau, F., 1991. P300 in freely moving cats with intracranial
electrodes. Int. J. Neurosci. 60, 215–226.
Başar-Eroğlu, C., Başar, E., Demiralp, T., Schürmann, M., 1992. P300-response: possi-ble psychophysiological correlates in delta and theta frequency channels. Int. J. Psychophysiol. 13, 161–179.
Başar-Eroğlu, C., Strüber, D., Stadler, M., Kruse, P., Başar, E., 1993. Multistable visual perception induces a slow positive EEG wave. Int. J. Neurosci. 73, 139–151. Başar-Eroğlu, C., Demiralp, T., Schürmann, M., Başar, E., 2001. Topological distribution of
oddball‘P300’ responses. Int. J. Psychophysiol. 39, 213–220.
Brodmann, K., 1909. Vergleichende lokalisationslehre der grosshirnrinde in ihren prinzipien dargestellt auf grund de zellenbaues. JA Barth, Leipzig.
Bullock, T.H., Başar, E., 1988. Comparison of ongoing compound field potentials in the brains of invertebrates and vertebrates. Brain Res. Rev. 13, 57–75.
Bullock, T.H., Iragui, V.J., Alksne, J.F., 1990. Electrocorticogram coherence and correlation of amplitude modulation between electrodes both decline in millimeters in human as well as in rabbit brains. Soc. Neurosci. Abstr. 16, 1241.
Bullock, T.H., McClune, M.C., Achimowicz, J.Z., Iragui-Madoz, V.J., Duckrow, R.B., Spencer, S.S., 1995b. Temporalfluctuations in coherence of brain waves. Proc. Natl. Acad. Sci. U. S. A. 92, 11568–11572.
Buszaky, G., 2006. Rhythms of the Brain. Oxford University Press, New York.
Chen, A.C., Herrmann, C.S., 2001. Perception of pain coincides with the spatial expansion of electroencephalographic dynamics in human subjects. Neurosci. Lett. 297, 183–186.
Dawson, G.D., 1954. A summation technique for the detection of small evoked potentials. Electroencephalogr. Clin. Neurophysiol. 6, 65–84.
Eckhorn, R., Bauer, R., Jordan, R., Brosch, W., Kruse, M., Munk, M., Reitboeck, H.J., 1988. Coherent oscillations: a mechanism of feature linking in the visual cortex. Biol. Cybern. 60, 121–130.
Fessard, A., 1961. The role of neuronal networks in sensory communications within the brain. In: Rosenblith, W.A. (Ed.), Sensory Communication. MIT Press, Cambridge, MA, pp. 585–606.
Flohr, H., 1991. Brain processes and phenomenal consciousness: a new and specific hypothesis. Theory Psychol. 1, 245–262.
Freeman, W.J. (Ed.), 1975. Mass Action in the Nervous System. Academic Press, New York. Fuster, J.M., 2013. The Neuroscience of Freedom and Creative. Our Predictive Brain.
Cam-bridge University Press.
Gibson, J.J., 1966. The Senses Considered as Perceptual Systems. Houghton Mifflin, Boston. Gray, C.M., Singer, W., 1989. Stimulus-specific neuronal oscillations in orientation
columns of cat visual cortex. Proc. N. Y. Acad. Sci 86, 1698–1702. Gregory, R., 1970. The Intelligent Eye. Weidenfeld and Nicolson, London.
Gurtubay, I.G., Alegre, M., Labarga, A., Malanda, A., Artieda, J., 2004. Gamma band responses to target and non-target auditory stimuli in humans. Neurosci. Lett. 367 (1), 6–9.
Hayek, F.A. (Ed.), 1952. The Sensory Order. University of Chicago Press, Chicago. Hebb, D.O., 1949. The Organization of Behaviour. Wiley, New York.
Hebb, D.O., 1951. The role of neurological ideas in psychology. J. Pers. 20, 39–55. John, E.R., 1988. Resonatingfields in the brain: the Hyperneuron. In: Başar, E. (Ed.),
Springer Series on Brain Dynamics I. Springer-Verlag, Hiedelberg.
Karakaş, S., Erzengin, Ö.U., Başar, E., 2000a. A new strategy involving multiple cognitive paradigms demonstrates that ERP components are determined by the superposition of oscillatory responses. Clin. Neurophysiol. 111, 1719–1732.
Karakaş, S., Erzengin, Ö.U., Başar, E., 2000b. The genesis of human event-related responses explained through the theory of oscillatory neural assemblies. Neurosci. Lett. 285, 45–48.
Klimesch, W., Doppelmayr, M., Pachinger, T., Ripper, B., 1997. Brain oscillations and human memory performance: EEG correlates in the upper alpha and theta bands. Neurosci. Lett. 238, 9–12.
Klimesch, W., Doppelmayr, M., Rohm, D., Pollhuber, D., Stadler, W., 2000a. Simultaneous desynchronization and synchronization of different alpha responses in the human electroencephalograph: a neglected paradox? Neurosci. Lett. 284, 97–100. Klimesch, W., Doppelmayr, M., Schwaiger, J., Winkler, T., Gruber, W., 2000b. Theta
oscilla-tions and the ERP old/new effect: independent phenomena? Clin. Neurophysiol. 111, 781–793.
Kocsis, B., Viana Di Prisco, G., Vertes, R.P., 2001. Theta synchronization in the limbic sys-tem: the role of Gudden's tegumental nuclei. Eur. J. Neurosci. 13, 381–388. Luria, A.R., 1966. Higher Cortical Functions in Man. Basic Books, New York.
Miltner, W., Braun, C., Arnold, M., Witte, H., Taub, E., 1999. Coherence of gamma-band EEG activity as a basis for associative learning. Nature 397, 434–436.
Neuper, C., Pfurtscheller, G., 1998a. Event-related desynchronization (ERD) and synchro-nization (ERS) of rolandic EEG rhythms during motor behavior. Int. J. Psychophysiol. 30, 7–8.
Neuper, C., Pfurtscheller, G., 1998b. 134 ERD/ERS based brain computer interface (BCI): effects of motor imagery on sensorimotor rhythms. Int. J. Psychophysiol. 30, 53–54. Özerdem, A., Güntekin, B., Tunca, Z., Başar, E., 2008. Brain oscillatory responses in patients
with bipolar disorder manic episode before and after valproate treatment. Brain Res. 1235, 98–108.
Pfurtscheller, G., 1997. EEG event-related desynchronization (ERD) and synchronization (ERS). Electroencephalogr. Clin. Neurophysiol. 103, 26.
Pfurtscheller, G., 2001. Functional brain imaging based on ERD/ERS. Vis. Res. 41, 1257–1260.
Pfurtscheller, G., Neuper, C., Ramoser, H., Müller-Gerking, J., 1999. Visually guided motor activates sensorimotor areas in humans. Neurosci. Lett. 269, 153–156.
Pfurtscheller, G., Brunner, C., Schlogl, A., Lopes da Silva, F.H., 2006. Mu rhythm, (de)synchronization and EEG single-trial classification of different motor imagery tasks. NeuroImage 31, 153–159.
Rosso, O.A., Blanco, S., Yordanova, J., Kolev, V., Figliola, A., Schürmann, M., Başar, E., 2001. Wavelet Entropy: a new tool for analysis of short time brain electrical signals. J. Neurosci. Methods 105, 65–75.
Rosso, O.A., Martin, M.T., Plastino, A., 2002. Brain electrical activity analysis using wavelet-based informational tools. Physica A 15, 587–608.
Sakowitz, O.W., Quiroga, R.Q., Schürmann, M., Başar, E., 2001. Bisensory stimulation increases gamma-responses over multiple cortical regions. Brain Res. Cogn. Brain Res. 11, 267,279.
Schürmann, M., Başar-Eroglu, C., Kolev, V., Başar, E., 1995. A new metric for analyzing single-trial event-related potentials (ERPs): application to human visual P300 delta response. Neurosci. Lett. 197 (3), 167–170.
Schürmann, M., Başar-Eroğlu, C., Başar, E., 1997. Gamma responses in the EEG: elementary signals with multiple functional correlates. Neuroreport 8, 531–534.
Schürmann, M., Demiralp, T., Başar, E., Başar-Eroğlu, C., 2000. Electroencephalogram alpha (8–15 Hz), responses to visual stimuli in cat cortex, thalamus, and hippocampus: a distributed alpha network? Neurosci. Lett. 292, 175–178.
Sherrington, C., 1948. The Integrative Action of the Nervous System. Cambridge University Press.
Solms, M., Turnbull, O., 2002. Emotion and motivation. In: Solms, M., Turnbull, O. (Eds.), The brain and the inner world. Other Press, New York, pp. 105–137.
Sutton, S., Braren, M., Zubin, J., John, E.R., 1965. Evoked-potential correlates of stimulus uncertainty. Science 150, 1187–1188.
Varela, F.J., Lachaux, J.P., Rodríguez, E., Martinerie, J., 2001. The brainweb: phase synchro-nization and large-scale integration. Nat. Rev. Neurosci. 2, 229–239.
von Economo, C., Koskinas, G.N., 1925. Die Cytoarchitektonik der Hirnrinde des Erwachsenen Menschen: Textband und Atlas mit 112 Mikrophotographischen Tafeln. Springer, Vienna.
Yener, G.G., Başar, E., 2013a. A review in the search of an electrophysiologic biomarker: brain oscillatory responses in Alzheimer's disease. Suppl. Clin.Neurophysiol. 62, 237–273.
Yordanova, J., Kolev, V., 1998. Single-sweep analysis of the theta frequency band during an auditory oddball task. Psychophysiology 35, 116–126.