YAŞAR UNIVERSITY
GRADUATE SCHOOL OF NATURAL AND APPLIED SCIENCES MASTER THESIS
Analysing Brainwaves with a Portable EEG Device via
Mobile Platforms
Tuğçe Kalkavan
Thesis Advisor: Asst.Prof.Dr. İbrahim Zincir
Department of Computer Engineering
Presentation Date: 23.08.2016
Bornova-İZMİR 2016
ii
I certify that I have read this thesis and that in my opinion it is fully adequate, in scope and in quality, as a dissertation for the degree of master of science.
I certify that I have read this thesis and that in my opinion it is fully adequate, in scope and in quality, as a dissertation for the degree of master of science.
I certify that I have read this thesis and that in my opinion it is fully adequate, in scope and in quality, as a dissertation for the degree of master of science.
iii ABSTRACT
ANA LYSING BRAINWAVES VIA PORTABLE EEG DEVICE ON MOBILE PLATFROMS
KALKAVAN, Tuğçe MSc in Computer Engineering Supervisor: Asst. Prof. Dr. İbrahim ZİNCİR
March 2016, 110 pages
Electroencephalography (EEG) devices measure electrical activity of brainwaves and they are widely used in cognitive science, neuroscience and psychophysiological research. In clinical usage, many of electrodes are placed on the scalp over the multiple areas of the brain in order to make a research with recordings. In the last few years there has been a growing interest in development of portable EEG devices that provide the possibility of measuring brainwaves in easiest and cheapest way. Current research shows portable EEG devices used in many areas and applications such as improving memory, imaging tools, neurofeedback etc. The main advantage of portable EEG devices is that provides a communication and control devices with brainwaves in an easy and cheapest way. This thesis basically covers the usage of portable EEG device in order to control devices hardware based and software components as well as related works about EEG devices.
Keywords: Data Mining, Electroencephalography, Brainwave Analysis, Control with
Brainwaves, Classification, Portable EEG Device, EEG Signals, Wheelchair Control with Brainwaves
iv ÖZET
PORTATIF EEG CIHAZIYLA BEYIN DALGALARININ MOBIL PLATFORMLARDA ANALIZ EDILMESI
Tuğçe KALKAVAN
Yüksek Lisans Tezi, Bilgisayar Mühendisliği Bölümü Tez Danışmanı: Yard.Doç.Dr. İbrahim Zincir
Mart 2016, 110 sayfa
Elektroensefalografi kısaca EEG, beynin elektriksel hareketlerini ölçen bilişsel bilim, sinirbilim ve psikofizyolojik araştırma alanlarında sıkça kullanılan bir alettir. Klinik uygulamalarda kafa derisine değen birden fazla elekrot ile beynin farklı bölgelerinden sinyaller toplanır. Teknolojinin gelişmesi ile birlikte son yıllarda kolay ve uygulanabilir olması açısından portatif EEG cihazları geliştirmek için yatırımlar yapılmaktadır. Yapılan çalışmalarda portatif EEG cihazları hafızayı geliştirmek, beyni görüntüleme ve nöroterapi gibi birçok alanda kullanılmakta. Portatif EEG cihazları cihazları yönetebilmek adına ucuz ve kolay bir çözüm sağlamaktadır. Bu tez, portatif EEG cihazı kullanarak hem donanıma dayalı hem de yazılım bileşenlerini kullanabilmek adına çözüm sunmakta olup, bu alanda yapılmış çalışmaları ve sonuçlarını alt bölümlerde incelemektedir.
Anahtar sözcükler: Veri Madenciliği, Elektroensefalografi, Beyin Dalgaları Analizi,
Beyin Dalgasıyla Kontrol, Sınıflandırma, Taşınabilir EEG cihazları, EEG sinyalleri, Tekerlekli Sandalye Kontrolü
v
ACKNOWLEDGEMENTS
I would like to thank to my supervisor Asst. Prof. Dr. İbrahim Zincir for his guidance and support throughout the research and writing phases of my thesis.
Furthermore, I would like to thank to the academic staff of Computer Engineering and Software Engineering Departments of Yasar University, for their interest in my work and in my seminar presentation which gave me an opportunity to put my theoretical knowledge into practice.
Finally, I would like to thank to my parents and my friends for their constant support.
Tuğçe KALKAVAN İzmir, 2016
vi
TEXT OF OATH
I declare and honestly confirm that my study, titled “Analysing Brainwaves with a Portable EEG Device via Mobile Platforms” and presented as a Master’s Thesis, has been written without applying to any assistance inconsistent with scientific ethics and traditions, that all sources from which I have benefited are listed in the bibliography, and that I have benefited from these sources by means of making references.
vii TABLE OF CONTENTS ABSTRACT iii ÖZET iv ACKNOWLEDGEMENTS v TEXT OF OATH vi
TABLE OF CONTENTS vii
INDEX OF FIGURES x
INDEX OF TABLES xii
INDEX OF SYMBOLS AND ABBREVIATIONS xiii
1. Introduction 1
2. Literature Review 5
Attention sensitive web browsing 5
Attention for controlling web browser 6
Password application using MindWave Signals 9
Brain- Computer Interface for Mobile Devices 11
Brainwave Manipulated Wagon 15
Brainwave Based Authentication 18
3. Brainwaves 24
What is Electroencephalography (EEG) 24
History of EEG 24
Electrical Activity of Brain 25
Human EEG Studies 26
How Brainwaves can be measured 28
Brainwave Classification 31
viii
Technology Overview and details 34
4.1.1. Bluetooth Pairing 36
ThinkGear™ Chip Details 37
ThinkGear Data Values and Packet Structures 38
4.3.1. POOR_SIGNAL Quality 38
4.3.2. eSensetm Meters 40
4.3.3. ATTENTION eSense 42
4.3.4. MEDITATION eSense 43
4.3.5. RAW Wave value 44
4.3.6. ASIC_EEG_POWER 45
4.3.7. Blink Strength 45
Consumer BCI’s comparisons and accuracy 46
5. System design and implementation 49
Aim 49
Wheelchair Prototype with MindWave 50
5.2.1. System design 50
5.2.2. Implementation 63
Keyboard Application with MindWave 74
5.3.1. System design and implementation 74
Extraction of blink values 78
5.4.1. Eye blink detection 79
5.4.2. Observations 81
5.4.3. Algorithm 84
6. Conclusion and future work 89
ix
CURRICULUM VITAE 95
7. APPENDIX 1 96
x
INDEX OF FIGURES
Figure 2.1 Blink levels of one user, double blinks circled in red (Bose et al., 2016) ... 7
Figure 2.2 Mind pattern configuration and comparison (Senzio and Yamada, 2014) ... 10
Figure 2.3 Mind pattern processing system description (Senzio and Yamada, 2014) ... 10
Figure 2.4 Overall average success rate (Senzio and Yamada, 2014) ... 11
Figure 2.5 System block diagram (Chen et al., 2014) ... 16
Figure 2.6 Captured raw data in text file (Fladby, 2008) ... 19
Figure 3.1 An early D'Arsonval galvanometer showing magnet and rotating coil ... 25
Figure 3.2 Richard Caton (Wikipedia, 2016b) ... 26
Figure 3.3 Hans Berger (Neurociencias, 2016) ... 27
Figure 3.4 The first human EEG recording obtained by Hans Berger in 1924. The upper tracing is EEG, and the lower is a 10 Hz timing signal (cassiopaea.org, 2013). ... 28
Figure 3.5 Example of placement of electrodes (Plonsey and Malmivuo, 1995)... 29
Figure 3.6 Lobes of cerebral cortex (Sebastian023, 2012) ... 31
Figure 4.1 MindWave Mobile headset (Neurosky.com, 2016) ... 34
Figure 4.2 MindWave Mobile successful connection ... 37
Figure 4.3 eSense Attention Meter... 43
Figure 4.4 eSense Meditation level ... 44
Figure 4.5 Comparison of raw EEG power bands Biopac (red) with NeuroSky(blue) (I. NeuroSky, 2009)... 48
Figure 5.1 Chassis for car prototype (banggood.com, 2016) ... 51
Figure 5.2 Arduino Uno and Adafruit motor shield stacked together (Lee, 2014 ) ... 52
Figure 5.3 HC-05 Bluetooth pins ... 53
Figure 5.4 HC-05 Bluetooth pins connected on motor shield pins ... 53
Figure 5.5 Car chassis after putting hardware ... 54
Figure 5.6 Battery pack for powering motors on EXT_PIN pins ... 55
Figure 5.7 Shows wheelchair at the upper side ... 56
Figure 5.8 Shows car at the right side ... 57
Figure 5.9 Shows car at the left side ... 57
Figure 5.10 Shows the car at the back side ... 58
Figure 5.11 Circuit plan of wheelchair prototype ... 59
Figure 5.12 Completed circuit for detecting head movements from right side ... 60
Figure 5.13 Completed circuit for detecting head movements from left side ... 60
Figure 5.14 MindWave Mobile with MPU-6050 sensor from left side view... 61
Figure 5.15 MindWave Mobile with MPU-6050 sensor from back side view ... 62
Figure 5.16 Circuit plan of head movement prototype ... 63
xi
Figure 5.18 Variables in MindwaveHandler class ... 66
Figure 5.19 initDevice method in MindwaveHandler class ... 66
Figure 5.20 Wheelchair application started ... 67
Figure 5.21 Wheelchair application after connections has been made... 68
Figure 5.22 Wheelchair device ready to move ... 69
Figure 5.23 Observable variable gyroMessage in setGyroMessage ... 70
Figure 5.24 Sequence diagram of movement of wheelchair ... 72
Figure 5.25 Wheelchair moving left/right directions ... 73
Figure 5.26 Wheelchair moving forward/backward directions ... 73
Figure 5.27 Project structure of keyboard application ... 74
Figure 5.28 Keyboard application started with row navigation ... 76
Figure 5.29 Selection of letter with double blink ... 77
Figure 5.30 Sequence diagram for keyboard application ... 78
Figure 5.31 Eye blink artifact ("User Tutorial:EEG Measurement Setup," 2012) ... 80
Figure 5.32 Eye movement artifact ("User Tutorial:EEG Measurement Setup," 2012) ... 81
Figure 5.33 Single blink values with respect to time ... 82
Figure 5.34 Several eye blinks observations including strongly closing eyelids ... 83
Figure 5.35 Double/Triple blinking with respect to time ... 84
Figure 5.36 Possible occurrence of eye blink algorithm ... 85
Figure 5.37 Detection of eye blink as means of counter and time values ... 87
Figure 5.38 Sequence diagram of checkBlinking method ... 88
xii
INDEX OF TABLES
Table 2.1 Result of experiments (Dobosz et al., 2015) ... 14
Table 2.2 Eight tasks used in experiments ... 19
Table 2.3 Features used in experiments (Fladby, 2008) ... 21
Table 3.1 Types of brainwaves and their meaning (Hillman, 2014) ... 33
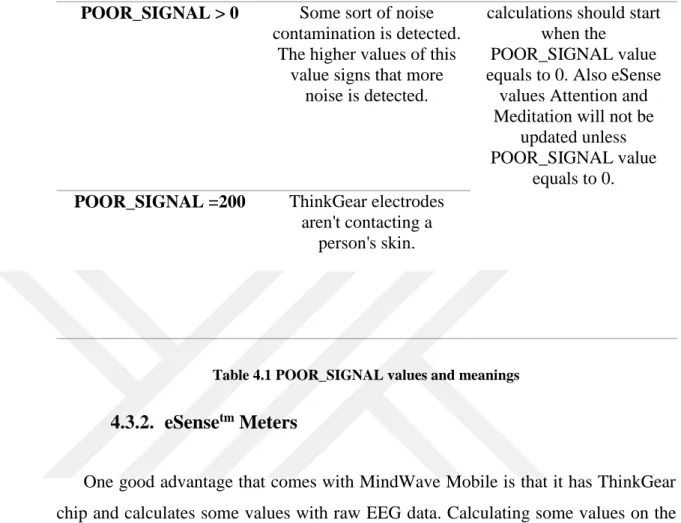
Table 4.1 POOR_SIGNAL values and meanings ... 40
Table 4.2 eSense value ranges and meanings ... 42
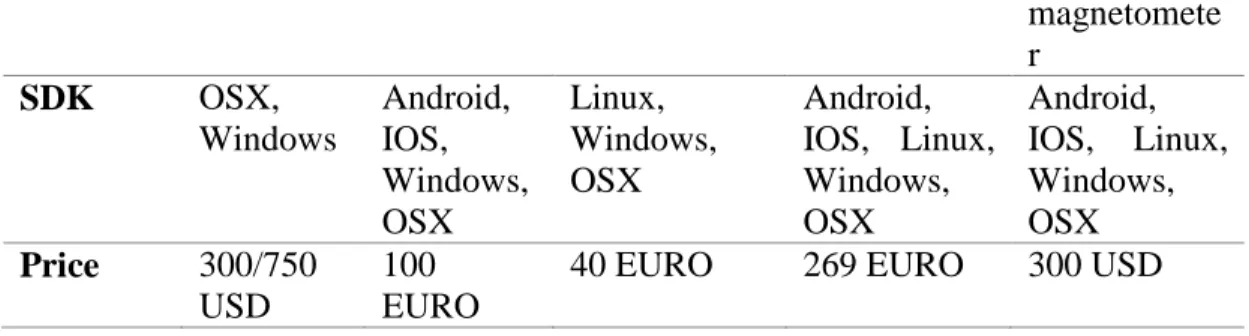
Table 4.3 Comparison list of portable EEG devices (alphatrainer.com, 2016) ... 47
xiii
INDEX OF SYMBOLS AND ABBREVIATIONS Abbreviations
EER Equal Error Rate
DTW Dynamic Time Warping
ZCR Zero Crossing Rate
MSP Mean Sample Power
VAZ Values Above Zero
PF Peak Frequency
FMR False Match Rate
1
1. Introduction
A brain–computer interface (BCI), sometimes called a mind-machine interface (MMI), direct neural interface (DNI), or brain–machine interface (BMI), is a direct communication pathway between an enhanced or wired brain and an external device. BCIs are often directed at researching, mapping, assisting, augmenting, or repairing human cognitive or sensory-motor functions ("BCI," 2016) . BCI is considered as the next level of communication as means of controlling devices without any physical interaction.
BCIs are considered as most significant discoveries in last decades that gives hope to disabled people for living comfortably and aims to eliminate the barrier due to the disability such as providing vision to blind person, hearing ability to deaf and help physically paralyzed etc. One top of technique to capture users thought that is capturing user’s brainwaves is electroencephalography (EEG) which is most of the time non-invasive method except some medical applications uses non-invasive way to get brainwaves from user. EEG records and patterns give more information if scalp has more electrodes; that provides information coming through your brain with different places. People who have ALS or motor neuron disease are potential user of EEG devices to control their wheelchair with brain.
The aim of this thesis is to provide solution for controlling a car with NeuroSky Mobile device together with additional gyroscope sensor in a cheaper way and also provide solution for keyboard usage with brainwaves. Several works show that one sensor is not enough for controlling devices with multiple commands rather it is easy for switching in on/off manner Work by (Chen et al., 2014) and also by (Fladby, 2008) examined detailed research that aims to provide authentication mechanism for users and made a conclusion one sensor is not enough to distinguish clients with tasks. (Bose et al., 2016) used attention values for controlling web browsers and getting feedback from user to improve advertisement quality. In this work, they are aware that is better to use EEG device with more electrode, but instead they used MindWave Mobile
2
attention values and they concluded that to control something it is hard to keep concentrated in specific task interval therefore using attention value could be not enough along to control something because attention values easily effected by unexpected movements. Usage of both double blink and attention values for switching options gave good results according to (Dobosz and Wittchen, 2015) after examining different options with clients. According to studies, usage of both attention and blink values provide appropriate solution for giving multiple commands as means of controlling devices with brainwaves. Combination of blink, attention and head movement values proposes real time solution as means of controlling prototype car with brainwaves thus gives a perspective for real life usage. Likewise, usage of blink values provides efficient solution for typing letter which aims ability to write words without any physical interaction. Both solutions offer cheap and reliable solution on behalf of controlling both software and hardware components with MindWave Mobile device.
During this thesis, research’s related with portable EEG devices examined in 2 Literature Review section to show related works and advantages/disadvantages of NeuroSky Mobile device. Leading with idea cheaper solution for driving wheelchair and applications based on MindWave Mobile device has been developed together with Arduino. Chapter 3 Brainwaves section starts with historical review of brainwaves and continues to give motivation for understanding basic concepts of brainwaves such as how can be measurement done, frequency bands etc. Chapter 4 MindWave Mobile gives detailed information about features of MindWave Mobile device. Apart from other EEG devices, MindWave Mobile device provides extra fields (eSense meters like attention, meditation etc.) which are calculated based on frequency bands. From that eSense meters, attention value is mostly used while developing applications during this thesis. Another eSense value comes with SDK is blink value that indicates how strongly user is blink with value between 0 to 100. To detect double blink and blink values, algorithm developed depending on observations because blink value coming from SDK seems not accurate after some observations. Instead of getting blink value directly from SDK, this value used like binary value to indicate blink is occurred or not and algorithm
3
runs in order to check either double blink or blink is occurred. In Chapter 5 System design and implementation part, implementation of designed system for controlling car and software components with brainwaves covered in detailed way. Car prototype constructed on wood chassis and Arduino Uno used together with motor shield including Bluetooth module named HC-05. In order to detect head movements of user, another small hardware prototype constructed with Arduino Nano, MPU 6050 gyroscope and Bluetooth module HC-05 and placed on top of the MindWave Mobile device. After observations, Arduino code developed in order to detect head movements in the directions of forward, backward, left and right. Mpu6050 is powerful device as means of getting sensitive values in three dimensional axes, additional directions can be added as needed. Four direction seemed enough and whenever user moves the head to defined direction, one letter will send through Bluetooth module to Android application as forward represented as F, backward as B, left as L and right as R. In the android application, observer/observable pattern is used while developing algorithm that observes any changes Bluetooth message coming from head movement hardware. Whenever user moves head, android application observes and catches the direction and if the current attention value falls into predefined interval, the Bluetooth message will send to prototype car in order to move that direction. The bigger attention value the faster car prototype will move to that direction for 1.5 seconds long. Another android application named keyboard application provides a solution for writing word with brainwaves. After successful connection with MindWave Mobile device, navigation for row selection starts and wait for user to blink. If the user blinked once, navigation continues with column selection and waits user to double blink to select specific letter. Selected letter will be written to textbox and application continues with row selection. Both applications provide simple and cheap solution for brainwave controlled devices as for hardware and software manner. MindWave Mobile has one dry sensor only which can give only specific information about brain that implies constructing multiple command is hard issue for controlling devices. For that reason, small hardware placed on top of MindWave Mobile to control car with head movements together with using brainwaves which proposes simple and cheap solution for controlling devices with only one sensor EEG device. Chapter 6 Conclusion and future work gives ideas about what
4
can be the step next to investigate to build more complex systems with using brainwaves. Deductions from previous research investigated in this section to show appropriate usage of MindWave Mobile device for controlling devices.
5
2. Literature Review
Extracting meaningful data from portable EEG device and make use of this meaningful data in order to control devices is the most popular BCI research area. There are lots of ways to control devices which vary from device to device. Most of the applications are based on training and classifying EEG data for personal usage.
Controlling devices with brainwaves includes car, quadcopter, wheelchair etc. In the work of (Yu et al., 2012) used Emotiv Epoc EEG headset to control Ar Drone which is a quadrotor aimed for disabled people to see future areas with drone. Another research done by (Campbell et al.) also used Emotiv Epoc EEG headset for making calls on smartphone by observing P300 wave of brain which is known as Event Related Potential(ERP) is about process of decision making. In another work by (Campbell et al.) classified EEG signals to control robots as means of human satisfaction with using Emotiv EEG device. Another interesting usage of Epoc EEG is to control wheelchair with head movements by (Rechy-Ramirez and Hu, 2014) with a successful outcome in which idea of usage head movements related with this thesis.
In this section, previous researches and conclusions about MindWave Mobile device are investigated and reviewed below as subsections.
Attention sensitive web browsing
Based on NeuroSky’s eSense Meter calculations, one of research made which provides web browsing to user using brainwaves. Research study of (Bose et al., 2016), basically suggests to use user’s attention level to control web browser rather than using gaze tracking or time spent on web page. According to this study, they used attention level in three different ways:
First one is controlling mechanism, basically control user interface elements like menus, buttons etc.
6
webpage layout or can insert some advertisements on concentrated area. This one is related with second one which basically offers creating attention
sensitive websites.
As stated by (Bose et al., 2016), they are suggesting that it is good to know which sections or websites are more interesting based on user experience with attention value. They believe that it is more helpful to develop attention sensitive webpages in order to increase engagement. They made research for portable EEG devices to get momentary attention level of user in real time and transmit data mobile device using Bluetooth. Depending on their research, it is better to use EEG based solution to control device, determine user’s interest and get feedback from user rather than user’s emotion or gaze tracking.
Attention for controlling web browser
In the first way of controlling web page, they offered to use basic control such as backward and forward navigation buttons, menu navigation and link selection. They did not include new URL entry for reason below:
“We intentionally do not include new URL entry, since pressing keys in a virtual keyboard with the help of the EEG attention level can be quite cumbersome. If totally hands free functionality is required, the URL entry can be performed through voice using a suitable Voice API” (Bose et al., 2016)
For portable EEG device, they used NeuroSky API which provides eSense meter such as Attention, Meditation and also blink value provided by SDK. They are aware that other EEG kits such as Emotiv provides more functionality in order to control things with calculating intention of user to push/pull or left/right.
Since they used NeuroSky EEG device, they created a threshold value of attention for controlling functions such that user navigates to next item like Windows’ ‘tab’ key function. Their threshold value based on time, not based on attention value. But they faced the problem that fluctuation of attention value is high therefore they
7
needed some user familiarization without training. Depending on the user, there is need calibration to determine user’s attention value threshold and they suggested this calibration can be performed by asking the user to perform a simple task or stay still for few seconds while wearing the EEG headset.
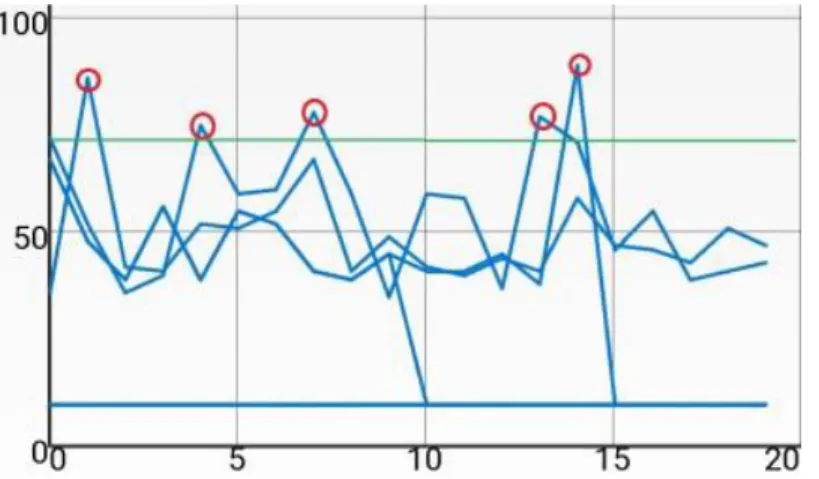
Depending on study of (Bose et al., 2016), the idea behind controlling web browser with attention is that navigation across menus, buttons and other assets will be done by attention level and selection made by blink level of user. Navigating between elements basically done by threshold value of attention like; if attention level of user remained over the threshold for 1 sec, selection stays on the current item; otherwise selection will be moved to next item. They basically used two Activities: Main Activity which is home screen and Browser Activity. Also, they distinguished double blink from blink and used for returning to main activity and also opening current selected item in the web browser. When doing this way, they have used NeuroSky API which provides blink value ranges 0 to 100. They plotted blink level of one user over serial trial shown in Figure 2.1.
Figure 2.1 Blink levels of one user, double blinks circled in red (Bose et al., 2016)
Likewise, as said by (Bose et al., 2016), the difference between the current and previous blink values of 20 can distinguish between a casual and deliberate blink depending on plotting user’s attention level while browsing through a Google news
8
article, recorded over three iterations. They concluded that for most users, the attention level consistently stayed over 30 when they were paying attention to the article.
According to their work, attention for responsive web browser, second suggestion proposed that attention level also used for designing web content more interesting way according to user intentions such as inserting appropriate advertisement. In order to do so, that has mapped the attention level to section or block element that the user is reading on the current webpage. Using JavaScript, this section is captured via scroll position. Along with using EEG sensor, the script is executed in the context of webpage to perform the tracking. They basically used some mathematical formula for scrolling and they mapped the attention level and page scroll percentage readings, using timestamp as the key. They saved user’s attention level and scroll level separately for each user. The good thing is, they later verified that system correctly recorded the actual sections where the user was paying attention by asking the user if the reading reflected their interest. They concluded to send aggregated data to web content developers for gathering feedback and make web contents in more user interesting way using web server.
Their third suggestion is close to the second one; attention sensitive web architecture. With calculating attention of users, web developers can make websites more attention sensitive. They created basically a simple web architecture in order to use further. They describe the way of implementing the code as below (Bose et al., 2016):
Create class APIWrapperEEG class to receive and process events from the EEG device
Annotate APIWrapperEEG class @JavascriptInterface.
Instantiate APIWrapperEEG on the application’s Main Activity creation. Find out page load finish event callback, Register APIWrapperEEG instance,
9
We also provide an EEG.js JavaScript file containing all helper methods which the developer can include and use in their web pages. These are basically wrapper functions and events for the APIWrapperEEG Object.
Their idea of using NeuroSky’s eSense values is good in order to control devices such as computer or mobile devices. However, it is hard to keep attention level stationary even if for 1 second. Whenever you are trying to focus some thought or some events, unexpected sound or movements decrease attention level suddenly. For that reason, it is better to use attention or meditation level for controlling selection speed or movement speed of assets. Also, it is better to analyse blink threshold with using raw EEG data of user, and calculate appropriately by extracting raw data in order to determine whether user blinked or double blinked etc.
Password application using MindWave Signals
Another possible usage of MindWave device is covered by (Senzio and Yamada, 2014) that offers making us of attention/meditation level of brain when thinking specific thing(object, color etc.). Neurosky’s TGAM chip provides attention/meditation level as built-in therefore it is appropriate to use these levels for research. In (Senzio and Yamada, 2014) , they made a comparison between an expected pattern and generated ones in order to do specific actions with determining output signal is correct or no with GUI application shown in Figure 2.2 Mind pattern configuration and comparison. In the work by (Senzio and Yamada, 2014) EEG signals such as attention and meditation updated per second. In order to test generated configurable patterns, they have used three basic patterns for meditation values. Comparing with threshold value, the filtering algorithm determines if the expected pattern occurred or not within the expected time. As reported by (Senzio and Yamada, 2014) , it is easy to develop password-based applications with unique configurable patterns depending on each user within expected time. For example, if user X is able to produce patterns C->B->A in expected time, application give authorization for user X.
10 .
Figure 2.2 Mind pattern configuration and comparison (Senzio and Yamada, 2014)
According to work of (Senzio and Yamada, 2014) , architecture of the system is follows: EEG headset sends output values (that means TGAM-1 coded values) to microcontroller unit via RF transceiver and microcontroller unit decrypts these values. The microcontroller unit gets values from EEG headset with the same baud rate. Figure 2.3 Mind pattern processing system description (Senzio and Yamada, 2014) describes work flow and architecture of system.
11
Work of (Senzio and Yamada, 2014), analyses and compares various patterns for users as shown in Figure 2.4.
Figure 2.4 Overall average success rate (Senzio and Yamada, 2014)
This approach may not be practical in all situations because Figure 2.4 shows pattern C was extremely difficult to recreate. With comparing to others, table shows trained users has better performance than untrained users. Also, by looking at the success rate of pattern C, it is clearly seen that not effective result has been gathered in case of short time frame and low sampling rate. A key limitation of this research is that adaptability is hugely dependent on human factors. If we consider trained users, research performed good results for generating MindWave patterns which includes meditation values and leads up to development purposes for password application.
Brain- Computer Interface for Mobile Devices
In the research of (Dobosz and Wittchen, 2015) indicated another possible usage of MindWave device for people with total motor impairment to control mobile devices. The program mainly consists of two phases; first phase aims to analyse the EEG signals and detect eye blinks second one is interpreting and do appropriate action.
Based on (Dobosz and Wittchen, 2015) , they first created mobile application which collects user’s data( attention, meditation and blink value) and save in it csv file in order to analyse later. The data yielded by this study provides different options for different actions such as, switching option can be made by blink values (namely single or double blink) and choosing options can be made by attention level either reaching threshold value or stay focused in specific time interval. After analysing collected information, they observed that the data appear to suggest that
12
Meditation and attention values are varying in time with very low and very high level.
With the normal functioning (i.e. use mobile phone) attention level generally has value between %40 and %50.
Attention level increased to %75 and higher values when someone focuses on a specific activity or tries to be concentrated.
Also, they observed that it is hard to achieve higher attention level when someone is tired or tries to be relaxed. They seem that attention level will never greater than %50 - %60 in this situation.
For the eye blink values, is seemed that blink strength value generally varies between 38% and 60%, but sometimes can be higher and its value can be over 80%.
Based on above observations, they concluded that either keeping action level with high values in specific interval or achieving high meditation level is both hard. Another conclusion based on observations is that, measuring blink strength is not a good option in given interval because it is hard to get. Rather than blink strength they decided to use whether user blinked in specific time slot, for average 100-400 milliseconds, in order to control system.
Another part of research in (Dobosz and Wittchen, 2015) is basically making experiments with people. They examined 8 people with varying ages between 25 – 44. For those experiments, each user did not perform any activity and each experiment is repeated five times. To give specific activity to each user, randomly selection made in the list below:
Call the third person from the contact list.
Play the third message from the list of voice messages.
13
Any objective listed above was considered “success” if user was able to finish the task in one minute. They concluded the results for each experiment in Table 2.1 Result of experiments (Dobosz et al., 2015).
Number Methods of interaction Success Comment
1 switch: single blink
choice: focus 75%
60% Sometimes incorrect option was chosen.
The best time of completed objective was 25 seconds.
2 switch: double blink
choice: focus 75%
85% Proper option was chosen in most of times, but not every time.
19 seconds was the best time in a single experiment.
3 switch: interval - 1s
choice: focus 75%
10% Proper option cannot be chosen, because option switching interval is too short.
Objective is not achieved.
4 switch: interval - 3s
choice: focus 75%
82% Proper option is chosen in most of times during the tests. The best time is 35 seconds.
5 switch: interval - 5s
choice: focus 75%
16% It is hard to keep high attention level longer than 3 seconds.
This option may work for someone, who is able to keep high attention level longer after training.
6 switch: interval -3s
choice: focus 5%
0% Focus level is too low, and highlighted option is chosen every time without specific interaction with the user.
7 switch: interval - 4s
choice: focus 95%
0% Required focus level is too high.
Option of switching interval is too long.
14
8 switch: interval - 5s
choice: focus 15%
0% Required focus level is too low.
Option of switching interval is too long.
9 switch: interval - 3s
choice: focus 70%
74% Expected option is chosen. Attention level is appropriate.
10 switch: double blink
choice: focus 85%
68% Expected option is chosen in the most of tests.
Objective is achieved. Table 2.1 Result of experiments (Dobosz et al., 2015)
Table 2.1 Result of experiments (Dobosz et al., 2015), shows that 5 out of 10 experiments which success rate is higher than 50% is considered “achieved”. After these results, they concluded that (Dobosz and Wittchen, 2015):
The best focus level (i.e. attention) is approximately 75%.
Another conclusion that the best switching option methods are double-blink and automatic switching option with interval equal to 3 seconds.
o Double blink is a good method, because it is not a normal human behaviour like regular eye blink and can be forced by the user at specific time.
Time interval equals 2 seconds or less may be too low in a real situation. The average user may have problems with achieving high attention level in such short period of time.
On the other hand, time interval equal to 4 or 5 seconds may be too long, because the user may have problems with keeping high attention level for that period of time.
An interval equal to 3 seconds seems to be a reasonable value for this application as it was proved during the tests.
Unfortunately, any pattern or rule representing such situations cannot be distinguished; it simply leads to the conclusion that BCI is not precise. The results of experiments show that the best configuration of setting uses
15
The findings of (Dobosz and Wittchen, 2015) research showed different options in order to control mobile device with MindWave and mostly indicated to usage of double blink and attention level is precise way to do it. Examining different options clearly shows the best choice for switching/choosing actions with success rates. Research of (Dobosz et al., 2015) encouraged me that the usage of double blink, blink and attention level is an appropriate way to control any of mobile devices with MindWave.
Brainwave Manipulated Wagon
A recent paper with the title “Brainwave Manipulated Wagon” by (Chen et al., 2014) examines the role of BCI device in order to control robotic car. Based on (Chen et al., 2014) , they developed and tested the idea of classifying MindWave EEG signals and sending specific commands to robotic car. In this work, authors basically aimed to show that low cost EEG device would help people with physical disabilities such as paralyzed who could not move their hands. They built up robotic car instead of full completed wheelchair device because of time pressure.
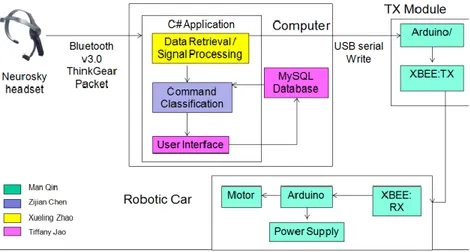
In the design part, user starts with the training phase with simply staring at the lamp on the screen. After collecting data and training process, classifying phase is started. The robotic car is basically receiving classified commands through serial port i.e. TX and RX. Their system block diagram, Figure 2.5 System block diagram (Chen et al., 2014) , consists of basically:
C#, MySQL for data retrieval and classification. GUI for user interface.
16
Figure 2.5 System block diagram (Chen et al., 2014)
In this study, they pointed out that being able to use attention value is important because they designed algorithm accordingly. They built up a GUI with small lamp to measure user’s attention value according to NeuroSky’s user guide which claims that attention value can be controlled through a visual focus, such staring at a point on the screen, or focusing on imagining the action user hoped to accomplish.
To differentiate attention levels, they considered to come up with two states, concentrated and not concentrated, when classifying the user data. After user data gathered as means of attention when concentrating the bulb, algorithm sorts the collected data using merge sort. By averaging the middle third of the training data, algorithm calculates the classifying point. They preferred to choose this approach because they claimed it will eliminate low values of attention which may occur suddenly in case of not fully concentrated in training phase. Also their findings lend support to the claim that using only the threshold to distinguish between two states may not yield a stable result. For instance, sometimes the test subject has a hard time sustaining the concentrated state in long intervals, even though the subject is still staring at the blinking light (Chen et al., 2014) . In order to make more accurate classifying result, they decided to include two other criteria; (Chen et al., 2014).
“The first criteria is that, the algorithm will only classify the attention level as high when the input attention value is larger than 90% of the classifying point. In this case, input attention value will
17
still be considered as high, even if it drops below the classifying point by a little bit. Otherwise, the input attention value will be considered as low attention level. The second criteria is that, if the user is at the concentrated state originally, two consecutive low attention inputs will change the state from concentrated to not concentrated. This criteria address the problem of when the user only has a short instance when they are unable to sustain the concentrated state, but they are still trying to do so and shortly recover after that instance.”
During the experiments, they noted several important consequences; one of them is, if the user fully staring at the bulb at the training process, the classifying point will be high value which makes hard to switch concentrated state in order to control which requires more attention. Another consequence is that it is hard to switch not concreted state from concentrated state. They stated that, it will take at least two seconds to change the state because the algorithm requires two low attention levels to be considered as not concentrated (Chen et al., 2014)
To illustrate the idea for having multiple commands, they tried to utilize Event Related Potentials(ERP) which is brain response to events such as cognitive, specific sensory or motor events. In order to differentiate band powers to measure ERP, they used Naïve Bayes classifier which is a probabilistic classifier based on determining current classification using previous classifications. With this approach, they faced some challenges about expecting what correlation will have with one sensor EEG. That is, they claimed the reason of Naïve Bayes classifier failed will be unclear because the uncertainty of whether it is caused by having only one sensor or they did not have big enough data. They realized that in order to improve accuracy, they have needed much more number of experiments and dataset.
The findings from the research illustrate how NeuroSky can be used in order to control robotic car. So far, they were able to turn LED light on and off with analysing alpha waves and attention values. In order to control robotic car, they predicted that attention value is not enough because there needed multiple commands rather than switching on/off. They concluded the challenges of using NeuroSky is that it only has one sensor and due to the its placement, it is hard to detect ERP signals in FP1. Another challenge about NeuroSky is, that the sample rate is fixed at 512 Hz, calculated values
18
outputted per second which is not fast enough in case of analysing and minimizing time delays in the system. Therefore, their findings made conclusion that if more commands needed rather than on/off or move/stop, they need EEG headset with multiple sensors placed on multiple areas of brain.
Brainwave Based Authentication
EEG based authentication is another possible consequence of extracted brainwave signals which could give unique information about each people. The thesis by (Fladby, 2008) serves a great and comprehensive introduction about extracting EEG signals in order to differentiate users, basically authentication of users. In (Fladby, 2008) first it examined two methods named Dynamic Time Warping(DTW) and feature extraction in order to see possibility of distinguishing clients and tasks based on EEG signals. It is noted that due to the SDK and EEG device limitation, NeuroSky MindWave, it is not possible to experiment Event Related Potentials(ERP) because device do not provide enough information and necessary functions. The equipment used in the work of (Fladby, 2008) is the first version of MindWave device which runs with 5v device and uses serial port to send signals to computer. (Also , the literature on (Fladby, 2008) mentions that placement of MindWave which is Fp1 gives an idea about subconscious thinking and personality such as everyday planning, decision making, emotions, social- and moral reasoning)
One of the first step of constructing experiment presented in (Fladby, 2008) is deciding tasks which will be performed during analysis. The collected data appears to suggested that the tasks are not compatible with experiments because in anomalies occurs easily when the user is talking. They concluded eight tasks can be used for experiments as means of authentication that can be considered subconscious nature of tasks at FP1. Eight tasks used during are (Fladby, 2008) :
19
task2 Color - client is told to think about the red color task3 Rotate - client is told to mentally rotate a house
task4 Password - client is told to think about the password “BrainWaveS” task5 Music - client is told to think about a song they know
task6 Words - client is told to generate random words in their native language
starting with the letter “M”.
task7 Count - client is told to count upwards in their native language, fast and
starting with 1.
task8 Read - client is told to read from a provided random text.
Table 2.2 Eight tasks used in experiments
They stated that all of eight tasks are easy to perform but it is hard to user get concentrated on specific task in time. The EEG signals sampled frequency at 128 Hz. Twelve clients were used during experiments with varying age range from 20-45. Also, clients used in experiments selected both right and left handed because the main purpose of experiments was to deal with signal matching rather than classification. For each client, experiments done by three sessions in which each of tasks was recorded 3 times lasting 20 seconds with short breaks. Approximately, each participant experimented three sessions with total 40 minutes. During experiments, they used NeuroView application which comes with NeuroSky SDK to record signals with N sample. Also, they only recorded raw data in a text file which contains two columns separated with a semicolon as shown in Figure 2.6 .
20
Each text file is named in the form of
<clientId>_<task>_<session>_<recordingNr>.s<type> Each task was recorded 3 times for 30 seconds in each session which is equivalent 72 records for each client. After all experiment finished, they gathered 864 signals totally.
For the signal processing part, they used first 16 seconds with 2048 sample because they concluded that it took few seconds to concentrate on specific task therefore they removed the first 4 seconds from each record. In order to differentiate frequency bands with names, they used Discrete Fourier transform (DFT). As a result, they obtained six frequency bands Delta, Theta, Alpha, Beta -Low, Beta-High and Gamma. After getting six frequency bands, they used their own filtering based on Inverse Fast Fourier Transform (IFFT) to remove to frequency domain above 50 Hz. For the feature extraction, they used 25 feature for each signal. Features used in experiments are shown in Table 2.3.
feature1 MSV - Mean sample value
feature2 ZCR - Zero Crossing rate
feature3 VAZ - Values above zero
feature4 PF - Peak Frequency
feature5 PFM - Peak Frequency Magnitude
feature6 MSP - Mean spectral power
feature7 MPA - Mean phase angle
feature8 Pdelta - Delta band power
feature9 PFdelta - Delta band peak frequency
feature10 PFMdelta - Delta band peak frequency magnitude
feature11 Ptheta - Theta band power
feature12 PFtheta - Theta band peak frequency
feature13 PFMtheta - Theta band peak frequency magnitude
feature14 Palpha - Alpha band power
feature15 PFalpha - Alpha band peak frequency
feature16 PFMalpha - Alpha band peak frequency magnitude
21
feature18 PFbetaLow - BetaLow band peak frequency
feature19 PFMbetaLow - BetaLow band peak frequency magnitude
feature20 PbetaHigh - BetaHigh band power
feature21 PFbetaHigh - BetaHigh band peak frequency
feature22 PFMbetaHigh - BetaHigh band peak frequency magnitude
feature23 Pgamma - Gamma band power
feature24 PFgamma - Gamma band peak frequency
feature25 PFMgamma - Gamma band peak frequency magnitudeype>
Table 2.3 Features used in experiments (Fladby, 2008)
After collecting data and constructing features, they created struct in MatLab which will hold all information about signal like below:
signali = (clientj; taskk; sessionm; recn; featureo)
where i, j, k, m, n and o to refer a signal consisting of client, task, session, recording, and features respectively.
In the analysis part of signals, at the first step, they calculated minimum, maximum, mean and standard deviation of each feature and they concluded that the EEG signal activity in delta and gamma is stronger than the others. At the second step, they checked whether their samples and features follow a normal distribution or not. To do so, they used chi-square goodness-of-fit-test. After these calculation, they concluded and guided by idea that signals are more stable in the mid-range frequency bands like theta alpha, beta Low and beta High. Likewise, they concluded for each client that only 35 feature test out of 300 had a probable normal distribution (Fladby, 2008).
After analysis part, in order to see how features related with each other they computed correlation functions. They stated that if two or more features have a high correlation values, it takes advantage of creating a distance metric. They found that
22
there is a high correlation between beta Low and beta High for all 12 clients at all. Also, they concluded that most of clients had highest activity in the delta band.
The work of (Fladby, 2008) claims the hard part is finding similarity of two EEG signals. They used distance metric to find similarities of two sequence with four categories. They stated as hardest part because there is no best way to compute distance metric for calculating best results. Subsequently, they calculated dynamic time warping based distance metric to find matching patterns with warping techniques with simulating human ability. They used DTW algorithm which has two input in time series and one output. Since it took long time to calculate the distance between all signals, they instead calculated best case scenario which depends best performance in each session per client by calculating best value of distance between three recordings of each task
To sum up their work, they concluded that the activity of EEG signals is strongest in the delta band. Because they observed sudden improvements in the signal when recording, they decided to use Dynamic Time Warping technique which did not give them good results. They only achieved EER of 34.30% in an unrealistic “best-case-scenario” with selecting best performing result which should apply lower EER values for DTW. They overcome this problem by transferring signals to frequency domain together with extracted features from domains. Due to the fact that they did not find any correlation between a specific task and feature, they are unable to distinguish tasks. The best EER result they found is 34.41% with all-vs-all comparison is using feature based metric. The major deduction they made stated as follows:
“We have to ask ourselves, why do we get an EER lower than 50% (the worst case)? Is it because we actually detect client specific similarities and differences, or is it in fact session based such that two consecutive signals are similar because of the equipment? The results strongly suggest that the similarities are session based. The reason is that one sensor with only 128Hz sample frequency fails to extract enough client specific information in order to extract features with high entropy. The only reliable information we can extract with one sensor is the power in each frequency band, which is not enough to distinguish between clients or tasks.” (Fladby, 2008).
23
This research was concerned with using NeuroSky MindWave device in authentication application; however, the results showed us by using only one sensor is not good enough to construct client based authentication with tasks in real life. The findings from the research show that the limitations of one sensor EEG device, more specifically MindWave NeuroSky, as means of client and task based authentication systems.
24
3. Brainwaves
What is Electroencephalography (EEG)
Electroencephalography (EEG) is an electrophysiological monitoring method to record electrical activity of the brain. It is typically non-invasive, with the electrodes placed along the scalp, although invasive electrodes are sometimes used in specific applications. EEG measures voltage fluctuations resulting from ionic current within the neurons of the brain. In clinical contexts, EEG refers to the recording of the brain's spontaneous electrical activity over a period of time, as recorded from multiple electrodes placed on the scalp. Diagnostic applications generally focus on the spectral content of EEG, that is, the type of neural oscillations (popularly called "brain waves") that can be observed in EEG signals.
History of EEG
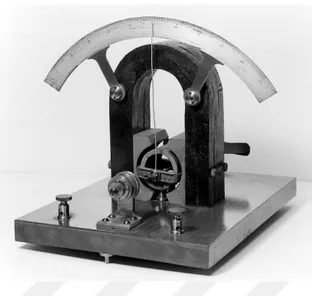
Milestones of EEG devices started with the introduction of galvanometer. Galvanometers were the first instruments used to detect and measure small amount of electric currents(Donald and Silva, 2010). It also shows the direction of flow of electric current. Sensitive galvanometers were used to detect signals from long submarine cables, and to discover the electrical activity of the heart and brain.("Galvanometer," 2016). The introduction of the galvanometer has been associated chiefly with the name of Nobili in Florence; this instrument was refined in 1858 by William Thompson (Lord Kelvin) in England. These galvanometers would faithfully demonstrate continuous electrical currents and their variations in intensity but failed in the detection of instantaneous electrical phenomena.(O'Leary and Goldring, 1976)
25
Figure 3.1 An early D'Arsonval galvanometer showing magnet and rotating coil
After foundation of galvanometer, two scientists Carlo Matteucci from University of Bologna and Emil Du Bois-Reymond in Berlin made a research and they constructed main components of an electro physiologically based physiology of the nervous system.
“Matteucci began in 1830 a series of experiments which he pursued until his death in 1865. Using a sensitive galvanometer of Leopoldo Nobili, he was able to prove that injured excitable biological tissues generated direct electrical currents, and that they could be summed up by adding elements in series, like in Alessandro Volta’s (1745-1827) electric pile. Thus, Mateucci was able to develop what he called a "rheoscopic frog", by using the cut nerve of a frog’s leg and its attached muscle as a kind of sensitive electricity detector. His work in bioelectricity influenced directly the research developed by Emil du Bois-Reymond (1818–1896), a student of the great German biologist Johannes Peter Müller (1801–1858) in Berlin, who tried the duplicate Matteucci’s experiments and ended up discovering the nerve's action potential. In 1844, for these studies, Matteucci was awarded with the Copley medal by the Royal Society.”("Carlo Matteucci," 2016)”
Electrical Activity of Brain
The scientist named Richard Caton (1982) shown in Figure 3.2 who was interested in electrophysiologic phenomena discovered the electrical activity of brain and lead up to discover Alpha waves by Hans Berger.
26
Figure 3.2 Richard Caton (Wikipedia, 2016b)
In July 1875 Caton reported to the British Medical Association in Edinburgh (Caton, 1875) that he had used a galvanometer to observe electrical impulses from the surfaces of living brains in animal subjects.(Smith, 1970) (Finger, 1994). After Caton died, Hans Berger cited Caton’s word emphasizing his importance on the report of discovery of Alpha waves. He wrote in (Berger, 1929; Finger, 1994):
“Caton has already published experiments on the brains of dogs and apes in which bare unipolar electrodes were placed either on the cerebral cortex and the other on the surface of the skull. The currents were measured by a sensitive galvanometer. There were found distinct variations in current, which increased during sleep and with the onset of death strengthened, and after death became weaker and then completely disappeared. Translated by Cohen, 1959.”
Human EEG Studies
In 1924 the milestones of capturing human EEG were started. Hans Berger (1873–1941) in Figure 3.3 recorded the first human EEG in 1924 as shown in Figure 3.4. Expanding on work previously conducted on animals by Richard Caton and others, Berger also invented the electroencephalogram (giving the device its name), an invention described "as one of the most surprising, remarkable, and momentous developments in the history of clinical neurology".(Millet, 2002)
27
Figure 3.3 Hans Berger (Neurociencias, 2016)
At those days, there were several patients with skull bone defects due to World War I, in Germany and those patients were used for analysing brain waves. Using Edelmann string galvanometer, oscillations were observed and it was assumed it was coming from underlying brain. After one year, Berger realized that skull defects of brain did not provide advantage for getting brainwaves because of thickening of Dura, postoperative and adhesions. He found it is better to use scalp which interacts skull. With using double-coil galvanometer, he recorded alpha waves in a good way between 1926 and 1929. Although he was recorded alpha waves, he was in doubt for accuracy of recorded brainwaves.
28
Figure 3.4 The first human EEG recording obtained by Hans Berger in 1924. The upper tracing is EEG, and the lower is a 10 Hz timing signal (cassiopaea.org, 2013).
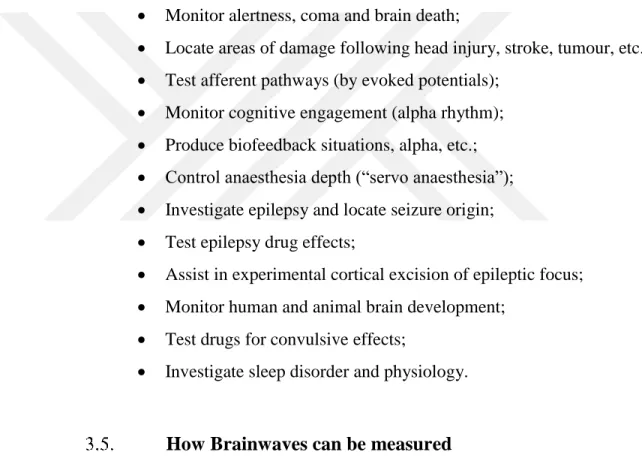
Ever since from those years, depending on research by (Adelman and Smith, 1987) applications of EEG on humans and animals include the areas below:
Monitor alertness, coma and brain death;
Locate areas of damage following head injury, stroke, tumour, etc.; Test afferent pathways (by evoked potentials);
Monitor cognitive engagement (alpha rhythm); Produce biofeedback situations, alpha, etc.; Control anaesthesia depth (“servo anaesthesia”); Investigate epilepsy and locate seizure origin; Test epilepsy drug effects;
Assist in experimental cortical excision of epileptic focus; Monitor human and animal brain development;
Test drugs for convulsive effects;
Investigate sleep disorder and physiology.
How Brainwaves can be measured
As per definition of EEG, it is a medical imaging technique which reads electrical activity of a brain with conducting metal electrodes which touches the skin. In medical usage, several electrodes placed on the scalp with varying numbers as 64, 128 or more. The more electrodes put on scalp the more information could be gathered during recording and analysis. Conductive gels are widely used together with scalp in order to improve quality of conduction.
29
As our brains have electrical activity as means of current flows when the neurons are activated, EEG measures that current which is flowing throughout synaptic excitations of the dendrites. Differences of electrical potentials are caused by summed postsynaptic graded potentials from pyramidal cells that create electrical dipoles between soma (body of neuron) and apical dendrites (neural branches). Brain electrical current consists mostly of Na+, K+, Ca++, and Cl- ions that are pumped through channels in neuron membranes in the direction governed by membrane potential (Atwood and MacKay, 1989). Since electrical signals go through in the brain and faces with skull and other things, the signals can be weaker. In order to measure signals with EEG, electrodes on the scalp hugely amplified in order to be catch.
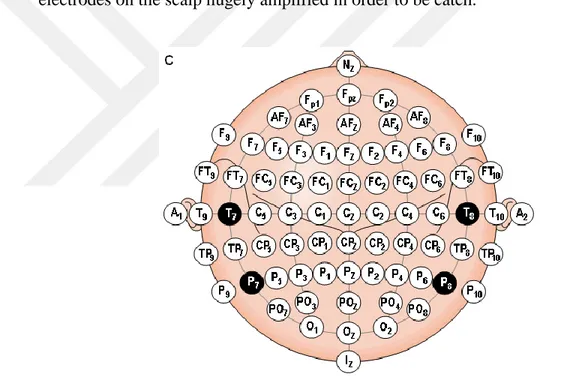
Figure 3.5 Example of placement of electrodes (Plonsey and Malmivuo, 1995)
Figure 3.5 shows several electrode positions on the head in which names has abbreviation’s such as A = Ear lobe, C = central, Pg = nasopharyngeal, P = parietal, F = frontal, Fp = frontal polar, O = occipital. NeuroSky MindWave is placed only at Fp1 region of head that is the Frontal lobe of the brain.
EEG devices measure signals coming from brain part called cerebrum which consist of left and right cerebral hemispheres called cerebral cortex. Cerebrum
30
considered as a part of the central nervous system and largest part of human brain. The nervous system, it is the centre of movement initiation, conscious awareness of sensation, complex analysis, and expression of emotions and behaviour. Cerebral cortex is divided into 4 parts mainly called “lobes” and each of the lobes responsible for different tasks as described below (Schmidler, 2016) and Each of lobes can be seen in Figure 3.6 :
The frontal lobe extends from the tip of the front of the hemisphere to the central sulcus. The back areas of the frontal lobe specialize in motor functions, including language and voluntary movement; the front areas are involved in learning, planning and other higher psychological processes like our personality and behaviour.
The occipital lobe is at the back of the hemisphere and is involved in interpreting visual stimuli, that is, what we see.
The parietal lobes are at the top and outside areas between the occipital lobe and the frontal lobe and is involved in sensory functions of the skin including pain, temperature, and touch. It also interprets size, shape, distance, vibrations and texture. Other areas are also important in cognitive and intellectual processes.
The temporal lobe controls the hearing centers, language
comprehension, storing and recalling memories and related areas including some speech centers. Other areas of the brain also affect memory. The front and bottom areas of the temporal lobe are involved in smell and functions of the limbic system.
31
Figure 3.6 Lobes of cerebral cortex (Sebastian023, 2012)
Brainwave Classification
EEG devices capture brainwaves as raw data which includes all frequency bands. Each of frequency band represents specific characteristics of current condition of user that is unique state of some behaviour such as feeling tired, sleepy etc. To differentiate each of frequency bands most of the time Fast Fourier Transform(FFT) method is used; that is basically converts a signal from its original domain to a representation in the frequency domain(Wikipedia, 2016a). NeuroSky MindWave Mobile also uses FFT algorithm on the TGAM chip providing each frequency band with NeuroSky SDK. Each of frequency band described in Table 3.1 and constructed from (Hillman, 2014) :
Wave Frequency Meaning
Gamma waves
40 Hz to 100Hz
These are involved in ‘higher processing’ and are the waves we want to generate when learning new information or engaging in sports. Gamma waves are also associated with communication across different areas of the brain. Those with learning disabilities will often have lower levels of
32
gamma waves than average, whereas too much can lead to anxiety and stress. Gamma waves are also ideal for binding the senses making us highly alert and on edge. Meditation has been shown to help encourage gamma waves.
Beta Waves
12Hz to 40Hz
Beta waves are high frequency and low amplitude: meaning they are rapid and shallow. These types of waves are similar to gamma waves, being involved in learning, focusing and thinking logically, though they are somewhat less intensive when compared to gamma waves and occur at 12Hz-40Hz. Again they can cause stress in high amounts, whereas low amounts might be associated with daydreaming, ADHD or low motivation. You can increase beta waves by using stimulants such as energy drinks, caffeine or nootropics. Beta waves can also be broken down into three categories of their own: low-beta (12-15Hz), beta (15-22Hz) and high-beta (22-38Hz). These are also known as Beta1, Beta2 and Beta3 respectively. The lower ends of beta brainwaves are the most common and tend to dominate our waking lives. While high frequencies may increase focus and awareness, they reduce creativity and emotional awareness and they drain us of energy.
Alpha Waves
8Hz to 12Hz.
Alpha waves are the slow we experience in normal waking life when we’re relaxed or absent minded. These are the brainwaves likely present when you unwind with a book or get ready to fall asleep, occurring at 8Hz to 12Hz. Alcohol, marijuana and antidepressants can all also contribute to alpha waves. Generally, more alpha waves mean fewer beta and gamma waves and vice versa.
While we might normally associate alpha waves with relaxation, they can also be associated with states of productivity, awareness and even ‘flow states’ (which border alpha and theta waves).
Theta Waves:
4Hz to 8Hz
Theta waves occur between 4Hz and 8Hz and are associated with daydreaming and sleep. Theta waves are also present during trance, meditative or hypnotic states, as well as “hypnagogia” which is the period just before we fall asleep and certain restorative points during sleep. Theta brainwaves are thought to contribute to creative thoughts, as our brain explores loosely connected ideas and topics in an unstructured way.
Delta Waves:
0.5 to 3Hz Occurring between 0.5 and 3Hz, delta brainwaves are the lowest frequency recorded in human beings. They also have high amplitude. Delta waves are associated with the deepest levels of (dreamless) sleep, as well as intensive meditation.
33
They suspend our awareness of the external world and are thought to be connected to empathy.
34
4. MindWave Mobile
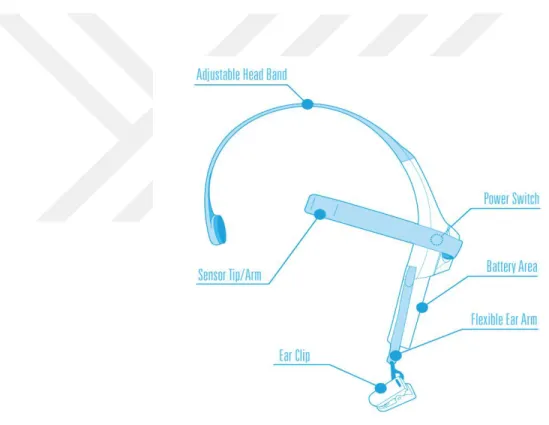
MindWave Mobile is the low-cost portable EEG device produced by NeuroSky Company that will capture common brain waves as well as raw data and eSense values. It basically consists of headset, and ear-clip and a sensor arm. Ear-clip basically used for grounding EEG electrode which is above the eye, more basically of the FP1 position. MindWave Mobile headset parts are shown in Figure 4.1. MindWave Mobile uses single AAA battery.
Figure 4.1 MindWave Mobile headset (Neurosky.com, 2016)
Technology Overview and details
MindWave Mobile uses ThinkGear ™ technology, which measures the analogue electrical signals, commonly referred to as brainwaves, and processes them into digital signals. It includes the sensor that touches the forehead, the contact and reference points
35
located on the ear pad, and the on-board chip that processes all of the data and provides this data to software and applications in digital form. Both the raw brainwaves and the eSense Meters (Attention and Meditation) are calculated on the ThinkGear™ chip.
Some technical details about MindWave Mobile are listed below (Neurosky): Uses the TGAM1 module
Automatic wireless pairing
Single AAA Battery (Not included) 8-hours battery run time
Bluetooth v2.1 Class 2 (10 meters range). Bluetooth dongle not included. Static Headset ID (headsets have a unique ID for pairing purposes) iOS and Android support
MindWave Mobile measures: Raw-Brainwaves
Processing and output of EEG power spectrums (Alpha, Beta, etc.)
Processing and output of NeuroSky proprietary eSense meter for Attention, Meditation.
EEG/ECG signal quality analysis (can be used to detect poor contact and whether the device is off the head)
Bluetooth properties of MindWave Mobile listed below: BT Version: 2.1
BT Output Power: Class 2 BT Minimum Voltage: 1.0V BT Range: 10m range
BT Power Consumption: 80mA (when connected and transmitting) Low Battery Indicator 1.1V
36 UART Baudrate: 57,600 Baud
4.1.1. Bluetooth Pairing
MindWave Mobile uses Bluetooth connection in order to communicate with computer, tablet, phone etc. Any device that wants to communicate with MindWave Mobile headset, it should “paired” using Bluetooth protocol rather than connecting MindWave Mobile directly. According to MindWave Mobile : User Guide (Neurosky, 2015), Bluetooth pairing with MindWave Mobile should be following:
Put the MindWave Mobile headset into "Pairing Mode" by holding the On/O switch past the "On" position for 3 seconds.
o Release switch when the light starts flashing blue.
o If you continue for more than 6 seconds, the MindWave Mobile headset will clear all previously remembered pairings.
Refer to the Bluetooth pairing instructions that came with your iOS, Android, PC, or Mac device to search for and pair to the MindWave Mobile headset. If prompted, enter "0000" for the authentication key.
MindWave Mobile headset can "pair/remember" up to 3 computers/tablets/phones at the same time.
If MindWave Mobile paired and connected properly, it should flash blue light shown in Figure 4.2.
37
Figure 4.2 MindWave Mobile successful connection
ThinkGear™ Chip Details
MindWave Mobile device comes up with ThinkGear™ chip that provides interface to capture user brainwaves. ThinkGear™ is basically the core module of MindWave Mobile device. As shown in Figure 4.1 , sensor tip touches user’s face and ear clip attached to ear for grounding. ThinkGear™ chip inside MindWave Mobile has the ability to process all of the data that comes from sensor as well as capturing raw brainwaves. Additional data like Attention and Meditation values (which are called “eSense Meters”) are also calculated in ThinkGear™ chip which differs MindWave Mobile device from other portable EEG devices.
MindWave Mobile uses MindSet™ communication protocol in conjunction with ThinkGear™ which basically describes:
How to connect to the Bluetooth serial data stream to receive a stream of bytes.