554
Copyright © 2018 by Academic Publishing
House Researcher s.r.o.
All rights reserved.
Published in the Slovak Republic
European Journal of Contemporary Education
E-ISSN 2305-6746
2018, 7(3): 554-565
DOI: 10.13187/ejced.2018.3.554
www.ejournal1.com
WARNING!
Article
copyright.
Copying,
reproduction, distribution, republication (in whole
or in part), or otherwise commercial use of the
violation of the author(s) rights will be pursued on
the basis of international legislation. Using the
hyperlinks to the article is not considered a violation
of copyright.
Investigation of Organizational Silency Levels by Teachers According to Some Demographic Variables
Gizem Saygili a , *
a Karamanoğlu Mehmetbey University, Turkey Abstract
In this research, it was aimed to examine the organizational silence levels of primary and secondary school teachers according to some demographic variables. A total of 609 teachers, 309 women and 300 men, who were teaching at primary and secondary schools participated in the research. The Organizational Silence Scale developed by Van Dyne et al. (2003) and adapted to Turkish by Erdoğan (2011) was used in determining the level of organizational silence that teachers had. SPSS 22.0 data analysis program was used for statistical analysis of the data obtained in the research. Descriptive statistics were used to calculate teachers' demographics and the scores they gained from the scale. MANOVA analysis, which is a parametric analysis method, was used to compare the scale scores according to the demographic characteristics of the teachers. The level of significance in the MANOVA analyzes was determined as p <0.05. At the end of the research, it was determined that the organizational silence levels of the teachers were "moderate". When analyzed according to demographic variables, it was determined that organizational silence levels of teachers did not show statistically significant differences according to school type, education status, settlement type, duty type (teacher/manager status) and branch variables (p >0.05). On the other hand, it was determined that organizational silence levels of the teachers showed statistically significant differences according to gender, marital status, age group and occupational seniority variables (p <0.05). As a result, it was found that the demographic characteristics partially affected the teachers' perceptions of organizational silence, and the findings were in accordance with the literature.
Keywords: Education, teaching profession, organizational silence. 1. Introduction
According to the Turkish Language Association, the silence is "to be silent". To be silent means to be silent and to remain silent. Occupational silence, silence and silence are used
* Corresponding author
555
synonymously in working life. According to psychology science, closing into silence is generally regarded as a negative situation like social silence in sociology, like the sign of unspecifiedness (Çakıcı, 2007: 147). Organizational silence is the situation in which occupants do not react jointly and deliberately to problems or issues encountered in organizations; Or do not share their feelings and thoughts with others "(Ülker, Kanten, 2009: 111). According to another definition, organizational silence is defined as "deliberately suppressing the thoughts, feelings and knowledge of employees in order to improve their jobs and the institution they work with" (Kahveci, Demirtas, 2013: 178).
Although organizational voice is an important force in the change of organizational performance (Bowen, Blackmoon, 2003; Burris and Bartel, 2014: 1013), employees in organizational structure generally prefer to be quiet (Beheshtifar et al., 2012; Milliken et al., 2003: 1453; Premeaux and Bedeian, 2003: 1537; Van Dyne et al., 2003: 339; Panagi et al., 2012: 735; Eriguc et al., 2014: 1359). Organizational silence emerges when employees can not speak freely about the organization (Bowen, Blackmoon, 2003). Organizational silence is a common problem in organizations (Pinder, Harlos, 2001: 331) and there are many factors that cause organizational silence (Kahveci, Demirtas, 2013: 169). In general, the factors that cause organizational silence are divided into various classes such as individual, social (Henriksel, Dayton, 2006: 1539), administrative and organizational factors (Karaca, 2013: 38). Managerial attitudes play an important role in the organizational elements that cause organizational silence. Evaluating the silence as approval, consent or satisfaction increases the silence in organizations (Çakici, 2007: 160). According to Swords and Harbalıoğlu (2014: 330), there are fear and worries among the workers at the beginning of the elements that cause organizational silence. In the research carried out by Çakici (2008: 117), it was determined that organizational silence was mainly caused by administrative and organizational factors, work related fears, lack of experience, fear of isolation and fear of harming relations.
Organizational silence brings some problems in managerial, individual and social aspects (Şimşek, Aktas, 2014: 123), organizational silence has some consequences on both organization and employees (Bagheri et al., 2012: 51). It has been pointed out that organizational silence causes many negative effects especially on employees (Shojaie et al., 2011: 1733). According to the model developed by Morrison and Milliken (2000), at the beginning of the organizational results of silence, the intellectual contributions of employees are not used, avoid negative feedback, filter information and become unresponsive to problems. At the beginning of the results of the silence, it is stated that the individual feels that he/she is feeling weak because he/she is openly talking about his/her problems and worries about his/her workplace, such as lack of loyalty, belongingness, trust, appreciation and support, lack of job satisfaction and intention to leave work. Again according to the developed model, it is emphasized that the silence in the organizations is the lack of feedback, information and alternative opinions and at the same time the employees are preparing the motivation for lack of motivation (Akt: Barçın, 2012: 34).
Despite the fact that silence is common in organizations (Alparslan, Kayalar, 2012: 136; Şimşek and Aktaş, 2014: 123), there is not enough research in the literature on the structure, components and effects of organizational silence (Yapıcı, 2007: 145; Vakola, Bouradas, 2005: 441; Constructor, 2008: 118). For this reason, as organizational silence is investigated, different aspects of organizational silence will be revealed (Kahveci, Demirtas, 2013: 170). As a result of the literature review, it has been seen that the studies on the organizational silence levels of the teachers, especially in the educational institutions, are very limited in the literature. A good knowledge of the factors affecting teachers' organizational silence levels will help to prevent organizational silence formation, as well as to minimize the negative effects of organizational silence in teachers. According to Kahveci and Demirtaş (2013: 168), teachers' silence and the inability to express their problems comfortably prevent them from exhibiting high performance in business life. This situation underlines the fact that the school objectives can not be achieved adequately. Therefore, the factors that affect teachers' perceptions of organizational silence are also important in terms of achieving the aims of the education system. In this study, it was aimed to examine the organizational silence levels of the teachers according to some socio-demographic variables.
556
2. Materials and methods Research model
In this study, a scanning model was used from descriptive research models. As is known, screening researches are descriptive studies aimed at determining the characteristics (age, gender, marital status, educational status, etc.) of research subjects of large sample groups.
The Universe and Sampling of the Study
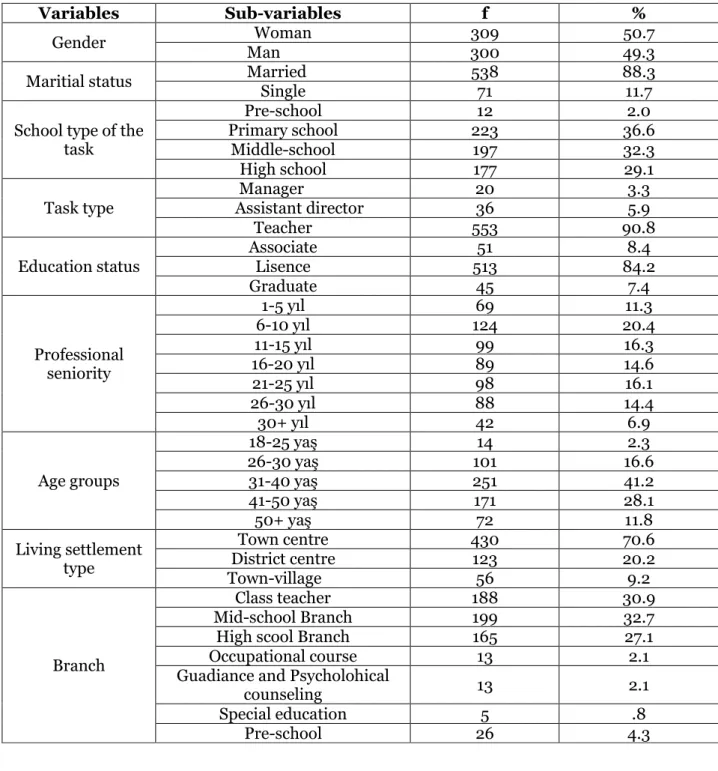
The universe of the research is composed of primary, secondary and high school teachers in the city of Isparta. The sample group of the study consisted of 609 teachers, including 309 women and 300 men, who were working in primary, secondary and high school in Isparta in the academic year of 2016-2017. Findings related to the demographic characteristics of the teachers of the study sample group are presented in Table 1.
Table 1. Frequency and Percentage Distributions of Participants Demographic Information
Variables Sub-variables f %
Gender Man Woman 300 309 49.3 50.7 Maritial status Married Single 538 71 88.3 11.7 School type of the
task
Pre-school 12 2.0
Primary school 223 36.6
Middle-school 197 32.3
High school 177 29.1
Task type Manager Assistant director 20 36 3.3 5.9
Teacher 553 90.8
Education status Associate Lisence 513 51 84.2 8.4
Graduate 45 7.4 Professional seniority 1-5 yıl 69 11.3 6-10 yıl 124 20.4 11-15 yıl 99 16.3 16-20 yıl 89 14.6 21-25 yıl 98 16.1 26-30 yıl 88 14.4 30+ yıl 42 6.9 Age groups 18-25 yaş 14 2.3 26-30 yaş 101 16.6 31-40 yaş 251 41.2 41-50 yaş 171 28.1 50+ yaş 72 11.8 Living settlement type Town centre 430 70.6 District centre 123 20.2 Town-village 56 9.2 Branch Class teacher 188 30.9 Mid-school Branch 199 32.7
High scool Branch 165 27.1
Occupational course 13 2.1
Guadiance and Psycholohical
counseling 13 2.1
Special education 5 .8
557
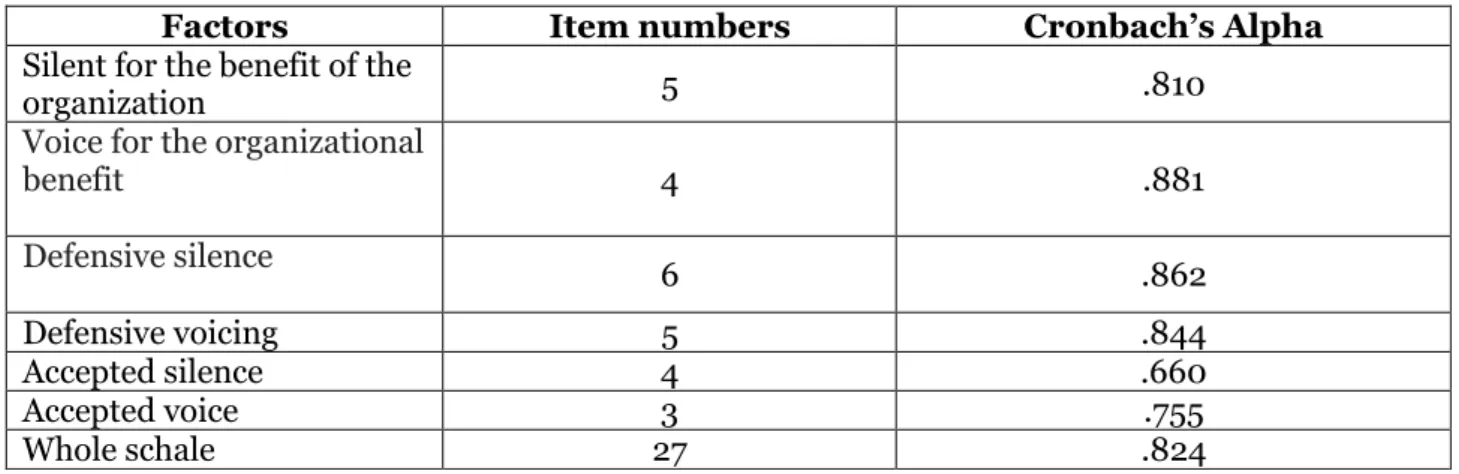
Data Collection ToolSurvey was used as data collection tool in the research. The first part of the questionnaire used is a personal information form. The personal information form aims to determine the demographic characteristics of the participants. In the second part of the questionnaire used, there is a scale aiming to determine organizational silence levels of the participants. "Organizational Silence Scale" was used in determining the organizational silence levels of the teachers participating in the research. The scale developed by Van Dyne and others (2003) was adapted to Turkish by Erdoğan (2011). The scale consisting of a total of 27 items is of the likert type of 5 and responses to scale items are rated in the range of I definitely do not participate (1) and strongly agree (5) (Tayfun, Çatır, 2013: 121). Besides, there are 6 sub-dimensions related to organizational silence on the scale. The sub-dimensions are the silence for the benefit of the organization, the voice for the benefit of the organization, the silence for defensive purposes, the voice for defense, the accepted silence and the accepted voice. The reliability coefficients of sub scale of organizational silence scale and total scale score in the survey are presented in Table 2.
Table 2. Results of Reliability Analysis on Organizational Silence Scale Factors
Factors Item numbers Cronbach’s Alpha
Silent for the benefit of the
organization 5 .810
Voice for the organizational
benefit 4 .881 Defensive silence 6 .862 Defensive voicing 5 .844 Accepted silence 4 .660 Accepted voice 3 .755 Whole schale 27 .824
As shown in Table 2, the reliability coefficient for the entire organizational silence scale, 824, the reliability coefficients for the scale subscales vary from 660 to 881. According to these findings, it is seen that the reliability coefficients of the scale and subscales used in the research are high.
Statistical analysis
SPSS 22.0 program was used in the analysis of the obtained data. MANOVA analysis, which is a parametric analysis method, was used to compare the scale scores according to the demographic information of the participants, since the data related to the Organizational Silence Scale showed normal distribution. The level of significance in the MANOVA analyzes was determined as p <0.05. Descriptive statistics were used to determine frequency and percentage distributions of demographic information of participants and to determine the mean and standard deviations of scale scores.
Limitation of the study
This study limited the group of 609 teachers, who were working in primary, secondary and high school in Isparta in the academic year of 2016-2017.
558
3. Results
Table 3. Descriptive Statistics of Participants' Organizational Silence Scores
Factors N X Ss
Silent forthe benefit of the
organization 609 3.43 .744
Voice for organizational
benefit 609 3.99 .816
Defensive silence 609 2.19 .817
Defensive voicing 609 2.11 .881
Accepted silence 609 2.42 .797
Accepted voice 609 3.07 .760
When the Table 3 is examined, it is seen that the participants have a moderate level of silence and organizational benefits for the organization, moderate defense scores, defensive voice and accepted silence scores, and accepted voice scores are moderate.
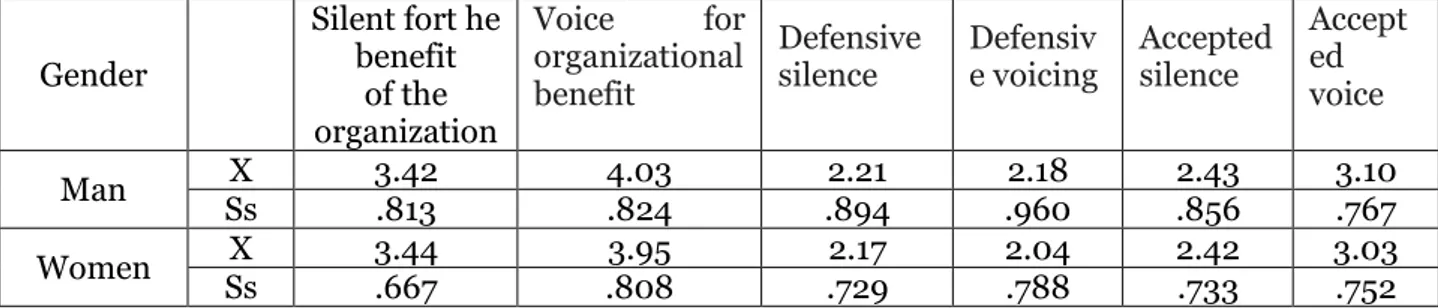
Table 4. MANOVA Table for Comparison of Participants' Organizational Silence Situations by Sex
Gender Silent fort he benefit of the organization Voice for organizational benefit Defensive
silence Defensive voicing Accepted silence
Accept ed voice
Man Ss X 3.42 .813 4.03 .824 .894 2.21 .960 2.18 2.43 .856 3.10 .767 Women Ss X 3.44 .667 .808 3.95 .729 2.17 2.04 .788 2.42 .733 3.03 .752
As shown in Table 4, there was no statistically significant difference between the
organizational silence cases according to the gender of participants (Wilks' Lambda = 0.987; F (6.602) = 1.311; p >0.05)
Table 5. MANOVA Table on Participants' Comparisons of Organizational Silence Situations According to Their Marital Status
Marritial statutes Silent fort he the benefit of the organizati on Voice for organizational benefit Defensive
silence Defensive voicing Accepted silence Accepted voice
Married Ss X 3.43 .754 3.99 .819 2.20 .834 .883 2.10 2.45 .801 3.09 .767 Single Ss X 3.45 .662 3.97 .799 2.09 .670 2.22 .872 2.20 .734 2.90 .686
As shown in Table 5, there was no statistically significant difference between the organizational silence cases according to the marital status of participants (Wilks' Lambda = 0.973; F (6.602) = 2.776; p >0.05).
559
Table 6. MANOVA Table on the Comparison of the Organizational Silence Situations of the Participants According to Their School Activities
School type Silent fort he the benefit of the organizati on Voice for organizatio nal benefit Defensiv
e silence Defensive voicing Accepted silence Accepted voice
Pre-school Ss X 3.40 .734 3.96 .897 1.99 .757 .968 2.10 2.40 .829 2.83 .785 Primary school Ss X 3.37 .764 3.94 .859 .754 2.15 .864 2.10 .824 2.41 3.06 .763 Midddle school Ss X .708 3.51 .730 4.01 2.20 .857 2.11 .915 .826 2.51 3.07 .763 High school Ss X 3.43 .755 4.03 .849 2.24 .852 .866 2.13 2.35 .722 3.09 .755
As shown in Table 6, there was no statistically significant difference between the organizational silence cases according to the school attended by the participants (Wilks' Lambda = 0.976; F (18.1697) = 0.798; p >0.05).
Table 7. MANOVA Table on Comparing Participants According to Their Tasks of Organizational Silence
Task Silent fort he the benefit of the organization Voice for organization al benefit Voice for organizational benefit Defensive
voicing Accepted silence Accepted voice
Director X 3.34 3.91 2.40 2.46 2.59 3.25 Ss .844 .971 1.039 1.113 .954 .954 Asistant director Ss X 3.23 .647 3.85 .899 2.16 .745 2.20 .927 .970 2.12 2.77 .816 Teacher X 3.45 4.00 2.19 2.09 2.44 3.08 Ss .745 .805 .813 .868 .776 .745
As shown in Table 7, there was no statistically significant difference between organizational silence cases according to the duties of the participants (Wilks' Lambda = 0.971, F (12.1202) = 1.498, p >0.05).
Table 8. MANOVA Table on Comparing Participants' Situations of Organizational Silence According to Their Educational Status
Educationa l status Silent fort he the benefit of the organization Voice for organizational benefit Defensive
silence Defensive voicing Accepted silence Accepted voice
Pre-license Ss X 3.39 .851 3.88 .927 2.25 .778 .998 2.31 2.55 .733 3.07 .671 License Ss X 3.45 .721 4.00 .813 .822 2.19 .870 2.10 .800 2.43 3.07 .772 Graduate Ss X 3.24 .848 4.06 .723 .806 2.16 2.04 .867 2.22 .819 3.01 .726
560
As shown in Table 8, there was no statistically significant difference in organizational silence cases according to the educational status of the participants (Wilks' Lambda = 0.981; F (12.1202) = 0.957; p >0.05).
Table 9. MANOVA Table on Participants' Comparisons of Organizational Silence Situations According to Occupational Ages
Professional seniority Silent for thr benefit of the organizatio n Voice for organization al benefit Defensive
silence Defensive voicing Accepted silence Accepted voice
1-5 yıl Ss X 3.40 .587 4.01 .702 2.22 .678 2.06 .649 2.29 .794 3.05 .657 6-10 yıl Ss X 3.42 .803 4.03 .777 2.01 .682 1.90 .766 2.40 .734 .664 3.11 11-15 yıl Ss X 3.43 .613 3.93 .770 .786 2.12 2.03 .799 2.33 .768 2.99 .825 16-20 yıl Ss X 3.36 .771 3.98 .892 .790 2.15 2.08 .832 2.42 .749 3.00 .762 21-25 yıl Ss X 3.47 .671 3.84 .981 2.27 .921 1.008 2.15 2.43 .736 3.06 .829 26-30 yıl Ss X 3.38 .942 4.10 .781 2.43 .950 1.032 2.39 .938 2.61 3.28 .728 30+ yıl Ss X 3.70 .692 .663 4.12 2.26 .863 2.43 .971 2.56 .925 .840 2.83
As shown in Table 9, the participants 'silence, defensive voice, and accepted silence factor scores differed statistically by occupational seniority, but there was no statistically significant difference in other organizational silence factors according to the occupational seniority of the participants (Wilks' Lambda = 0.890; F (36. 2624) = 1.957; p >0.05).The difference in the defensive silence factor stems from the fact that the scores of the participants with professional seniority 26-30 years were higher than the participants with professional seniority 6-10 years. The difference in defense voice scores is due to the fact that the scores of participants with professional seniority of 26-30 years and occupational seniority of 30+ years were higher than participants with occupational seniority of 6-10 years. The difference in the accepted voice factor is due to the fact that the scores of the participants with professional seniority 26-30 years were higher than the participants with professional seniority 30+ years.
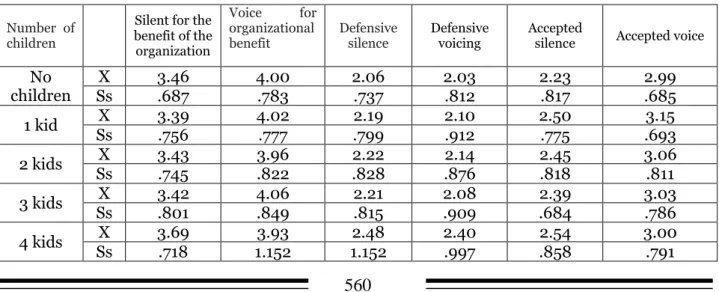
Table 10. MANOVA Table on the Comparison of Participants' Situations of Organizational Silence According to the Number of Children
Number of children
Silent for the benefit of the organization Voice for organizational benefit Defensive silence Defensive voicing Accepted
silence Accepted voice No children Ss X 3.46 .687 4.00 .783 2.06 .737 2.03 .812 2.23 .817 2.99 .685 1 kid Ss X 3.39 .756 4.02 .777 .799 2.19 2.10 .912 2.50 .775 .693 3.15 2 kids Ss X 3.43 .745 3.96 .822 .828 2.22 2.14 .876 2.45 .818 3.06 .811 3 kids Ss X 3.42 .801 4.06 .849 2.21 .815 2.08 .909 2.39 .684 3.03 .786 4 kids Ss X 3.69 .718 1.152 3.93 1.152 2.48 2.40 .997 2.54 .858 3.00 .791
561
As shown in Table 10, there was no statistically significant difference between the organizational silence cases of the participants according to the number of children (Wilks' Lambda = 0.967; F (24.2090) = 0.852; p >0.05).
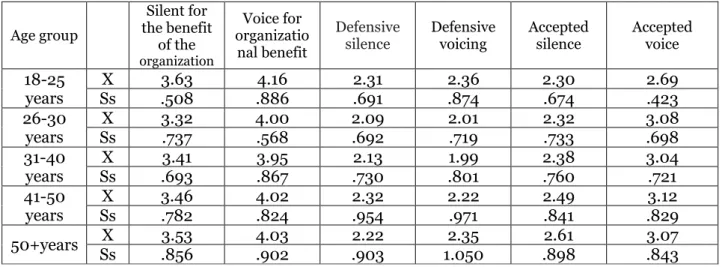
Table 11. MANOVA Table on the Comparison of Participants' Age Groups with Organizational Silence Age group Silent for the benefit of the organization Voice for organizatio nal benefit Defensive
silence Defensive voicing Accepted silence Accepted voice
18-25 years Ss X .508 3.63 .886 4.16 2.31 .691 2.36 .874 2.30 .674 2.69 .423 26-30 years Ss X 3.32 .737 4.00 .568 2.09 .692 2.01 .719 2.32 .733 3.08 .698 31-40 years Ss X .693 3.41 .867 3.95 .730 2.13 .801 1.99 2.38 .760 3.04 .721 41-50 years X 3.46 4.02 2.32 2.22 2.49 3.12 Ss .782 .824 .954 .971 .841 .829 50+years Ss X 3.53 .856 4.03 .902 2.22 .903 1.050 2.35 .898 2.61 3.07 .843
As shown in Table 11, participants' scores for defensive vocalization factor differ statistically by age groups, Wilks' Lambda = 0.935, F (24.2090) = 1.682, p <0.05). However, there was no statistically significant difference in the other organizational silence factors according to the age groups of the participants. The difference in the defensive voice factor is due to the fact that the
scores of the participants in the 50+ age group are higher than those of the participants in the 31-40 age group.
Table 12. MANOVA Table on Participants' Comparisons of Organizational Silence Situations According to Their Place of Residence
Settlement Silent for the benefit of the
organization Voice for organizati onal benefit Defensive silence Defensive voicing Accepted silence Accepted voice City center X 3.43 4.00 2.21 2.13 2.44 3.05 Ss .754 .800 .805 .901 .804 .757 District center X 3.47 3.98 2.12 2.06 2.40 3.08 Ss .724 .895 .900 .880 .801 .807 Town-villagge Ss X 3.40 .718 3.94 .772 2.22 .713 .732 2.13 2.36 .743 .683 3.12
As shown in Table 12, there was no statistically significant difference between the
organizational silence cases according to the residents living there (Wilks' Lambda = 0.992; F (12.1202) = 0.392; p >0.05).
562
Table 13. MANOVA Table on Participants' Comparisons of Organizational Silence Situations
According to Branches Branch Class teacher Ss X 3.40 .783 .846 3.96 2.26 .827 2.25 .937 2.46 .852 3.08 .811 Branch (middle-school) Ss X 3.45 .707 3.99 .773 2.06 .754 .830 1.98 2.43 .786 3.03 .724 Branch (high school) Ss X 3.43 .760 4.02 .844 2.26 .873 .893 2.16 2.36 .730 3.07 .749 Vocational courses X 3.22 3.98 2.21 2.12 2.52 3.18 Ss .826 .844 .496 .728 .657 .753 guidance and psychological counseling . X 3.58 3.88 2.32 1.86 2.25 2.92 Ss .420 .583 .699 .713 .842 .564 Special education Ss X 3.00 .938 4.05 .512 2.03 .803 .548 1.90 1.055 2.15 3.00 .667 Pre-school Ss X 3.63 .659 4.05 .927 2.26 .956 .848 1.92 .892 2.65 3.17 .871
4. Discussion and Conclusion
It was found that the teachers who participated in the research were found to have a higher level of silence and organizational benefit than medium level for the benefit of the organization, defensive purpose silence, defense purpose voice and accepted silence scores were below the middle level and accepted voice scores were moderate.Similar research findings on public employees and teachers in the literature reveal that the organizational silence levels of employees are at the middle level (Şimşek, Aktaş, 2014: 128; Sezgin-Nartgül, Kartal, 2013: 55; Çiçek-Sağlam, Yüksel, 2015: 325). In this context, it can be said that the findings obtained in the research are in parallel with the literature.
It was determined that the levels of organizational silence of the teachers participating in the study did not show any significant difference according to the gender variable. It was determined that organizational silence levels of the male and female teachers showed similarity according to the findings obtained. When it is considered according to the gender variable, it is seen that the research findings in the literature show contradictory results.As a matter of fact, it has been found that in some researches, gender variable is an important determinant of organizational silence
(Çınar et al., 2013: 319; Çiçek-Sağlam, Yüksel, 2015: 325) and in some studies organizational silence did not show any significant difference according to gender (Kılıçlar ve Harbalıoğlu, 2014: 336; Sezgin-Nartgül ve Kartal, 2013: 47). The reason for the lack of significant differences in the level of organizational silence between the teachers and the sexes is that the preference of both female and male teachers to meet with organizational problems and to be silent in the face of the problems faced by both male and female teachers in parallel can be considered.
It was found that the scores of the teachers who participated in the study showed a significant difference according to the marital status variable and the accepted silence levels of the married teachers were found to be higher when compared to the single teachers according to the findings obtained. It was determined that the scores obtained from the other sub-dimensions related to organizational silence did not show any significant difference according to the marital status of the teachers. In the research conducted by Kılıçlar and Harbalıoğlu (2014: 337), the levels of organizational silence of individuals working in the tourism sector were examined according to the marital status variable and the level of organizational silence of married employees was found to be higher when compared to single employees at the end of the research.Generally speaking, married teachers have a high level of organizational silence compared to single teachers, married teachers have an intense life outside of work life, high family responsibilities outside work life, and therefore they can be thought to be insensitive to organizational problems in a busy life.
563
It was determined that the levels of organizational silence of the teachers participating in the research did not show any significant difference according to the type of school they were working on. The outcome of this outcome can be thought of as the reasons for the similarity of organizational problems encountered in schools, the similarities between school administrations and teachers, the similarity of management systems, the similar level of organizational commitment of teachers, and the similar organizational climate and cultural heritage.Research findings in the literature also show that organizational climate, organizational commitment, and relationships with managers in educational institutions have a significant effect on organizational silence (Yaman, Ruçlar, 2014: 36; Qazelvand, Shahtalebi, 2016: 105;Karabag-Köse, 2014: 28).
It was determined that the level of organizational silence of the teachers participating in the research showed significant difference according to the age groups and that the teachers who were in the age group of 50 and above according to the findings were found to have higher defense levels than the teachers in the age group of 31-40 years. At the basis of this result, it can be considered that the higher the professional experience of the teachers in the older age group, and accordingly the higher the motivation to defend themselves in the matters that they are right in the organizational structure.
Another reason for the differences in the level of defense voices according to age groups of teachers is the fact that the causes of the teachers' silence in age groups are different from each other. In researches in the literature, it has been found that the subjects who are silent in the organizational structure show significant differences according to age groups (Çakıcı, 2008: 127; Yaman and Ruçlar, 2014: 39).
It was determined that the levels of organizational silence of the teachers who participated in the research did not show any significant difference with respect to the settlement area where they lived (city center, district center, town – village). As it is known, administrative and organizational elements are at the head of the basic elements that cause organizational silence in employees
(Çakıcı, 2008: 130). In this context, it can be considered that the level of organizational silence of the teachers participating in the research does not differ according to the place where they are working, and that the schools in the settlements have similar organizational and administrative structures.
It was determined that organizational silence levels of the teachers participating in the research did not show any significant difference according to the branches. As is known, there are managerial, organizational and business related factors at the beginning of the walls that cause organizational silence in educational institutions (Cemaloğlu et al., 2013: 112; Celep, Kaya, 2016: 233). In this context, it can be considered that the organizational silence levels of the teachers are similar to the branch variables, the similarities of the problems faced by the teachers towards their branches in the schools, the similarity of the organizational commitment levels of the branch teachers and the managerial attitudes towards the branch teachers. On the other hand, it can be said that the approach of school administrations within the framework of management understanding similar to all branch teachers contributed to this result.
As a result, it was determined that the levels of organizational silence of the teachers participating in the research did not show any significant difference according to the type of school, the place of employment, educational status and branch variables. It is thought that the fact that the schools they work in have the similar organizational culture and management forms in the emergence of these results. It has been shown that the vast majority of participants have the same educational status as the reason why organizational silence levels are similar according to their level of education. In addition, it was determined that organizational silence levels of teachers were significantly different according to gender, marital status, age and occupational seniority variables, and these results were found to be in parallel with the literature. As is known, the levels of organizational silence of teachers influence both the performance of the work and the productivity of the education system. Therefore, it can be said that the researches on the factors affecting teachers' organizational silence levels should be increased
References
Alparslan, Kayalar, 2012 – Alparslan, A.M., Kayalar, M. (2012). Organizational Silence: Silence Behaviors and Organizational and Individual Effects. Mehmet Akif Ersoy University
564
Bagheri et al., 2012 – Bagheri, G., Zarei, R., Aeen, M.N. (2012). Organizational Silence (Basic Concepts and Its Development Factors). Ideal Type of Management, 1 (1), 47–58.
Barçın, 2012 – Barçın, N. (2012). A Research on Organizational Commitment and Effect on Job Satisfaction of Organizational Silence in Organizations. Master Thesis. Cukurova University Social Sciences Institute. Adana.
Beheshtifar et al., 2012 – Beheshtifar, M., Borhani, H., Moghadam M.N. (2012). Destructie Role of Employee Silence in Organizational Success. International Journal of Academic Research
in Business and Social Sciences, 2, 11, 276.
Bowen, Blackmon, 2003 – Bowen, F., Blackmon, K. (2003). Spirals of Silence: The Dynamic Effects of Diversity on Organizational Voice. Journal of Management Studies, 40 (6), 1393-1417.
Can, 2014 – Can, A. (2014). Quantitative Data Analysis in the Scientific Research Process with SPSS.2nd Edition. Ankara: Pegem Academy.
Celep, Kaya, 2016 – Celep, C., Kaya, A. (2016). The Reasons of Organizational Silence
According to the Views of Primary Teachers. Trakya University Journal of Education Faculty, 6 (2), 233–246.
Cemaloğlu et al., 2013 – Cemaloğlu, N., Daşcı, E., Şahin, . (2013). The Reasons for Teachers Living in Primary Education Institutions to Live Organizational Silence: A Qualitative Study.
Journal of Academic Social Research, 1 (1), 112–124.
Çakıcı, 2007 – Çakıcı, A. (2007). Silence in Organizations: The Theoretical Foundations and Dynamics of Silence. CU Journal of Social Sciences Institute, 16 (1), 145–162.
Çakıcı, 2008 – Çakıcı, A. (2008). A Study on the Causes of Silence and the Perceived Results of Silent Topics in Organizations. CU Journal of Social Sciences Institute, 17 (1), 117–134.
Çınar et al., 2013 – Çınar, O., Karcıoğlu, F., & Alioğulları, Z.D. (2013). The relationship between organizational silence and organizational citizenship behavior: a survey study in the province of Erzurum, Turkey. Procedia- Social and Behavioral Sciences, 99, 314–321.
Cicek-Sağlam, Yüksel, 2015 – Cicek-Sağlam, A., Yüksel, A. (2015). Opinions of Teachers and Executives on Organizational Silence in High School. International Periodical For Languages,
Literature and History of Turkish or Turkic, 10 (7), 317–332.
Erdoğan, 2011 – Erdoğan E. (2011). Organizational Silence and Performance Relation.Unpublished Master Thesis. Institute of Social Sciences, Gebze Advanced Technology Institute.
Eriguc et al., 2014 – Eriguc, G., Ozer, O., Turac, I. S., Songur, C. (2014). Organizational Silence among Nurses: A Study of Structural Equation Modeling. International Journal of
Business, Humanities and Technology, 4 (1), 150–162.
Fast et al., 2014 – Fast, N. J., Burris, E. R., Bartel, C.A. (2014). Managing to Stay in the Dark: Managerial Self-Efficacy, Ego Defensiveness, and The Aversion to Employee Voice. Academy of Journal, 57 (4), 1013–1034.
Henriksen, Dayton, 2006 – Henriksen, K., Dayton, E. (2006). Organizational Silence And Hidden Threats To Patient Safety. Health Services Research, 41 (4), 1539–1555.
Kahveci, Demirtas, 2013 – Kahveci, G., Demirtas, Z. (2013). Development of Organizational Silence Scale for Teachers. Electronic Journal of Social Sciences, 12 (43), 167–182.
Karabağ-Köse, 2014 – Karabağ-Köse, E. (2014). Relations Between Teacher 's Organizational Commitment and Organizational Silence in Disadvantaged Schools. International
Journal of Turkish Educational Science, 2 (2), 28–36.
Karaca, 2013 – Karaca, H. (2013). An Exploratory Study on the Impact of Organizational Silence in Hierarchical Organizations: Turkish National Police Case. European Scientific Journal, 9 (23), 38–50.
Kılıçlar, Harbalıoğlu, 2014 – Kılıçlar, A., Harbalıoğlu, M. (2014). The Relationship Between Organizational Silence and Organizational Citizenship Behavior: A Research on Five Star Hotel Operations in. Journal of Business Research, 6 (1), 328–346.
Milliken et al., 2003 – Milliken F.J., Morrison E.W., Hewlin P.F. (2003). An Exploratory Study of Employee Silence: Issues that Employees Do not Communicate Upward and Why. Journal
of Management Studies, 40 (6): 1453–1476.
Morrison, Milliken, 2000 – Morrison, E.W., Milliken, F.J. (2000). Organizational Silence: A Barrier to Change and Development in a Pluralistic World. The Academy of Management
565
Pinder, Harlos, 2001 – Pinder, C. C., Harlos, K. P. (2001). Employee Silence: Quiescence and Acquiescence as Responses to Perceived Injustice. Research in Personnel and Human Resources
Management, 20, 331–370.
Panahi et al., 2012 – Panahi, B., Veiseh, S. M., Divkhar, S., Kamari, F. (2012). An Empirical Analysis on Influencing Factors on Organizational Silence and Its Relationship with Employee's Organizational Commitment. Management Science Letters, 2, 735–744.
Premeaux, Bedeian, 2003 – Premeaux, S.F., Bedeian, A.G. (2003). Breaking the Silence: The Moderating Effects of Self-Monitoring in Predicting Speaking Up in the Workplace. Journal of
Management Studies, 40 (6): 1539–1562.
Sezgin-Nartgün, Kartal, 2013 – Sezgin-Nartgün, Ş., Kartal, V. (2013). Teachers' Views on
Organizational Cynicism and Organizational Silence. Bartın University Journal of Education, 2 (2), 47–67.
Shojaie et al., 2011 – Shojaie, S., Matin, H. Z., Barani, G. (2011). Analyzing the Infrastructures of Organizational Silence and Ways to Get Rid of it. Procedia-Social and
Behavioral Sciences, 30, 1731–1735.
Simsek, Aktas, 2014 – Simsek, E., Aktas, H. (2014). Personality and Life Satisfaction with Organizational Silence: A Research in the Public Sector. Anadolu University Journal of Social Sciences, 14 (2), 121–136.
Tayfun, Çatır, 2013 – Tayfun, A., Çatır, O. (2013). A Research on the Relationship between Organizational Silence and Employee Performance. Journal of Business Research, 5 (3), 114–134.
Ülker, Kanten, 2009 – Ülker, ., Kanten, P. (2009). A Research on the Silence Climate, Occupational Silence and Organizational Commitment in Organizations. Aksaray University Journal of İİB , 1 (2), 111–126.
Vakola, Bouradas, 2005 – Vakola, M., Bouradas, D. (2005). Antecedents and Consequences of Organic Silence: An Empirical Investigation. Employee Relations, 27 (5), 441–458.
Van Dyne et al., 2003 – Van Dyne, L., Ang, S., Botero, I.C. (2003), Conceptualizing Employee Silence and Employee Voice as a Multidimensional Construct. Journal of Management Studies, 40, 1359–1392.
Qazelvand, Shahtalebi, 2016 – Qazelvand, R., Shahtalebi, B. (2016). Organizational Silence and Organizational Commitment of Junior Secondary and Senior Teachers of Azna City. Review of European Studies, 8 (2), 105–113.
Yaman, Ruçlar, 2014 – Yaman, E., Ruçlar, K. (2014). Organizational Silence in Universities as a Predictor of Organizational Culture. Journal of Higher Education and Science, 4 (1), 36–50.