SYNTHESIS OF QUASI-SPHERICAL SILVER NANOPARTICLES BY CHEMICAL REDUCTION ROUTE USING DIFFERENT REDUCING AGENTS
1Ayşe KURT , 2Yasemin ÇELİK
1Graduate School of Sciences, Nanotechnology Program, Eskisehir Technical University, Eskisehir,
TURKEY
2Department of Materials Science and Engineering, Eskisehir Technical University, Eskisehir, TURKEY 1[email protected], 2[email protected]
(Geliş/Received: 08.03.2020; Kabul/Accepted in Revised Form: 16.07.2020)
ABSTRACT: Silver nanoparticles (AgNPs) have a great potential for molecular detection applications
such as surface enhanced Raman spectroscopy (SERS) thanks to their surface plasmon resonance (SPR) property. SPR of AgNPs are closely related to the size, size distribution, aggregation state and shape of these particles. Therefore, in order to obtain optimum enhancement of SERS signals, it is crucial to be able to synthesize AgNPs with controllable size and shape. In this study, AgNPs were synthesized by chemical reduction method using three different reducing agents: trisodium citrate (TSC), ascorbic acid (AA) and hydroxylamine hydrochloride (HH). The synthesized AgNPs were compared in terms of their particle shape, size, size distribution and aggregation state. Accordingly, using 34 mM TSC as a reducing agent resulted in mostly quasi-spherical nanoparticles with an average size of 71.6 20.9 nm. However, some nanorods and triangular nanoparticles were also observed in this sample. In case of using HH as reducing agent, the addition sequence of chemicals into the reaction mixture affected the size and the aggregation state of AgNPs significantly. A bimodal size distribution of mostly quasi-spherical nanoparticles with average sizes of 8.1 4.1 and 60.1 21.5 nm were obtained when HH/NaOH solution was added to AgNO3.
When AA was used as a reducing agent, relatively larger quasi-spherical AgNPs with a lower polydispersity and an average size of 78.0 22.2 nm were synthesized.
Key Words: Silver nanoparticles, Chemical reduction method, Surface enhanced Raman spectroscopy
Yarı Küresel Gümüş Nanopartiküllerin Farklı İndirgeyiciler Kullanarak Kimyasal İndirgeme Yöntemiyle Sentezi
ÖZ: Gümüş nanopartiküller, yüzey plazmon rezonans özellikleri sayesinde yüzeyde güçlendirilmiş
Raman spektroskopisi (SERS) gibi moleküler tespit uygulamaları için büyük bir potansiyele sahiptir. Gümüş nanopartiküllerin yüzey plazmon rezonansı tane boyutu, boyut dağılımı, agregasyon derecesi ve tane şekli ile yakından ilişkilidir. Bu nedenle, SERS sinyallerinde optimum güçlendirmenin elde edilebilmesi için gümüş nanopartiküllerin şekil ve boyut kontrollü sentezi büyük önem taşımaktadır. Bu çalışmada, gümüş nanopartiküller üç farklı indirgeyici (trisodyum sitrat (TSC), askorbik asit (AA) and hidroksilamin hidroklorür (HH)) kullanarak kimyasal indirgeme yoluyla sentezlenmiştir. Sentezlenen gümüş nanopartiküller, tane şekli, boyutu, boyut dağılımı ve agregasyon/aglomerasyon derecesi açısından karşılaştırılmıştır. Buna göre, 34 mM TSC’nin indirgeyici olarak kullanıldığı durumda çoğunlukla yarı-küresel şekilli, ortalama tane boyutu 71.6 20.9 nm olan gümüş nanopartiküller elde edilmiştir. Bununla birlikte, yarı-küresel tanelerin yanı sıra, az sayıda da olsa nano-çubuk ve üçgensel nanopartiküller oluştuğu da görülmüştür. İndirgeyici olarak HH kullanıldığında, kimyasalların reaksiyon karışımına eklenme sıralaması nanopartiküllerin tane boyutunu ve aglomerasyon derecesini önemli ölçüde etkilemiştir. HH/NaOH çözeltisinin AgNO3 çözeltisi üzerine eklenmesi durumunda, ortalama tane
boyutu 8.1 4.1 ve 60.1 21.5 nm olan iki farklı tane boyut dağılımına sahip yarı-küresel gümüş nanopartiküller elde edilmiştir. İndirgeyici olarak AA kullanıldığında ise, diğer numunelere kıyasla nispeten daha büyük ortalama tane boyutuna (78.0 22.2 nm); ancak, daha dar tane boyut dağılımına sahip yarı-küresel gümüş nanopartiküller sentezlenmiştir.
Anahtar kelimeler: Gümüş nanopartiküller, Kimyasal indirgeme metodu, Yüzeyde güçlendirilmiş Raman
spektroskopisi
1. INTRODUCTION
Silver nanoparticles (AgNPs) are promising for a wide range of applications, such as catalysis, biomaterials, optical devices, plasmonics, and sensing and detection of molecules (Zhang et al. 2016; Xu et al. 2006), due to their favorable combination of physical and chemical properties, such as catalytic and antimicrobial activities, high electrical and thermal conductivities, and exhibiting a surface plasmon resonance (SPR) (Roy et al. 2019; Lee and Jun 2019; Amendola 2016). SPR is an optical phenomenon arising from the interaction between an incident light wave and free electrons in the metal nanoparticles (Hu et al. 2006). As a consequence of this interaction, free electrons of the metal collectively oscillates in resonance with the frequency of the interacting lightwave (Das et al. 2010). Excitation of localized surface plasmons by light at an incident wavelength where resonance occurs results in strong light scattering, leading to appearance of surface plasmon absorption bands (Hutter and Fendler 2004). The absorption maxima and intensity of these bands are characteristic of the type of metal (e.g, gold or silver), and highly sensitive to the size, size distribution and shape of the nanostructures (Hutter and Fendler 2004). The SPR of AgNPs can be precisely correlated with the nanoparticle size and shape based on classical Mie theory (Li et al. 2013; Kreibig and Vollmer 1995), which describes the extinction spectra of spherical particles of arbitrary size (Kelly et al. 2003). The localized surface plasmon resonances that are formed on rough metallic surfaces or on metal nanoparticles lead to a strong local electromagnetic field enhancement in the vicinity of the nanoparticles (Stamplecoskie et al. 2011; Hutter and Fendler 2004). This provides an enhanced Raman signal for the species that are adsorbed onto the surface of nanoparticles/nanostructures or located around the gaps between nanoparticle arrays or aggregates called hot-spots (Petryayeva and Krull 2011). This phenomenon is called as surface enhanced Raman scattering (SERS). Electromagnetic enhancement, resulting from the optical properties of the nanostructured metallic surfaces, is thought to be the primary contributing mechanism of SERS (Sharma et al. 2012; Starowicz et al. 2018). Enhancement of SERS signals strongly depends on the shape, size and aggregation state of the nanoparticles since these parameters influence the degree of SPR (Pang, Wu, and Tian 2018; Starowicz et al. 2018; Chaudhari et al. 2019). Stamplecoskie et al. (Stamplecoskie et al. 2011) discussed that although the local electromagnetic enhancement increases with increasing particle size; the particles absorb less light and scatter more through inelastic scattering as particle size increases, causing a decrease in the overall SERS intensity. Moreover, with an increase in the AgNPs size at a fixed amount of Ag, the total surface area for adsorption decreases and is expected to offset the increased electromagnetic field of larger particles (Stamplecoskie et al. 2011). For this reason, the authors emphasized the importance of determining the optimal size of colloidal spherical AgNPs to provide a balance between electromagnetic field increase and scattering/limited surface area so as to realize maximum SERS intensity (Stamplecoskie et al. 2011). Therefore, it is crucial to be able to synthesize spherical/quasi-spherical AgNPs with controllable size and size distribution. AgNPs can be synthesized by chemical reduction in solution phase method by using a variety of reducing agents (Zhang et al. 2018). Because of different reduction potential of these reducing agents, nanoparticles can be synthesized in different size, shape and distribution. The aim of this study was to synthesize AgNPs by chemical reduction of AgNO3 in aqueous solutions using three different
reducing agents and to compare the particle shape, size and size distribution of the synthesized nanoparticles.
2. EXPERIMENTAL PROCEDURE
In this study, AgNPs were synthesized by chemical reduction method in water using three different reducing agents: trisodium citrate (TSC) dehydrate, hydroxylamine hydrochloride (HH) and ascorbic acid (AA). Silver nitrate (AgNO3, cryst. extra pure, Merck) was used as a silver source. The reducing agents:
trisodium citrate dehydrate (Na3C6H5O7.2H2O, ≥ 99%), hydroxylamine hydrochloride (NH2OH.HCl, 99%)
and ascorbic acid (C6H8O6, ≥ 99%) were supplied from Sigma Aldrich. Since any impurities would prevent
controlled colloidal AgNPs synthesis, all the glassware was cleaned using 65% HNO3 solution before
synthesis processes, then washed with deionized water and allowed to dry. After synthesis, all the samples were stored at 4°C and in bottles covered with aluminum foil in order to maintain log-term stability by preventing agglomeration/aggregation and hindering interaction of AgNPs with light, respectively.
2.1. Synthesis of AgNPs Using Trisodium Citrate (TSC) Dehydrate as a Reducing Agent
The synthesis of AgNPs by using citrate as a reducing agent was performed by following the route proposed by Lee and Miesel (Lee and Meisel 1982). In order to synthesize colloidal AgNPs with desired shape, size and size distribution, different synthesis parameters such as concentration of reducing agent, pH and temperature can be considered. In this study, the effect of TSC concentration on colloidal AgNPs synthesis was examined using different TSC concentrations (10, 20, 34, 50 and 60 mM), while keeping the other parameters constant. Basically, 50 ml of 1.010-3 M AgNO3 solution was heated under stirring until
it begins to boil. Then, 5ml of TSC solution with a specific concentration was added dropwise to AgNO3
solution. Heating and vigorous stirring were continued for an additional 15 min, after a color change was observed in solution. The colorless AgNO3 solution was transformed from pale yellow to orange-yellow
when TSC concentration was increased from 10m M to 60mM. The solution was then cooled naturally to room temperature. No reflux system was used in this study.
2.2. Synthesis of AgNPs Using Hydroxylamine Hydrochloride (HH) as a Reducing Agent
In this approach, the synthesis was performed according to the method proposed by Leopold and Lendl (Leopold and Lendl 2003). Briefly,10 ml of 10–2 M AgNO3 aqueoussolution was rapidly added to 90
ml of 1.6710–3 M HH solution containing 3.3310–3 M NaOH, which was used to adjust the pH of the final
colloidal solution and stirred for 20 min at room temperature. The color of the obtained colloidal silver dispersion was orange-brown and it was denoted as "AgNO3 added to HH/NaOH".
The AgNPs synthesis approach using HH as a reducing agent was also performed by changing the order of the addition sequence of chemicals into the reaction mixture as suggested by Leopold and Lendl (Leopold and Lendl 2003) to see how the size and size distribution of AgNPs will be affected. For this purpose, 5 ml of 310-2 M NaOH aqueous solution was added into 5ml of 1.510-2 M HH aqueous solution,
then the whole mixture was added dropwise into 90 ml of 1.1110-3 M AgNO3 aqueous solution while
stirring. The mixed solution was stirred for further 20 min. The colloidal dispersion obtained at the end of the synthesis had a pH close to 7. The resulting dispersion showed a milky gray color, and was denoted as "HH/NaOH added to AgNO3".
2.3. Synthesis of AgNPs Using Ascorbic Acid (AA) as a Reducing Agent
The synthesis of AgNPs was carried out by using AA as a reducing agent and TSC as a stabilizing agent, in this approach. The synthesis was mainly performed by following the method described by Qin
et.al (Qin et al. 2010). Initially, the pH of 100 ml of an aqueous solution containing 610-4 M AA and 310 -3 M TSC was adjusted to 10 by adding 0.1 M NaOH aqueous solution. Then, 1 ml of 0.1 M AgNO3 aqueous
solution was added dropwise while stirring at 30°C and the color first changed from colorless to yellow and then greenish-brown. After mixing the solution for further 15 min, the product was transferred into a water bath at 100°C and kept there for 30 min while stirring.
2.4. Characterization of Synthesized AgNPs
Formation of AgNPs was verified by X-ray diffraction (XRD) analysis (not shown) for each sample using Rigaku Miniflex 600 at a voltage and current of 40 kV and 15 mA, respectively. UV−visible absorption spectra of colloidal AgNPs were recorded by using Shimadzu UV-3600 spectrophotometer in the 300−800 nm wavelength range. Prior to UV analysis, AgNPs synthesized with TSC were directly placed into the quartz cuvette, while AgNPs synthesized with HH and AA were diluted three times with deionized water and then placed into quartz cuvettes. The morphology of the synthesized AgNPs was examined using field emission gun scanning electron microscope (FEG-SEM, Zeiss Supra 50VP) and transmission electron microscope (Hitachi HT7800 TEM). The average particle size was determined from TEM micrographs by measuring the size of at least 60 AgNPs using ImageJ software.
3. RESULTS AND DISCUSSION
3.1. Synthesis of AgNPs Using Trisodium Citrate (TSC) Dehydrate as a Reducing Agent
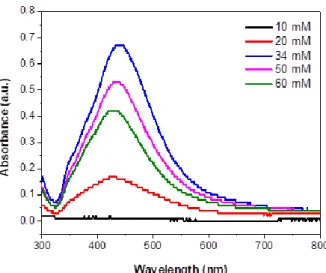
Figure 1 shows UV-Vis spectrum of AgNPs synthesized at different TSC concentrations. The position of the absorption peak (at 400 nm) in the UV-vis spectrum of the colloidal solution gives information about the average particle size, while the full width at half maximum (FWHM) of this band can be used to get information about particle dispersity (Qin et al. 2010). The maximum absorption peak of AgNPs synthesized by using 20, 34, 50 and 60 mM TSC was observed at 424, 432, 429 and 426 nm, respectively. These wavelengths of the absorption peaks correspond well to spherical AgNPs (Pyatenko, Yamaguchi, and Suzuki 2007; Stamplecoskie et al. 2011). The absorption intensity was significantly low in case of using 10 mM TSC, indicating that this concentration of TSC is not sufficient to form a considerable amount of AgNPs. The amount of light being absorbed by the particles is directly proportional to the concentration of these particles in the dispersion, according to Beer-Lambert Law (Ingle and Crouch 1988). The highest absorption intensity was obtained in case of using 34 mM TSC, indicating the formation of higher amount of AgNPs. However, the red-shifted peak position of this sample indicates the presence of relatively larger particles. The FWHM values of absorption peaks of all the samples are greater than 100 nm revealing a high degree of polydispersity in the synthesized nanoparticles. This is in agreement with the literature where it was reported that AgNPs synthesized by this approach have a wide variety of sizes and different shapes including rods, spheres and prisms (Meng et al. 2015; Ranoszek-Soliwoda et al. 2017). Moreover, a small shoulder was observed at 350 nm in the UV-vis spectra of the samples (Fig. 1). This band can be attributed to transition involving higher multipoles of AgNPs that becomes prominent for particles having symmetry lower than that of a sphere (Bhui et al. 2009).
TSC acts as both a reducing agent and a stabilizing agent in this method. Therefore, a variation in TSC concentration may cause both a change in the reduction rate and in the nucleation and growth kinetics of particles, and this complicates the determination of optimum TSC concentration. Anionic species, such as citrate ions (C6H5O73-), are adsorbed onto AgNPs and create a negative charge on the surface of these
nanoparticles. Negatively charged AgNPs then repel each other, providing an electrostatic stabilization to colloidal AgNPs against coagulation and aggregation (Lee and Jun 2019). At low TSC concentrations, such as 10 and 20 mM, coalescence of silver clusters may occur due to presence of insufficient citrate ions which prevent clusters from interacting with each other. Therefore, considering the relatively high AgNPs concentration, the optimum TSC concentration was determined as 34 mM in this study.
Figure 1. UV-vis absorption spectrum of AgNPs synthesized at 10, 20, 34, 50 and 60 mM TSC
concentrations.
3.2. Synthesis of AgNPs Using Hydroxylamine Hydrochloride (HH) as a Reducing Agent
Synthesis of AgNPs using HH as a reducing agent is relatively easier than synthesis by citrate reduction, since the reduction process can be done at room temperature. However, to be able to achieve repeatable results, one should be very careful to perform synthesis process under the same conditions in each time.
The UV-vis absorption spectrum of AgNPs synthesized by using HH as a reducing agent is shown in Fig. 2. When AgNO3 solution was added to HH/NaOH solution, the maximum absorption peak was
observed at 406 nm with a FWHM of 76 nm. In case of adding HH/NaOH to AgNO3, this peak was
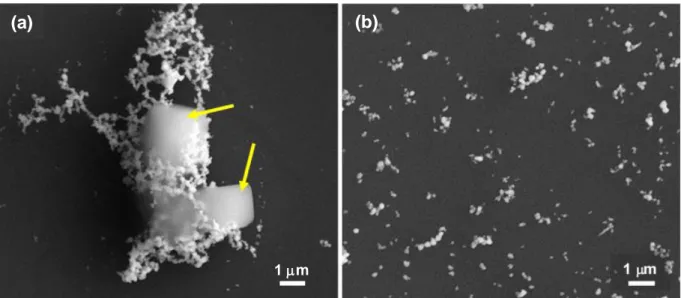
red-shifted to 427 nm, indicating the presence of larger particles. The FWHM of this band is 119 nm, revealing a high polydispersity. These results are consistent with those reported by Leopold and Lendl (Leopold and Lendl 2003), who suggested that the dropwise addition of the reducing agent probably leads to a seeding effect resulting in a growth of the silver particles. This is also consistent with the milky gray color of the colloids that is observed when the particles are polydispersed (Leopold and Lendl 2003). However, it should be noted that SEM analyses revealed the formation of large NaCl crystals, as well as a high degree of agglomeration of AgNPs due to their relatively small size, in case of adding AgNO3 to
HH/NaOH solution (Fig. 3(a)). The presence of NaCl crystals in this sample was confirmed by XRD and EDX analyses (not shown). HH/NaOH added to AgNO3 sample exhited a relatively larger particle size
with a much lower degree of agglomeration (Fig. 3(b)). Nano-scale gaps known as ‘hotspots’ that give rise to local electromagnetic fields as well as enhancement of Raman signal are produced between junctions of adjacent two or multiple AgNPs (Petryayeva and Krull 2011; Maher 2012). Therefore, agglomeration/aggregation of AgNPs could be advantegeous for SERS analyses to some extent; however, hot-spot formation and Raman signal enhancement can be negatively affected if the amount of agglomerates/aggregates exceeds a certain amount (Vanamudan and Pamidimukkala 2015; Yaffe et al. 2010). Yaffe et al. (Yaffe et al. 2010) reported that different sized aggregates and the spacing between these aggregates change the surface plasmon resonances, causing different enhancement effects.
AgNPs synthesized using HH as a reducing agent are negatively charged due to adsorbed chloride ions onto their surface (Garrido, Weiss-Lopez, and Vallette 2016); therefore, they attract positively charged analyte molecules during SERS experiments.
Figure 2. UV-vis absorption spectrum of AgNPs synthesized by using hydroxylamine hydrochloride
(HH) as a reducing agent.
Figure 3. SEM micrographs of AgNPs synthesized by using hydroxylamine hydrochloride (HH) as a
reducing agent. (a) AgNO3 added to HH/NaOH and (b) HH/NaOH added to AgNO3.
3.3. Synthesis of AgNPs Using Ascorbic Acid (AA) as a Reducing Agent
In this approach, AA and TSC serve as a reducing agent and stabilizing agent, respectively. In comparison with the citrate reduction, the reaction was much faster and the color change was observed immediately, since AA is a relatively stronger reducing agent compared to TSC (Li et al. 2013).
3.4. Comparison of the AgNPs Synthesized Using Different Reducing Agents
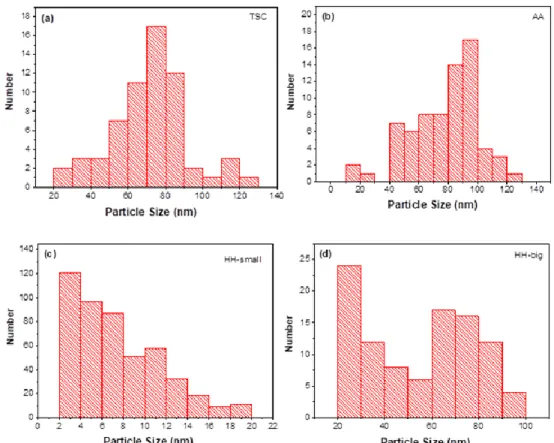
TEM micrographs revealed mostly quasi-spherical nanoparticles for each sample (Figs. 4(a)-(f)); however, a few anisometric particles such as nanorods and triangular nanoparticles were also observed especially for the AgNPs synthesized using TSC as a reducing agent (inset at Fig. 4(b)). The average particle size was determined from TEM micrographs (Table 1) by measuring the size of at least 60 AgNPs using ImageJ software, and the corresponding statistical histograms of particle size distribution were obtained (Fig. 5). Accordingly, using AA as a reducing agent resulted in larger nanoparticles with an
(a)
(b)
average size of 78.0 22.2 nm, and 35% of the total particles are 100 nm at least at one dimension. In case of using 34 mM TSC as a reducing agent, average particle size was measured as 71.6 20.9 nm and 15% of the total particles are 100 nm at least at one dimension. TEM images revealed that the size of all the particles are 100 nm, when HH was used as a reducing agent (Figs. 5(c) and (d)). However, as well as relatively large AgNPs with an average particle size of 60.1 21.5 nm, very small nanoparticles with an average size of 8.1 4.1 were observed for this sample (Fig. 5(c) – indicated by arrows and at the inset; Table 1).
Figure 4. TEM micrographs of AgNPs synthesized using (a), (b) TSC; (c), (d) HH and (e), (f) AA as a reducing agent.
(a)
(b)
200 nm(c)
(d)
(e)
(f)
200 nm 200 nm 200 nm 100 nm 100 nm 100 nm 50 nmFigure 5. Statistical histograms showing size distributions of AgNPs synthesized by using (a) TSC, (b) AA and (c), (d) HH as a reducing agent.
Table 1. Comparison of AgNPs synthesized by using three different reducing agents
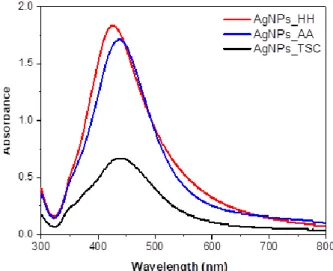
Figure 6 shows the UV-vis absorption spectra of AgNPs synthesized by using three different reducing agents. The maximum absorption peak was observed at 427, 432 and 435 nm for the AgNPs synthesized by using HH (HH/NaOH added to AgNO3), 34 mM TSC and AA as a reducing agent, respectively. The
red-shift in the position of these plasmon peaks correspond to presence of larger particles, since there is an increasing contribution of higher-order plasmon modes for larger particles (Stamplecoskie et al. 2011). This is in agreement with the average particle size values of the AgNPs calculated from TEM micrographs (Fig. 4, Table 1). The highest absorption intensity was obtained when HH was used as a reducing agent, indicating that the highest AgNPs concentration was obtained for this sample. On the other hand, using TSC as a reducing agent resulted in a much lower absorption intensity, reflecting a relatively low concentration of AgNPs. The FWHM of the absorption peaks of AgNPs synthesized using HH, TSC and AA are 119, 130 and 114 nm, respectively. Accordingly, the highest polydispersity was obtained when
Average Particle Size (nm)
Particle Shape
Trisodium citrate (34 mM) 71.6 20.9 Mostly
quasi-spherical; a few nanorods and triangular nanoparticles
Hydroxylamine Hydrochloride
(HH/NaOH added to AgNO3)
8.1 4.1 and 60.1 21.5 Bimodal size distribution, mostly
quasi-spherical
TSC was used a reducing agent, while using AA as a reducing agent resulted in a relatively lower polydispersity compared to the other samples.
Figure 6. UV-vis absorption spectra of AgNPs synthesized by using three different reducing agents
(trisodium citrate (TSC), hydroxylamine hydrochloride (HH) and asorbic acid (AA)). AgNPs_HH and AgNPs_AA samples were diluted three times.
4. CONCLUSIONS
Quasi-spherical AgNPs were synthesized by chemical reduction method using three different reducing agents: trisodium citrate (TSC), ascorbic acid (AA) and hydroxylamine hydrochloride (HH). Due to different reducing potential of these reducing agents, AgNPs with different size and size distributions were obtained. Although most of the synthesized particles were in quasi-spherical shape, some nanorods and triangular nanoparticles were also observed in case of using TSC as a reducing agent. TSC resulted in the highest polydispersity of AgNPs among the reducing agents used in this study. When HH was used as a reducing agent, the particle size and size distribution varied significantly depending on the addition sequence of chemicals into the reaction mixture. Although relatively smaller AgNPs with a narrow particle size distribution was obtained in case of adding AgNO3 to HH/NaOH solution, a high degree of
agglomeration was observed in this sample, which may negatively effect the SERS signal enhancement. Moreover, large NaCl crystals were absorved in this sample. On the other hand, HH/NaOH added to AgNO3 sample exhited a relatively larger average particle size, but a much lower degree of agglomeration.
TEM images revealed that the size of all the particles in this sample are 100 nm; however, a significant amount of very small AgNPs with an average size of 8.1 4.1 nm were observed, as well as relatively larger ones (60.1 21.5 nm in average). In case of using AA as a reducing agent, a relatively larger average particle size (78.0 22.2) was obtained compared to the other samples. However, AgNPs synthesized by AA exhibited a lower poldispersity and a high absorption intensity, which indicates a compromise between size distribution and nanoparticle concentration.
5. REFERENCES
Amendola, Vincenzo. 2016. 'Surface plasmon resonance of silver and gold nanoparticles in the proximity of graphene studied using the discrete dipole approximation method', Physical Chemistry Chemical
Physics, 18: 2230-41.
Bhui, D. K., H. Bar, P. Sarkar, G. P. Sahoo, S. P. De, and A. Misra. 2009. 'Synthesis and UV-vis spectroscopic study of silver nanoparticles in aqueous SDS solution', Journal of Molecular Liquids, 145: 33-37.
Chaudhari, Kamalesh, Tripti Ahuja, Vasanthanarayan Murugesan, Vidhya Subramanian, Mohd Azhardin Ganayee, Thomas Thundat, and Thalappil Pradeep. 2019. 'Appearance of SERS activity in single silver nanoparticles by laser-induced reshaping', Nanoscale, 11: 321-30.
Das, R., S. S. Nath, D. Chakdar, G. Gope, and R. Bhattacharjee. 2010. 'Synthesis of silver nanoparticles and their optical properties', Journal of Experimental Nanoscience, 5: 357-62.
Garrido, C., B. E. Weiss-Lopez, and M. M. C. Vallette. 2016. 'Surface-enhanced Raman scattering activity of negatively charged bio-analytes from a modified silver colloid', Spectroscopy Letters, 49: 11-18. Hu, M., J. Y. Chen, Z. Y. Li, L. Au, G. V. Hartland, X. D. Li, M. Marquez, and Y. N. Xia. 2006. 'Gold
nanostructures: engineering their plasmonic properties for biomedical applications', Chemical
Society Reviews, 35: 1084-94.
Hutter, E., and J. H. Fendler. 2004. 'Exploitation of localized surface plasmon resonance', Advanced
Materials, 16: 1685-706.
Ingle, J.D., and S.R. Crouch. 1988. Spectrochemical Analysis (Prentice Hall: Englewood Cliffs, NJ).
Kelly, K. L., E. Coronado, L. L. Zhao, and G. C. Schatz. 2003. 'The optical properties of metal nanoparticles: The influence of size, shape, and dielectric environment', Journal of Physical Chemistry B, 107: 668-77.
Kreibig, Uwe, and Michael Vollmer. 1995. Optical properties of metal clusters (Springer: Berlin; New York). Lee, P. C., and D. Meisel. 1982. 'Adsorption and Surface-Enhanced Raman of Dyes on Silver and Gold
Sols', Journal of Physical Chemistry, 86: 3391-95.
Lee, S. H., and B. H. Jun. 2019. 'Silver Nanoparticles: Synthesis and Application for Nanomedicine',
International Journal of Molecular Sciences, 20.
Leopold, N., and B. Lendl. 2003. 'A new method for fast preparation of highly surface-enhanced Raman scattering (SERS) active silver colloids at room temperature by reduction of silver nitrate with hydroxylamine hydrochloride', Journal of Physical Chemistry B, 107: 5723-27.
Li, H. S., H. B. Xia, D. Y. Wang, and X. T. Tao. 2013. 'Simple Synthesis of Monodisperse, Quasi-spherical, Citrate-Stabilized Silver Nanocrystals in Water', Langmuir, 29: 5074-79.
Maher, Robert C. 2012. 'SERS Hot Spots.' in Challa S. S. R. Kumar (ed.), Raman Spectroscopy for
Nanomaterials Characterization (Springer Berlin Heidelberg: Berlin, Heidelberg).
Meng, W., F. Hu, X. H. Jiang, and L. D. Lu. 2015. 'Preparation of silver colloids with improved uniformity and stable surface-enhanced Raman scattering', Nanoscale Research Letters, 10: 1-8.
Pang, Ran, De-Yin Wu, and Zhong-Qun Tian. 2018. 'Density Functional Theoretical Studies on Chemical Enhancement of Surface-Enhanced Raman Spectroscopy in Electrochemical Interfaces.' in Marek J. Wójcik, Hiroshi Nakatsuji, Bernard Kirtman and Yukihiro Ozaki (eds.), Frontiers of Quantum
Chemistry (Springer Singapore: Singapore).
Petryayeva, E., and U. J. Krull. 2011. 'Localized surface plasmon resonance: Nanostructures, bioassays and biosensing-A review', Analytica Chimica Acta, 706: 8-24.
Pyatenko, A., M. Yamaguchi, and M. Suzuki. 2007. 'Synthesis of spherical silver nanoparticles with controllable sizes in aqueous solutions', Journal of Physical Chemistry C, 111: 7910-17.
Qin, Y. Q., X. H. Ji, J. Jing, H. Liu, H. L. Wu, and W. S. Yang. 2010. 'Size control over spherical silver nanoparticles by ascorbic acid reduction', Colloids and Surfaces a-Physicochemical and Engineering
Aspects, 372: 172-76.
Ranoszek-Soliwoda, K., E. Tomaszewska, E. Socha, P. Krzyczmonik, A. Ignaczak, P. Orlowski, M. Krzyzowska, G. Celichowski, and J. Grobelny. 2017. 'The role of tannic acid and sodium citrate in the synthesis of silver nanoparticles', Journal of Nanoparticle Research, 19.
Roy, Anupam, Onur Bulut, Sudip Some, Amit Kumar Mandal, and M. Deniz Yilmaz. 2019. 'Green synthesis of silver nanoparticles: biomolecule-nanoparticle organizations targeting antimicrobial activity', Rsc Advances, 9: 2673-702.
Sharma, B., R. R. Frontiera, A. I. Henry, E. Ringe, and R. P. Van Duyne. 2012. 'SERS: Materials, applications, and the future', Materials Today, 15: 16-25.
Stamplecoskie, K. G., J. C. Scaiano, V. S. Tiwari, and H. Anis. 2011. 'Optimal Size of Silver Nanoparticles for Surface-Enhanced Raman Spectroscopy', Journal of Physical Chemistry C, 115: 1403-09.
Starowicz, Z., R. Wojnarowska-Nowak, P. Ozga, and E. M. Sheregii. 2018. 'The tuning of the plasmon resonance of the metal nanoparticles in terms of the SERS effect', Colloid and Polymer Science, 296: 1029-37.
Vanamudan, A., and P. Pamidimukkala. 2015. 'Chitosan, nanoclay and chitosan-nanoclay composite as adsorbents for Rhodamine-6G and the resulting optical properties', International Journal of
Biological Macromolecules, 74: 127-35.
Xu, Gang, Yong Chen, Masato Tazawa, and Ping Jin. 2006. 'Surface Plasmon Resonance of Silver Nanoparticles on Vanadium Dioxide', The Journal of Physical Chemistry B, 110: 2051-56.
Yaffe, N. R., A. Ingram, D. Graham, and E. W. Blanch. 2010. 'A multi-component optimisation of experimental parameters for maximising SERS enhancements', Journal of Raman Spectroscopy, 41: 618-23.
Zhang, X. F., Z. G. Liu, W. Shen, and S. Gurunathan. 2016. 'Silver Nanoparticles: Synthesis, Characterization, Properties, Applications, and Therapeutic Approaches', International Journal of
Molecular Sciences, 17.
Zhang, Zhi, Wenfei Shen, Jing Xue, Yuanmeng Liu, Yanwei Liu, Peipei Yan, Jixian Liu, and Jianguo Tang. 2018. 'Recent advances in synthetic methods and applications of silver nanostructures', Nanoscale