Fine mapping of locus Xq25.1-27-2 for a low caries experience
phenotype
Erika C. Küchler1, Ping Feng2, Kathleen Deeley1, Carly A. Fitzgerald1, Chelsea Meyer1,
Anastasia Gorbunov1, Mariana Bezamat1, Maria Fernanda Reis1,3, Jacqueline Noel1, M.
Zahir Kouzbari1, José M. Granjeiro3,4, Leonardo S. Antunes3,5, Livia A. Antunes5, Fernanda
Volpe de Abreu5, Marcelo C. Costa6, Patricia N. Tannure7, Figen Seymen8, Mine
Koruyucu8, Asli Patir9, and Alexandre R. Vieira1,10,11
Erika C. Küchler: [email protected]; Ping Feng: [email protected]; Kathleen Deeley: [email protected]; Carly A. Fitzgerald: [email protected]; Chelsea Meyer: [email protected]; Anastasia Gorbunov: [email protected]; Mariana Bezamat: [email protected]; Maria Fernanda Reis: [email protected]; Jacqueline Noel: [email protected]; M. Zahir Kouzbari: [email protected]; José M. Granjeiro: [email protected]; Leonardo S. Antunes: [email protected]; Livia A. Antunes: [email protected]; Fernanda Volpe de Abreu: [email protected]; Marcelo C. Costa: [email protected]; Patricia N. Tannure: [email protected]; Figen Seymen: [email protected]; Mine Koruyucu: [email protected]; Asli Patir:
[email protected]; Alexandre R. Vieira: [email protected]
1Department of Oral Biology, University of Pittsburgh, Pittsburgh, PA 2Guiyang Stomatological Hospital, Guiyang, Guizhou, China
3Clinical Research Unit, Fluminense Federal University, Niterói, RJ, Brazil
4Directory of Programs, National Institute of Metrology, Quality and Technology (INMETRO),
Duque de Caxias, RJ Brazil
5Pediatric Clinics, School of Dentistry, Fluminense Federal University, Nova Friburgo RJ, Brazil 6Department of Pediatric Dentistry and Orthodontics, Federal University of Rio de Janeiro, Rio de
Janeiro, RJ, Brazil
7Veiga de Almeida University, Rio de Janeiro, RJ, Brazil; Discipline of Cariology, School of
Dentistry, Salgado de Oliveira University, Niterói-RJ, Brazil
8Department of Pedodontics, Istanbul University, Istanbul, Turkey
9Department of Pedodontics, Medipol Istanbul University, Istanbul, Turkey
10Center for Craniofacial and Dental Genetics, and Clinical and Translational Science Institute,
University of Pittsburgh, Pittsburgh, PA
11Department of Pediatric Dentistry, School of Dental Medicine, University of Pittsburgh,
Pittsburgh, PA
© 2014 Elsevier Ltd. All rights reserved.
Corresponding Author: Alexandre R. Vieira, 614 Salk Hall, Dept. Oral Biology, School of Dental Medicine, University of Pittsburgh, Pittsburgh, PA, 15261, USA. [email protected]. Phone #1-412-383-8972. FAX #1-412-624-3080.
The authors declare no potential conflicts of interest with respect to the authorship and/or publication of this article.
Publisher's Disclaimer: This is a PDF file of an unedited manuscript that has been accepted for publication. As a service to our
customers we are providing this early version of the manuscript. The manuscript will undergo copyediting, typesetting, and review of
NIH Public Access
Author Manuscript
Arch Oral Biol. Author manuscript; available in PMC 2015 May 01.
Published in final edited form as:
Arch Oral Biol. 2014 May ; 59(5): 479–486. doi:10.1016/j.archoralbio.2014.02.009.
NIH-PA Author Manuscript
NIH-PA Author Manuscript
Abstract
Objective—The purpose of this study was to fine map the locus Xq25.1-27-2 in order to identify genetic contributors involved in low caries experience.
Design—Seventy-two families from the Philippines were studied. Caries experience was recorded and genomic DNA extracted from peripheral blood was obtained from all subjects. One hundred and twenty-eight polymorphisms in the locus Xq25.1-27-2, a region that contains 24 genes, were genotyped. Association between caries experience and alleles was tested using the transmission disequilibrium test (TDT). This initial analysis was followed by experiments with DNA samples from 1,481 subjects from Pittsburgh, 918 children from Brazil, and 275 children from Turkey in order to follow up the results found in the Filipino families. Chi-square or Fisher’s exact tests were used. Sequencing of the coding regions and exon-intron boundaries of MST4 and FGF13 were also performed on 91 women from Pittsburgh.
Results—Statistically significant association with low caries experience was found for 11 markers in Xq25.1-27-2 in the Filipino families. One marker was in MST4, another marker was in FGF13, and the remaining markers were in intergenic regions. Haplotype analysis also confirmed these results, but the follow up studies with DNA samples from Pittsburgh, Brazil, and Turkey showed associations for a subset of the 11 markers. No coding mutations were identified by sequencing.
Conclusions—Our study failed to conclusively demonstrate that genetic factors in Xq25.1-27-2 contribute to caries experience in multiple populations.
Introduction
Caries prevalence differences between sexes have been reported in some populations.1–3
Hypotheses have been proposed to explain this phenomenon, such as: (1) female sex hormones and associated physiological factors can affect cavity formation, (2) women produce less saliva than men, (3) women have food cravings, and (4) women have variations
in immune response.4,5
Variation between females and males in the expression of genes in the X chromosome could also explain differences in caries experience between sexes. Amelogenin is a gene involved in enamel formation and is located at chromosome X (Xp22.3-p22.1). Our group
demonstrated an association between markers in this gene and caries experience.6–9 The
recent genome-wide association studies did not suggest associations between markers in the
X chromosome and caries.10,11
Our previous genome-wide linkage scan for caries provided evidence of the involvement of
the locus Xq27.1 in low caries experience.12 A nonparametric LOD score p-value of 0.0005
was found when the analysis considered low caries experience rates as the phenotype. Therefore, the aim of this study was to fine map the locus Xq25.1-27-2 in order to identify genetic contributors involved in low caries experience.
NIH-PA Author Manuscript
NIH-PA Author Manuscript
Methods
Studied Population
We studied 3,151 individuals from six population data sets, including samples from the Philippines, USA, Brazil, and Turkey.
The Filipino sample set consisted of DNA samples from 477 subjects (224 females and 253 males) from 72 families living in the Cebu Island. The mean age of the individuals was 25.8 years and ages ranged from one to 82 years. The mean DMFT/dmft score was 9.7 and scores ranged from 0 to 32.
The sample from Pittsburgh, USA consisted of 1,481 (715 males and 766 females) unrelated subjects who sought treatment at the University of Pittsburgh and were part of the Dental Registry and DNA Repository project. The mean age of the individuals was 40.9 years and ages ranged from six to 92 years. The mean DMFT/dmft score was 15.9 and scores ranged from 0 to 28.
From Brazil, two sample data sets were available for this study. The first consisted of DNA samples from 598 unrelated children and teenagers (313 males and 285 females) that sought treatment at the Federal University of Rio de Janeiro. The mean age of the children was 9.0 years and ages ranged from two to 18 years. The mean DMFT/dmft score was 2.5 and scores ranged from 0 to 17. The second sample set included DNA samples of children from Nova Friburgo. The city of Nova Friburgo is located in the northern mountainous region of the Rio de Janeiro state, 136 km from downtown Rio de Janeiro. Children (n=320, 158 males and 162 females) were from eight daycare centers in Nova Friburgo. The mean age of the children was 3.5 years and ages ranged from one to six years. The mean dmft score was 1.4 and scores ranged from 0 to 16.
From Istanbul, Turkey, two sample data sets were also available for this study. The first sample was from a study originally designed as a case-control study and consisted of 172 unrelated children (93 females and 79 males) from three to six years of age. Ninety children (mean age 4.82 years) had a dmft score of four or more and 82 children (mean age 5.99
years) were caries free.7 The second sample was designed as a cohort study and included
103 children (45 males and 58 females). The mean age of the children was 5.0 years and ages ranged from four to six years. The mean dmft score was 2.5 and scores ranged from 0 to 9.
These samples were used with the approval of the University of Pittsburgh Institutional Review Board and each Institutional Review Board at the original sites where the samples were obtained, and appropriate written informed consent was obtained from all participants. Age appropriate assent documents were used for children between seven and 14 years and informed written consent was obtained from the child, as well as from the parents. Determination of caries experience
Caries was diagnosed using a modified World Health Organization protocol recommended
for oral health surveys.13 Teeth lost to trauma or primary teeth lost to exfoliation were not
NIH-PA Author Manuscript
NIH-PA Author Manuscript
included in the final DMFT/dmft scores. When records indicated that teeth were extracted for orthodontic reasons or periodontal disease, or treatments were performed on sound teeth, these situations were not included in the final DMFT/dmft scores. The studies developed in Turkey included white spot lesions as evidence of caries. For all studies, carious lesions were recorded as present when a break in enamel was apparent on visual inspection. All of the examiners carried out the clinical examination after being calibrated by an experienced specialist. Details about the determination of caries experience were previously
described. 6,7,11,12,14
In this study, the populations were classified as either ‘low caries experience’ or ‘high caries experience,’ based on DMFT/dmft distribution in each cohort (DMFT/dmft mean and standard deviation) and subject’s age. The criteria used here for classification of caries experience took age into consideration, since it is expected that caries experience will
increase in the general population with age.1 Table 1 presents caries experience definitions
for Filipino and US cohorts. For the Turkish and Brazilian cohorts (which included only children), subjects that had a DMFT/dmft score between 0–2 were classified as ‘low caries experience.’ The subjects that had a DMFT/dmft score 3 or higher were classified as ‘high caries experience.’
Single Nucleotide Polymorphism (SNP) Genotyping
The Xq25.1-27.2 locus was fine mapped based on our previous genome-wide linkage
results.12 This region covers approximately fourteen million base pairs and has 24 genes.
For the selection of genetic markers, we used data from the International HapMap Project on
Whites and Chinese (www.hapmap.org), viewed through the software Haploview.15 Based
on pairwise linkage disequilibrium and haplotype blocks, we selected 128 single nucleotide polymorphism (SNPs; table 2; locations and minor allele frequencies obtained from dbSNP 138) in the region and genotyping was performed by polymerase chain-reactions with the Taqman method with the real-time PCR system ABI PRISM® 7900HT Sequence Detection System (Foster City, CA, USA). Probes were supplied by Applied Biosystems (Foster City, CA, USA).
Hardy-Weinberg equilibrium was evaluated using the chi-square test within each SNP in each population and only the results that were in Hardy-Weinberg equilibrium were further analyzed. In the first step of analysis, we evaluated the 128 selected SNPs in the Filipino families. The association between caries experience and the SNPs was tested with the transmission disequilibrium test (TDT) within the program Family-Based Association Test
(FBAT)16 in the “sex chromosome model.” An alpha of 0.0004 (0.05/128) was used to
indicate statistical significance. In the second step of the genotyping analysis, the eleven SNPs selected from the original 128 SNP panel with p-values of 0.05 or lower were selected for follow-up studies. The data sets from the US, Brazil, and Turkey were used for the follow up experiments. The differences in genotype and allele frequencies between ‘high’
and ‘low’ caries experience groups were tested using the PLINK software package17 with
sex as a covariate in the model for sex chromosomes. An alpha of 0.0045 (0.05/11) was used to indicate statistical significance (Bonferroni correction). Haplotype analysis was also performed.
NIH-PA Author Manuscript
NIH-PA Author Manuscript
Sequence Analysis
We sequenced exons, exon-intron boundaries, and untranslated regions (UTRs) of MST4 and FGF13, since associations were found in these genes. The primers for the amplification of
these regions were designed using the software PRIMER3.18 Primer sequences and PCR
conditions are presented in table 3. Samples were sent to Functional Biosciences, Inc. (Madison, WI, USA) for purification and sequencing. Sequence contigs were verified against a consensus sequence obtained from the UCSC genome browser with the software Sequencher 5.1 (Gene Codes Corporation, Anna Harbor, MI, USA).
Results
Association Results in the Filipino Families
Out of 128 SNPs used for fine mapping the target chromosomal region and tested for association with low caries experience, eleven had nominal p-values of 0.05 or lower. These results are presented in Table 2. Similar results could also be seen between low caries experience and the haplotypes of these markers (Table 4).
Association Results in the Follow-up Populations
Follow-up studies showed similar nominal results for some markers in the US, Brazilian, and Turkey data sets, which are presented in Table 5.
Sequence data
For sequence analyses, we selected women from the Pittsburgh dataset with low caries experience. Samples from 91 subjects were selected for sequencing. Nine subjects presented a heterozygous mutation in the base pair position 131,208,595 of chromosome X, previously reported as rs5933061, and four subjects presented a mutation in the base pair position
131,208,596, previously reported as rs995249. Both mutations are in the 3′ UTR region of
MST4. In FGF13, two subjects were heterozygous in the base pair position 137,713,678 downstream of the gene, variant previously described as rs17539045.
Discussion
Epidemiological and clinical studies have demonstrated that females have higher caries
prevalence than males.19 The mechanisms underlying the reasoning for this trend can
possibly be explained by an investigation of the genes present on the X chromosome. In this work we investigated the locus Xp22.3-p22.1, which we found linked to low caries
experience in our previous genome-wide linkage study. This region contains 24 genes and some of them can be articulated as related to caries experience. With the exception of the
Filipino data that show slightly higher caries experience in females than males,1 our data
from Brazil, USA, and Turkey did not show differences in caries experience between females and males. It is possible that genetic associations can be more readily detectable in groups where females are more severely affected than males.
NIH-PA Author Manuscript
NIH-PA Author Manuscript
This fine map study failed to determine the presence of association between markers in Xp22.3-p22.1 and low caries experience. At the nominal level, markers in FGF13 and MST4 showed trends for association with low caries experience.
The trends found for FGF13 and low caries experience are exclusive for the population datasets comprised of adults (Philippines and Pittsburgh). The sequence analyses showed two subjects with a variant previously identified and described as rs17539045. The minor allele frequency of this variant is 2.2% in the dbSNP build 138 database, the same as our
study. FGF13, when mutated, affects hair growth and also causes dental anomalies,20 but
our results do not clearly implicate this gene in caries experience. We biased the sample selection to females only to increase the number of chromosomes evaluated since the hypothesis was that rare variants not possibly detected by association could be involved in caries. Since males are hemizygous, they would provide half of the number of chromosomes that could have been assayed.
Previous studies uncover FGF signaling as a major regulator of lumen formation during
salivary gland development.121–24 The flow rate and composition of saliva in the host oral
environment impacts caries susceptibility. Saliva plays a protective role in the oral cavity through its buffering, mechanical washing, antimicrobial, and remineralization activities. In addition, the flow rates of saliva and compositional analysis have been shown to be
generally less protective in women than in men.17
MST4 is a member of the GCK group III family of kinases, which are a subset of the Ste20-like kinases. The protein codified by MST4 is localized in the Golgi apparatus and is
specifically activated by binding to the Golgi matrix protein.25 A trend for association
between markers in MST4 and low caries experience was found in the Filipino dataset only. These results are modest and may indicate a false-positive association.
It is possible that our study did not have enough statistical power to detect an association between Xq25.1-27-2 and low caries experience. The effects of this locus on caries may be so small that only several thousand samples may be able to detect. Being concerned with multiple testing, we applied the strict Bonferroni correction to not increase type II erros. However our own data from previous projects demonstrate that under Bonferroni correction
we can miss true associations.26 Hence, here we report our modest results and nominal
p-values to avoid publication bias favoring only positive genetic association results. Another limitation of this study is the phenotype definition that relies on a one time assessment of caries experience. Longitudinal approaches may be more suitable to detect relationships between caries and genes since the pathogenesis of the disease is multifactorial. DMFT/dmft scores represent a snapshot of the consequence of the disease but they are not informative in regards to the mechanisms involved in the disease severity. Other definitions of disease, including clinical findings related to plaque accumulation, saliva composition, and fluoride exposure, may facilitate the identification of specific genes and gene mechanisms
contributing to caries.
NIH-PA Author Manuscript
NIH-PA Author Manuscript
Conclusion
This study failed to demonstrate an association between low caries experience and Xq25.1-27-2.
Acknowledgments
We are indebted to the participants of the study. Sarah Vinski revised the manuscript for grammar and style. Support for this work was provided by the NIH grants R01-DE18914 (ARV). M.B. was supported by the Brazilian program Science Without Borders (CNPq).
References
1. Jindal A, McMeans M, Narayanan S, Rose EK, Jain S, Marazita ML, et al. Women are more susceptible to caries but individuals born with clefts are not. Int J Dent. 2011:454532. [PubMed: 21747859]
2. Lukacs JR. Gender differences in oral health in South Asia: metadata imply multifactorial biological and cultural causes. Am J Hum Biol. 2011; 23(3):398–411. [PubMed: 21448908]
3. Perera PJ, Abeyweera NT, Fernando MP, Warnakulasuriya TD, Ranathunga N. Prevalence of dental caries among a cohort of preschool children living in Gampaha district, Sri Lanka: a descriptive cross sectional study. BMC Oral Health. 2012; 13(12):49. [PubMed: 23148740]
4. Lukacs JR, Largaespada LL. Explaining sex differences in dental caries prevalence: saliva, hormones, and “life history” etiologies. Am J Hum Biol. 2006; 18(4):540–555. [PubMed: 16788889]
5. Lukacs JR. Sex differences in dental caries experience: clinical evidence, complex etiology. Clin Oral Invest. 2011; 15(5):649–656.
6. Deeley K, Letra A, Rose EK, Brandon CA, Resick JM, Marazita ML, et al. Possible association of amelogenin to high caries experience in a Guatemalan-Mayan population. Caries Res. 2008; 42(1): 8–13. [PubMed: 18042988]
7. Patir A, Seymen F, Yildirim M, Deeley K, Cooper ME, Marazita ML, et al. Enamel formation genes are associated with high caries experience in Turkish children. Caries Res. 2008; 42(5):394–400. [PubMed: 18781068]
8. Shimizu T, Ho B, Deeley K, Briseño-Ruiz J, Faraco IM Jr, Schupack BI, et al. Enamel formation genes influence enamel microhardness before and after cariogenic challenge. PLoS ONE. 2012; 7(9):e45022. [PubMed: 23028741]
9. Jeremias F, Koruyucu M, Küchler EC, Bayram M, Tuna EB, Deeley K, et al. Genes expressed in dental enamel development are associated with molar-incisor hypomineralization. Arch Oral Biol. 2013; 19(13):172–176.
10. Shaffer JR, Wang X, Feingold E, Lee M, Begum F, Weeks DE, et al. Genome-wide association scan for childhood caries implicates novel genes. J Dent Res. 2011; 90(12):1457–1462. [PubMed: 21940522]
11. Wang X, Shaffer JR, Zeng Z, Begum F, Vieira AR, Noel J, et al. Genome-wide association scan of dental caries in the permanent dentition. BMC Oral Health. 2012; 12:57. [PubMed: 23259602] 12. Vieira AR, Marazita ML, Goldstein-McHenry T. Genome-wide scan finds suggestive caries loci. J
Dent Res. 2008; 87(5):435–439. [PubMed: 18434572]
13. World Health Organization. The world oral health report 2003. 2003.
14. Tannure PN, Küchler EC, Lips A, Costa MC, Luiz RR, Granjeiro JM, Vieira AR. Genetic variation in MMP20 contributes to higher caries experience. J Dent. 2012; 40(5):381–386. [PubMed: 22330321]
15. Barrett JC, Fry B, Maller J, Daly MJ. Haploview: analysis and visualization of LD and haplotype maps. Bioinformatics. 2005; 21(2):263–265. [PubMed: 15297300]
16. Horvath S, Xu X, Laird NM. The family based association test method: strategies for studying general genotype--phenotype associations. Eur J Hum Genet. 2001; 9(4):301–306. [PubMed: 11313775]
NIH-PA Author Manuscript
NIH-PA Author Manuscript
17. Purcell S, Neale B, Todd-Brown K, Thomas L, Ferreira MA, Bender D, et al. PLINK: a tool set for whole-genome association and population-based linkage analyses. Am J Hum Genet. 2007; 81(3): 559–575. [PubMed: 17701901]
18. Rozen S, Skaletsky H. Primer3 on the www for general users and for biologist programmers. Methods Mol Biol. 2000; 132(1):365–386. [PubMed: 10547847]
19. Ferraro M, Vieira AR. Explaining gender differences in caries: a multifactorial approach to a multifactorial disease. Int J Dent. 2010; 2010:649643. [PubMed: 20339488]
20. DeStefano GM, Fantauzzo KA, Petukhova L, Kurban M, Tadin-Strapps M, Levy B, et al. Position effect on FGF13 associated with X-linked congenital generalized hypertrichosis. Proc Natl Acad Sci USA. 2013; 110(19):7790–7795. [PubMed: 23603273]
21. Jaskoll T, Abichaker G, Witcher D, Sala FG, Bellusci S, Hajihosseini MK, et al. FGF10/FGFR2b signaling plays essential roles during in vivo embryonic submandibular salivary gland
morphogenesis. BMC Dev Biol. 2005; 22(5):11. [PubMed: 15972105]
22. Madan AK, Kramer B. Immunolocalization of fibroblast growth factor-2 (FGF-2) during embryonic development of the rat submandibular gland. SADJ. 2005; 58(2):60–61.
23. Patel N, Sharpe PT, Miletich I. Coordination of epithelial branching and salivary gland lumen formation by Wnt and FGF signals. Dev Biol. 2011; 358(1):156–167. [PubMed: 21806977] 24. Steinberg Z, Myers C, Heim VM, Lathrop CA, Rebustini IT, Stewart JS, Larsen M, Hoffman MP.
FGFR2b signaling regulates ex vivo submandibular gland epithelial cell proliferation and branching morphogenesis. Development. 2005; 132(6):1223–1234. [PubMed: 15716343] 25. Shi Z, Jiao S, Zhang Z, Ma M, Zhang Z, Chen C, et al. Structure of the MST4 in complex with
MO25 provides insights into its activation mechanism. Structure. 2013; 21(3):449–461. [PubMed: 23434407]
26. Vieira AR, McHenry TG, Daack-Hirsch S, Murray JC, Marazita ML. Candidate gene/loci studies in cleft lip/palate and dental anomalies finds novel susceptibility genes for clefts. Genet Med. 2008; 10(9):668–674. [PubMed: 18978678]
NIH-PA Author Manuscript
NIH-PA Author Manuscript
NIH-PA Author Manuscript
NIH-PA Author Manuscript
NIH-PA Author Manuscript
Table 1
Definitions of caries experience used in the Filipino and US data sets based on age and DMFT/dmft scores.
Philippines
Pittsburgh (USA)
Caries Experience Level
n
DMFT/dmft
Caries Experience Level
n
DMFT/dmft
Children [under to 12 yrs of age]
Children and teeneger [from 6 to 19 yrs of age] Low caries experience
73
0–3
Low caries experience
26
0–2
High caries experience
138
4 or higher
High caries experience
89
3 or higher
Young Adults [from 20 to 39 yrs of age]
Teenagers [from 13 to 19 yrs of age]
High caries experience
215
0–10
High caries experience
241
11 or higher
Low caries experience
44
0–5
Middle age [from 40 to 59 yrs of age]
High caries experience
60
6 or higher
Low caries experience
152
0–15
Adults [20 yrs of age and older]
High caries experience
384
16 or higher
Elderly [60 yrs of age and older]
Low caries experience
99
0–8
Low caries experience
95
0–20
High caries experience
159
8 or higher
High caries experience
183
NIH-PA Author Manuscript
NIH-PA Author Manuscript
NIH-PA Author Manuscript
Table 2
Studied single nucleotide polymorphisms and p-value of the association between caries experience group in the Filipino families. Location
Marker number Base Change Gene Symbol Gene Name p-value chr. X 129088939 rs5977183 C/G 0.085 chr. X 129202285 rs6637685 C/T ELF4
E74-like factor 4 (ets domain transcription factor)
0.160 chr. X 129232391 rs209990 A/G 0.663 chr. X 129607422 rs6529430 A/G 0.389 chr. X 129623643 rs17305502 G/T 0.405 chr. X 129749449 rs6634795 C/T ENOX2
ecto-NOX disulfide-thiol exchanger 2
0.132
chr. X 130193804
rs4074535
A/G
ARHGAP36
Rho GTPase activating protein 36
0.521 chr. X 130331814 rs5932861 A/G 0.832 chr. X 130404369 rs6637822 C/G IGSF1
immunoglobulin superfamily, member 1
0.512 chr. X 130413442 rs10521765 C/G 0.101 chr. X 130488944 rs5932901 C/T 0.473 chr. X 130492895 rs2475412 C/T 0.649 chr. X 130554291 rs12556610 A/G 0.779 chr. X 130669439 rs4829728 A/T OR13H1
olfactory receptor, family 13, subfamily H, member 1
0.483 chr. X 130746838 rs707254 A/G 0.454 chr. X 130949827 rs4830231 C/T LOC286467 hypothetical LOC286467 0.512 chr. X 131154139 rs2748729 A/G MST4
serine/threonine protein kinase MST4
0.034
chr. X 131820147
rs858618
A/G
HS6ST2
heparan sulfate 6-O-sulfotransferase 2
0.341 chr. X 131894744 rs7881124 A/G 0.177 chr. X 131947668 rs5977761 G/T 0.122 chr. X 132285877 rs242143 C/T 0.844 chr. X 132547106 rs5977872 A/G GPC4 glypican 4 0.513 chr. X 132566456 rs11096369 A/G 0.263 chr. X 132638098 rs2106472 A/G 0.616 chr. X 132942023 rs1908817 C/G GPC3 glypican 3 0.219 chr. X 133030056 rs2284125 C/T 0.232 chr. X 133150848 rs12558772 A/G 0.780
NIH-PA Author Manuscript
NIH-PA Author Manuscript
NIH-PA Author Manuscript
Location Marker number Base Change Gene Symbol Gene Name p-value chr. X 133242671 rs5977959 A/G 0.800 chr. X 133280911 rs2312983 C/T 0.311 chr. X 133561242 rs6638230 A/G PHF6 PHD finger protein 6 0.227 chr. X 133571373 rs2097778 A/G 0.427 chr. X 133699960 rs1982 G/T PLAC1 placenta-specific 1 0.994 chr. X 134176178 rs5975493 C/G 0.733 chr. X 134473551 rs933383 A/G ZNF449
zinc finger protein 449
0.601 chr. X 134553458 rs5930702 C/G 0.847 chr. X 134584301 rs6528247 C/T 0.699 chr. X 135148483 rs903143 C/T 0.033 chr. X 135262632 rs7061270 C/T FHL1
Four and a half LIM domains 1
0.400 chr. X 135268469 rs5975695 C/T 0.650 chr. X 135431358 rs5930933 C/T GPR112 G protein-coupled receptor 112 0.677 chr. X 135445357 rs5974594 C/T 0.672 chr. X 135673047 rs5930964 A/C 0.983 chr. X 135706075 rs5930970 C/G 0.747 chr. X 135837778 rs661426 C/T ARHGEF6
Rac/Cdc42 guanine nucleotide exchange factor(GEF)6
0.565 chr. X 135842871 rs476774 A/C 0.758 chr. X 136053904 rs1190738 A/C 0.591 chr. X 136225349 rs5931073 C/T 0.156 chr. X 136248929 rs5931088 A/C 0.856 chr. X 136396877 rs5929821 C/G 0.188 chr. X 136495205 rs2840672 A/G 0.805 chr. X 136571724 rs5931158 C/T 0.029 chr. X 136600502 rs6635446 C/T 0.183 chr. X 136699584 rs12687601 C/T 0.017 chr. X136738181 rs4829893 A/G 0.012 chr. X 136816568 rs1324156 A/T 0.043 chr. X 137038855 rs5929862 A/G 0.356
NIH-PA Author Manuscript
NIH-PA Author Manuscript
NIH-PA Author Manuscript
Location Marker number Base Change Gene Symbol Gene Name p-value chr. X 137086064 rs882448 A/G 0.933 chr. X 137214310 rs12556287 C/G 0.335 chr. X 137273537 rs5931325 C/T 0.152 chr. X 137306790 rs5974725 C/T 0.354 chr. X 137329745 rs5931353 C/T 0.390 chr. X 137396573 rs1361551 A/G 0.391 chr. X 137409895 rs5931378 A/G 0.265 chr. X 137471351 rs1487918 G/T 0.517 chr. X 137848601 rs5931483 A/G FGF13
fibroblast growth factor 13
0.584 chr. X 137927172 rs12838463 A/G 0.883 chr. X 137951029 rs5931506 C/T 0.606 chr. X 137996323 rs5931514 A/T 0.954 chr. X 138045552 rs10856566 A/T 0.272 chr. X 138057626 rs4520317 G/T 0.764 chr. X 138155474 rs5931566 G/T 0.925 chr. X 138236517 rs5931572 A/G 0.045 chr. X 138266294 rs4829963 C/T 0.095 chr. X 138270349 rs5974804 C/T 0.063 chr. X 138308908 rs6634045 C/T 0.035 chr. X 138615521 rs371000 C/T F9 coagulation factor IX 0.711 chr. X 138722200 rs5907607 A/G MCF2
MCF.2 cell line derived transforming sequence
0.811 chr. X 138967742 rs2485724 G/T 0.869 chr. X 139185642 rs1886366 A/G 0.724 chr. X 139295472 rs439883 C/T 0.328 chr. X 139492869 rs6634148 A/G 0.328 chr. X 139685339 rs6634180 A/G 0.794 chr. X 139757252 rs5954063 A/T 0.71 chr. X 139827513 rs11095831 A/T 0.413 chr. X 140027664 rs5907093 A/C 0.045
NIH-PA Author Manuscript
NIH-PA Author Manuscript
NIH-PA Author Manuscript
Location Marker number Base Change Gene Symbol Gene Name p-value chr. X 140055547 rs1565843 T/C 0.097 chr. X 140230896 rs1016824 T/C 0.223 chr. X 140275485 rs5907830 C/G LDOC1
leucine zipper, down-regulated in cancer 1
0.303 chr. X 140313609 rs1099501 A/G 0.548 chr. X 140371091 rs845163 G/A 0.568 chr. X 140407317 rs5907882 T/C 0.673 chr. X 140511790 rs6636302 A/G 0.239 chr. X 140544892 rs5907945 G/A 0.589 chr. X 140555282 rs6654428 G/A 0.531 chr. X 140828207 rs916354 C/G 0.617 chr. X 140895389 rs5908052 A/G 0.545 chr. X 141033351 rs6636538 A/G 0.199 chr. X 141127038 rs5908097 A/G 0.564 chr. X 141166965 rs7056485 C/T 0.799 chr. X 141181280 rs5907230 C/G 1.000 chr. X 141322841 rs11796500 A/G 0.467 chr. X 141488796 rs5908311 C/T 0.757 chr. X 141579534 rs5954679 C/T 0.721 chr. X 141616460 rs1040474 A/G 0.744 chr. X 141697312 rs7891458 A/G 0.116 chr. X 141765482 rs6529043 A/G 0.762 chr. X 141802685 rs5908399 A/G 0.963 chr. X 141923733 rs7065033 G/T 0.727 chr. X 141944963 rs5907355 A/C 0.362 chr. X 142087501 rs5908491 C/T 0.855 chr. X 142093305 rs5908499 A/T 0.346 chr. X 142125008 rs4825150 A/G SPANXN4
SPANX family, member N4
0.219 chr. X 142241362 rs5908569 A/G 0.295 chr. X 142271947 rs5908582 C/T 0.954
NIH-PA Author Manuscript
NIH-PA Author Manuscript
NIH-PA Author Manuscript
Location Marker number Base Change Gene Symbol Gene Name p-value chr. X 142420719 rs2865521 C/T 0.751 chr. X 142434889 rs5955002 A/G 0.947 chr. X 142456822 rs5908648 C/T 0.561 chr. X 142490526 rs5955016 C/T 0.177 chr. X 142517697 rs5907426 C/G 0.009 chr. X 142566176 rs5955034 C/T 0.114 chr. X 142637455 rs2207580 A/C 0.718 chr. X 142692263 rs2073252 G/T 0.027 chr. X 142720238 rs12156770 C/T SLITRK4
SLIT and NTRK-like family, member 4
0.426
chr. X 142813456
rs5908778
C/T
SPANXN2
SPANX family, member N2
0.217 chr. X 142898144 rs5953891 A/C 0.971 chr. X 142966181 rs237514 C/T UBE2NL
ubiquitin-conjugating enzyme E2N-like
0.325 chr. X 142994731 rs237537 A/T 0.063 chr. X 143031283 rs1077314 C/T 0.184
NIH-PA Author Manuscript
NIH-PA Author Manuscript
NIH-PA Author Manuscript
Table 3
Primers used for sequence analysis. Gene
Region Primer sequences (5 ′ 3′ )- Forward Primer sequences (5 ′ 3′ )- Reverse Amplicon size (bp) Annealing Temperature MST4 Exon 1 GCGCCAGAAAGGTAGACTGA ACACCAGGAAACACCTCCAG 371 58°C Exon 2 TGGGGAGTCAGAGGAGTTTG GATTCTGCCTGGAAGCCATA 486 54°C Exon 3 GCTCCCACAAATAAATGAGAACA AATGCCAGCAACATGTTCAA 381 53°C Exon 4 GGAACCTCAGAATTTGAAGCCTA TTGGCAGCTAGGAGGAAAAA 483 54°C Exon 5 TTGGAATGGAGTTTCAAGGTG AACCAGGTTCCTGGATGGAT 420 52°C Exon 6 TTGGAATGGAGTTTCAAGGTG CCCTACTGCAGGAAAAGCTG 372 52°C Exon 7 TTTTCCTACAGCATTTTAGTTGTTC CAAGCACACTGGAGCATAGC 377 51°C Exon 8 AGTATTCGCCTGAAGCTGAGA AGTGAGGCAGACAGGCATTT 367 55°C Exon 9 and 10 TTTTGTTTTCAGTAGGGGATTCA TTGGAATGGTTGAATCAAAGG 482 51°C
Exon 11 and UTR1
TGTGAAATCAGATGCAGAAGG CATCCTCGTAACTTAAGAAATAGGG 497 53°C UTR2 TTTGTGATGGCGTTTATCATTT CCAACTTGGTAGAAGAGTCAATACTTT 400 51°C UTR3 CAGGTCTTTCAAAGTCATTCTCAA GCTCTCCAAATCCAAGCAGA 483 53°C UTR4 GGCAATTTTACCCTTATTTCACA TTTGTGTGGACAGAAATCATCC 389 51°C UTR5 TTTGCCATGGTAATAAATTGTCC GGATGTAATGGCCACTTTGAC 469 51°C UTR6 TGGGGCTGTATTTCAGTAGTTG TTGGGATGCAATTGTGTTGT 498 53°C UTR7 TTGTGGTGTTGTATGCCAAGA TGAAAAGTATCTTCTGGTTTCCA 498 52°C FGF13 Exon 1 CAAACGCAGGCTAAGGAGAC TGTTACGGAGGCAAGAAAGC 484 56 °C Exon 2 TTGTTTTCTTTCTTCCAGACACC TTCAGGATTTAGGAAAGCGTATTT 353 53 °C Exon 3 GCAGTCCTGCTGGAAACATT AAAATGCTTGCTTCAAATAACTG 380 53 °C Exon 4 CCTAAAAGGCAATACCACATGA ACCACCTGTACCCCCAAAAC 370 52 °C Exon 5 TCATTTAGGTGTGTGGAATAGAACA TGCTTGGCATTCTTATGCAC 456 54 °C UTR1 GGTGTGTGGAATAGAACACCTACA GAACTCTGCCTGTTTGTTTGG 363 55 °C UTR2 CAAATCCATGAGCCACAATG ATTTTCTTGGTGGGAGAGCA 373 53 °C UTR3 TCTGAGAGAAGGACTGCCAAA CTTGAGCCTGAGAAGCCAAT 390 55 °C UTR4 TGTTGTTTTCTTGGCTTGATG TGCCAAATACAATGACAGGAAG 500 59 °C UTR5 CCTCAAGTGTAGATTTCTCTTAATTCC TGTCCACTTTTGGAACACAGAT 386 54 °C UTR6 CTGGTTTTCCCTCAACAACA CCTTTGTACCAATCTGAAGTGC 500 54 °C
NIH-PA Author Manuscript
NIH-PA Author Manuscript
NIH-PA Author Manuscript
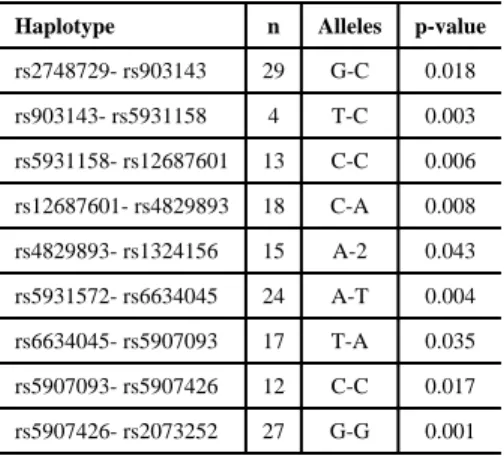
Table 4
Summary results of the haplotype analyses in the Filipino families.
Haplotype n Alleles p-value rs2748729- rs903143 29 G-C 0.018 rs903143- rs5931158 4 T-C 0.003 rs5931158- rs12687601 13 C-C 0.006 rs12687601- rs4829893 18 C-A 0.008 rs4829893- rs1324156 15 A-2 0.043 rs5931572- rs6634045 24 A-T 0.004 rs6634045- rs5907093 17 T-A 0.035 rs5907093- rs5907426 12 C-C 0.017 rs5907426- rs2073252 27 G-G 0.001 Notes: n=number of informative families
NIH-PA Author Manuscript
NIH-PA Author Manuscript
NIH-PA Author Manuscript
Table 5
Markers association results in five populations. Region
Markers
Pittsburgh (USA) Cohort
Rio de Janeiro (Brazil) Cohort
Nova Friburgo (Brazil) Cohort
Istanbul (Turkey) Case-control
Istanbul (Turkey) Cohort
n=1,481 n=598 n=320 n=172 n=103 p-value p-value p-value p-value p-value Allele Genotype Allele Genotype Allele Genotype Allele Genotype Allele Genotype MST4 rs2748729 0.58 0.54 0.55 0.23 -0.45 0.82 0.63 0.65 Intergenic rs903143 0.05 0.16 0.60 0.42 0.02 0.03 0.53 0.70 0.80 0.87 Intergenic rs5931158 0.16 0.37 0.24 0.23 0.92 0.98 0.89 0.75 0.52 0.75 Intergenic rs12686701 0.88 0.68 -0.29 0.51 0.50 0.79 0.56 0.77 Intergenic rs4829893 -0.73 0.77 0.01 0.01 0.36 0.70 0.64 0.65 Intergenic rs1324156 0.14 0.03 -0.05 0.11 -0.95 0.94 FGF13 rs5931572 0.01 0.03 0.25 0.54 0.16 0.36 0.52 0.35 0.78 0.32 Intergenic rs6634045 0.52 0.78 0.34 0.59 0.93 0.53 0.92 0.67 -Intergenic rs5907093 0.38 0.68 0.01 0.04 0.05 0.08 0.09 0.10 0.69 0.87 Intergenic rs5907426 0.06 0.19 -0.02 0.02 0.97 0.91 0.83 0.96 Intergenic rs2073232 0.67 0.01 0.68 0.81 0.56 0.72 0.85 0.05 0.32 0.53