@% Solid State Communications, Vol. 66, No. 11, pp. 1135-1139, 1988. %a_,d Printed in Great Britain.
0038-1098188 $3.00 + .OO Pergamon Press plc
CALCULATIONS OF STM LINESCANS - GENERAL FORMALISM S. Ellialtloglu
Physics Department Middle East Technical University
Ankara 06531, Turkey S. Ciraci Department of Physics
Bilkent University Maltepe, Ankara 06572, Turkey
Inder P. Batra IBM Research Almaden Research Center
650 Harry Road San Jose, California 95120-6099 (Received 18.02.88 by P.H. Dederichs)
ABSTRACT: We have developed a formalism for calculating the line scans of the scanning-tunneling microscopy from the realistic substrate and tip wave functions. The tip wave functions are calculated self-consistently by using a spherical jellium corresponding to a particular metal with various radii. This formalism provides a framework to analyze the experimental line scans, and to deduce information about the clean and adatom covered surfaces, and the radius and height of the tip, as well. We have found that the contribution of a tip wave function in tunneling current is strongly dependent OIL its symmetry.
The pioneering work of Binnig et.al.[l] has intro- duced the Scanning Tunneling Microscopy (STM) tech- nique, which directly ensures the real-space determina- tion of the surface structure of a sample. Thus, the periodicity of the sample surface is not a requirement for the investigation. So far, it has been demonstrated that STM technique is able to detect the isolated steps, dislocations and even single vacancies or impurities at the surface. In one of the modes of operation in STM, the tip height is adjusted to keep the tunneling current constant at a fixed bias. The interpretation was that the tip retracts at the high charge density points, indicating the positions of the atoms at the surface.
A formalism has been developed by Tersoff and Hamann[Z] using frozen wavefunctions of both elec- trodes in the Bardeen’s expression[3] for the tunneling current. They have assumed an idealized tip with con-
stant density of states, and the decay of the charge den- sity to be purely exponential with exponents determined from the sample workfunction. The tunneling current was found to be proportional to the local density of states of the substrate at the Fermi level evaluated at the tip position, ~~(3, &).
According to Tersoff and Hamann’s theory[2] the constant current contours observed with STM are ac- tually contours of constant p,(&&) of the sample at 2 = (?, (3 where 7’ is the lateral position vector in the substrate surface, and f= (rs + h)f, TO being the radius of the tip (assumed to be spherical), and h is the tip- to-surface distance. In the earlier studies, one has gen- erated usually the contour plots from the line scans ob- tained from the constant current-constant voltage mode in STM, and has compared these with the calculated charge density plots. The surface charge densities have 1135
1136 CALCULATIONS OF STM LINESCANS - GENERAL FORMALISM Vol. 66, No. 11 been calculated by using various methods within the
repeating slab geometry, and the Tersoff and Hamann’s theory has been applied with reasonable success. For example, in the recent experimental observations[4] on graphite, STM was able to resolve the two inequivalent atoms. This was a very significant observation since the only distinction between these two sites is caused by a weak interlayer coupling of the graphite planes. A correct identification of these different atomic sites in graphite has been achived recently by using the charge density calculations by Batra et u1.[5], and also by Sell- oni eb sI.[6].
It should be noted, however, that many fine struc- tures in the line sc*as- which are possibly of crucial importance- are lost in generating the contour plots. In this respect, the analysis of a line scan itself would reveal additional information about the surface, which is not so clear in the contour plots. It is, therefore, desirable to calculate a quantity starting from the wavefunctions of the sample and the tip, which can be compared with the STM line scans. In this study, we present a formal- ism for calculating the STM line scans. This is based on the direct use of the substrate wave functions, which can be obtained from the SCF-pseudopotential calcula- tions[7]. The extension to other forms of the wave func- tions, for example, the LCAO wave functions is stiaight - forward. Since the realistic tip wave functions can be obtained from the SCF- calculations of the spherical jel- lium metal, the effects of the symmetry of the tip wave functions on the tunneling current are also included.
Slab wave functions are calculated with a reason- able accuracy within a region relevant to the tip-to- surface distance one usually gets in STM. Certainly these wave functions are more realistic than those expo- nentially decaying empirical forms with exponents ob- tained from the workfunction data. In general, the cal- culated slab wave functions have the form
where a,, are the expansion coefficients for each band n, and & is the wave vector parallel to the surface. Vectors G’ are the S-dimensional reciprocal lattice vectors of the slab unit cell, which contain the vacuum region between two slabs. 2 is the 3-D position vector of the substrate. Since the structure of a tip is usually not known in STM, we simulate it with a spherical-jellium metal. Within this model, the wave functions of the tip are computed self-consistently as a function of the tip ra- dius. Jellium model has been applied to various sys- tems so far, including semi-infinite slabs representing a
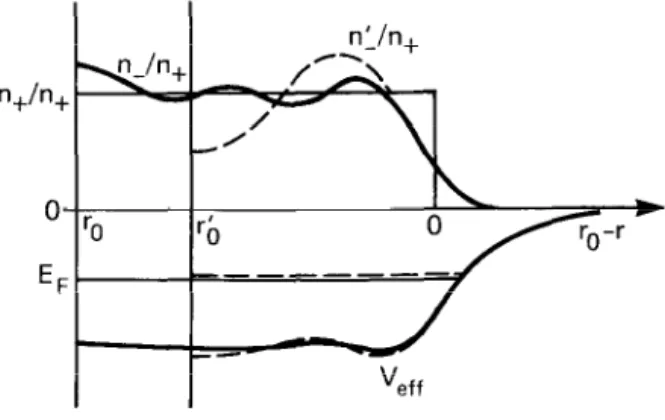
metal surface[3], slabs of finite thickness[Q], and small spheres representing metal clusters[lO,ll]. It was ob- served for the jellium ball that the electronic energy lev- els obey the shell structure and one gets new solutions for the energy eigenstates accordingly, as the radius of the sphere increases. The corresponding charge density when solved self-consistently for a given radius exhibit the usual FKedel oscillations and a tail representing the electrons spilling out of the sphere. Figure 1 schemati- cally shows the self-consistent solutions for two jellium spheres of different radii. The self-consistent potential V,,f is the sum of the Hartree and exchange-correlation terms[l2]. Jellium results show that the tails of the charge density, nt(rT for spheres of different radii do not change very much, whereas nt(r3 at r = 0 changes drastically as one increases the radius, rs, to include es- pecially a new s- or p-type level each time. The wave functions calculated numerically are then cast in an an- alytical form as linear combinations of Gaussian (GTO) or Slater (STO) type orbit&. This way not only the s-symmetry, but also different other symmetries for the tip functions can be investigated separately. The GTO’s we have considered are expressed as :
for the s-, pz- and pz-type wave functions, respectively. The angular part for pv-type wave function is sin&in+. Similar expressions for the corresponding STO’s are :
Figure 1. Schematic illustration of jellium results for effective potentials and the normalized densities of elec- tron states of two metal spheres with different radii (r& and ~0). The density of electron states at the inte- rior regions, especially at the center, are quite different, but the tails at the exterior region are very similar.
Vol. 66, No. 11 CALCULATIONS OF STM LINESCANS - GENERAL FORMALISM 1137 Here Q = & + 6 and the functions B,(Q) rue to be calculated once for all, and are given for different types of analytical tip wave functions as :
The tunneling current is given by the first order perturbation theory as[2,3]
I=
c
CC f(W1 -
f(& + ev)]
I MI,
I2
~(EI - En)
where V is the applied bias voltage. Ma are the tunnel- ing matrix elements which can be written in Bardeen’s formalism as
where S is a surface in the vacuum region sufficiently far from the tip and slab. This formalism assumes frozen wave functions Q,, and $1 representing the two electrodes whose separations are large enough to be treated independently. However, as shown by Tekman and Ciraci[lS], the frozen orbital approximation is not justified at small tip-to-surface distances. For the inte- gration surface S, we have chosen a spherical shell con- centric with the jellium ball shown in Fig.2. With this simple choice of surface geometry and the variables de- scribed in Fig. 2, the matrix elements MI, can be put into a compact analytical form in terms of a function L?,(Q), which is independent of the tip position :
Slab - ‘*’
Figure 2. The geometry of the electrodes based on the analytical calculations. The tip is represented by a sphere of radius rs, and concentric with that is the surface of integration of spherical shape of radius 7.0 < r < 7.0 + h.
&I(Q) = 4* C CioC-Q’o’2
[hor2io(Qr) - QG(Qr)l
I
Bi(Q) = 4xX ci~e-“i”‘[(20i~r3-r-2)j~(Qr)+Qrjo(Qr)] i
X
for the s-type and pz, pl,v-type GTO’s, respectively. Similarly for the corresponding STO’s one obtains :
Be(Q)
=
(8r)1/3ctOe-a0rKw + lh(Qr)
-
QcidQrI
Bl(Q)
=
(48r)‘/3ale-a1’[(alr - S)jl(Qr) +Qrjo(Qr)]
r cos 00
X
1 1
r sin 00where jl(Qr) sre the spherical Bessel functions. If one assumes a concentric hemispherical shell for the surface S in Fig.2, then the above results will be in terms of the spherical Hankel functions hj’)( Qr) instead. In spite of the fact that the radius of the surface of integration S, appears explicitly in the above equations, B,(Q)% are r-independent. To check this analytically as well, we have taken the limit of Tersoff and Hamann’s[2] in our formalism and obtained their result identically.
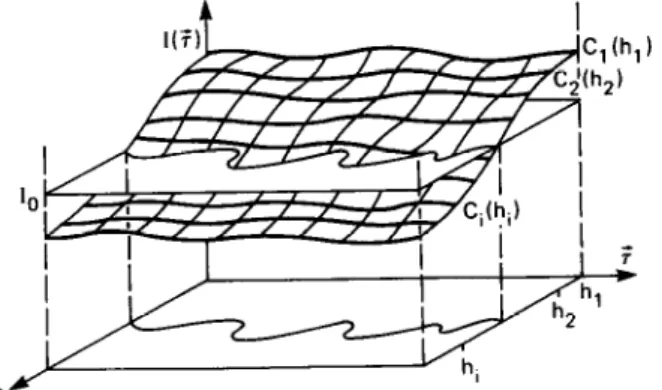
Having obtained the above expressions the c&u- lations of line scans are straihtforward. For a given value of the tip-to-slab distance h, where 2 = (h + rc)i + 7’, one generates an I(?) versus T’curve C. For several fixed values of hi one repeats the same scan, and obtains a family of curves Ci of I(+‘) versus 7: An illustration of this is shown in Fig.3. For a constant value IO of the
h
Figure 3. Family of constant-height curves Ci(h;) displaying the current I(?), versus lateral position 7’ schematically. The projection of the interception of the constant IO plane with the surface composed of C’s is the corrugation h(F) of the slab surface at constant V and constant b.
1138 CALCULATIONS OF STM LINESCANS - GENERAL FORMALISM Vol. 66, No. 11 current shown by the horizontal plane, one obtains the
corrugation h(?) graphically.
It should be noted that the jellium ball used in the present analysis has a discrete set of eigenstates. Whereas the continium of electronic levels of an actual tip leads to a state density D(E), which ought to am- plify the tunneling current. The tip wave functions, $, obtained from the jellium ball are good represen- tations for those participating in the actual tunneling event, except that they are normalized with respect to the volume of the idealized spherical tip. As a result the observed tunneling current has to differ from that cal- culated here by a constant multiplicative factor. How- ever, (dI/dh)v within the conventional tip-to-surface distance, h, is expected to be unaltered both in the- ory and in experiment. In view of the above arguments the calculated line scans can be compared safely with the experimental ones. From that comparison, the tip- to-surface distance can be estimated. Since the family of curves Ci is easily generated for various tip radii, the effect of the tip radius can also be revealed. Further-
more, using single exponent ST0 to represent the va- lence orbitals of the tip atoms and simulating the atomic structure at the tip by small radius jellium balls, the ef- fect of the atomic structure of the tip (i.e. tips hawing
one, two or more outermost atoms) on the STM images can be investigated within the formalism we developed. We found also the following significant effects of the tip wave function symmetry on the tunneling current: (i) Tips with pr- and pv-type wave functions are sensitive to the xy-corrugation only. They are less sensitive to
the changes in the vertical direction. (ii) Tips with a pL -type wave function are less sensitive to xy-corrugation. Therefore, since the contributions to the tunneling cur- rent from different types of wavefunctions are not equal, in contrast to earlier proposal[2], the current is not nec- essarily just proportional to the total state density of te tip at the Fermi energy. Furthermore, each of these un- equal contributions is not directly proportional to the corresponding local density of states, either. Appar- ently, the symmetry of the tip wave function plays an important role in the interpretations of the experimen- tal data.
It should also be noted that using the precalcu- lated functions &(Q), we can calculate not only the constant current-constant voltage mode, but also other quantities like the conductance (dI/dV)h, and the effect of the vertical motion of the tip on the current, (dI/dh)+ Since the wavefunctions for the adatom covered (mono- or multilayer coverage) metal and semiconductor sur- faces can be accurately calculated by using the SCF-slab calculations, the STM line scans for such systems can be investigated within the formalism presented here. In the matrix element MI,,, the type of the adatom is charac- terized by the Fourier transforms of the wave function a,(Q). Hence, the matrix elements MI,, and the line scans have to contain the information, wherefrom the signature of the adatom can be deduced.
ACKNOWLEDGEMENT
We would like to thank Professor M. Durgut for helpful discussions.
PI
PI
131 [41References
G. Binnig, H. Rohrer, Ch. Gerber and E. Weibel, Lett. 49, 57 (1982); Phy~. Rev. Lett. 50, 120 (1983); Surf. Sci. 131, L379 (1983); G. Binnig and H. Rohrer, Surf. Sci. 126, 236 (1983).
Appl. Phys. Lett. 40, 178 (1982); Phys. Rev.
J. Tersoff and D.R. Hamann, Phys. Rev. Lett. 50, 1998 (1983); J. Tersoff and D.R. Hamann, Phys. Rev. B31, 805 (1985).
H. Salemink, I.P. Batra, H. Rohrer, E. Stoll and [5] I.P. Batra, N.
E. Weibel, Surf. Sci. 181, 139 (1987); I.P. Batra, S. Ciraci, N. Garcia, H. Rohrer, H. Salemink and
Garcia, H. Rohrer, H. Salemink,
E. Stoll, in 18th. Semiconductor Conf. Proc., Stockholm, 1986.
E. Stoll and S. Ciraci, Surf. Sci. 181, 126 (1987);
J. Bardeen, Phys. Rev. Lett. 6, 57 (1961).
G. Binnig, H. Fuchs, Ch. Rohrer, E. Stoll and E. Tosatti, Europhys. Lett. 1, 31 (1985).
[6] C.A. Selloni, P. Carnevalli, G.D. Chen and E. Tosatti, Phys. Rev. B31, 2602 (1985).
[7] M. Schluter, J.R. Chelikowsky, S.G. Louie and M.L. Cohen, Phys. Rev. B12, 4200 (1975).
Vol. 66, No. 11 CALCULATIONS OF STM LINESCANS - GENERAL FORMALISM 1139
[8] N.D. Lang and W. Kohn, Phys. Rev. B1,4555 [12] W. Kahn and L.J. Sham, Phys. Rev. 140, All33
(1970); Phys. Rev. B3, 1215 (1971). (1965).
[9] F.K. Schulte, SUT$ Sci. 55, 427 (1976). [13] E. Tekman and S. Ciraci, Physica Scripta, xx, xxxx [lo] W. Eckard, Phys. Rev. B29, 1558 (1984). (1988).