H O S T E D B Y Contents lists available atScienceDirect
Progress in Natural Science: Materials International
journal homepage:www.elsevier.com/locate/pnsmiCrystal and electronic structure study of the Li
2
Mn
1-x
Nd
x
O
3
battery cathode
Gültekin Çelik
a, Sevda Akta
ş
a,
Şule Ateş
a,∗, O. Murat Özkendir
b, Wantana Klysubun
caSelcuk University, Department of Physics, Faculty of Arts and Science, Campus, Konya, Turkey bTarsus University, Faculty of Technology, Energy Systems Engineering, Tarsus, Turkey
cSynchrotron Light Research Institute (SLRI), 111 University Avenue, Muang District, Nakhon Ratchasima 30000, Thailand
A R T I C L E I N F O Keywords: Cathode material Crystal structure Electronic structure XAFS Li-ion battery A B S T R A C T
Neodymium substituted Li2MnO3samples were prepared by the solid-state reaction method. The crystal and
electronic structure properties of the prepared samples were investigated by x-ray based techniques. According to the analysis, it was determined that Nd atoms did not sit in to the Cr coordinations in Nd substituted samples and built up a different crystal structure. To support the analysis of the crystal structure study of the samples, electronic structure properties of the Nd substituted samples were studied via the collected data by x-ray ab-sorptionfine structure (XAFS) spectroscopy from the Mn K-edge. The results of the data analysis revealed that due to the misfit with the ionic radii and also the oxidation states, substituted neodymium atoms built up isolated crystal domains in Li8Mn5Nd18O39cubic crystal structure. The symmetry in Mn K-edge absorption data
of the sample both in parent Li2MnO3and Nd substituted samples confirmed that Mn coordinations has not been
influenced by the Nd substitution.
1. Introduction
Since Li-ion batteries (LIBs) are the most interesting and promising systems for energy storage applications, and the ones have been widely studied and applied to electric vehicles, energy storage power stations and portable electronic devices such as cell phones, portable computers, digital cameras, etc. for the advantages of high energy density, high operating voltage, long life span, low cost and good safety. However, the energy density of current LIBs is still not enough because of the low capacities of the conventional LIB cathode materials, such as layered LiCoO2(130 mAh g−1) [1] and olivine LiFePO4(163 mAh g−1) [2]. It is known that the physical and chemical properties of cathode and anode materials are responsible for the electrochemical properties of LIBs [3–6]. Especially, cathode material affects substantially the perfor-mance and cost of a LIB. Since it typically has a lower specific capacity than the most common anode material, graphite (372 mAh g−1), it is essential to develop high capacity cathode materials comparable to anode materials [7].
Extensive researches on the new cathode materials with high ca-pacities are still one of the top studies for LIBs. Compared with the layered compounds based on cobalt or nickel oxides, lithium manga-nese oxide based compounds are cheaper, safer, more abundant and less toxic, and have attracted attention as one of the most promising cathode materials for future LIBs [8,9]. Moreover, they have the
advantage of high reversible capacity (> 200 mAh g−1) when charged above 4.5 V [8,10]. The one from these lithium manganese oxide cathode materials is Li2MnO3 having O3−type layered and thermo-dynamically stable structure. Li2MnO3like the other lithium manganese oxide compounds is electro active intercalation host material in lithium cells, too. Also, it has very high theoretical capacity and a particular electrochemical mechanism [11]. However, Li2MnO3 is known as electrochemically inactive below the usual cut-off charge potential of 4.5 V vs. Li/Li+[9]. Because of the atomic configurations in monoclinic Li2MnO3(space group; C2/m:b1), where both manganese and lithium atoms occupy octahedral sites, it is difficult to oxidize Mn4+ to the Mn5+state and more Li atom addition to this structure is not possible [9,12]. Thus, it is needed to investigate Li2MnO3itself properties and its alternative element or compound doping structure due to all these advantages and disadvantages as the cathode material in the LIBs.
Li-rich Mn-based cathode materials have been widely studied for new generation Li-ion rechargeable batteries due to their high working voltage (3.5 V vs. Li/Li+), high specific capacity (250 mAh g−1), large energy density (1000 Wh kg−1), low cost, non-toxicity and several other advantages compared to the commercial other cathode materials [13–15]. Some studies for Li2MnO3 cathode materials have been re-ported in the literature. For example, Zuo et al. prepared a Mn-based Li-rich cathode material with a single-layer Li2MnO3 superstructure, which demonstrated a reversible capacity of≈400 mAh g−1 with a
https://doi.org/10.1016/j.pnsc.2019.03.010
Received 19 October 2018; Received in revised form 26 March 2019; Accepted 26 March 2019
∗Corresponding author.
E-mail address:[email protected](Ş. Ateş).
Available online 10 April 2019
1002-0071/ © 2019 Chinese Materials Research Society. Published by Elsevier B.V. This is an open access article under the CC BY-NC-ND license (http://creativecommons.org/licenses/BY-NC-ND/4.0/).
stable discharge voltage and a high charge–discharge efficiency during cycling [16]. Xiang and Wu synthesized the pure and Al-doped Li2MnO3 materials, and claimed to have exhibited a great improvement on the rate capability and cycling stability compared to the Li2MnO3sample of Al-doped Li2MnO3 sample [8]. Nanostructured (10–50 nm) cathode material Li2MnO3was prepared via facile one-step hydrothermal pro-cess by Liu and Zhang. According to their report, the prepared materials exhibit a lower activation potential when being cycled, and delivered electrochemical performance between 4.3 V and 2.0 V at room tem-perature, with a capacity of 243 mAh·g−1 [9]. Yuzer and Ozkendir substituted Nd, Ce and Yb into the Li2MnO3and investigated the crystal and electronic structure properties of these materials [12]. Li and Lei studied on nano-sized Li2MnO3materials via the one-step solid state reaction method [11].
In this study, the crystal structure and electronic properties of the five different materials with the general formula Li2Mn1-xNdxO3 (x = 0.00, 0.05, 0.10, 0.15, 0.20) are examined. To probe the influence of the f electrons on the Li2MnO3crystal atoms, the studies were per-formed by the x-ray based techniques, such as x-ray diffraction (XRD), scanning electron microscopy (SEM) analyses, and x-ray absorptionfine structure (XAFS) spectroscopy techniques.
2. Experimental
Neodymium (Nd) substituted Li2MnO3 cathode materials were synthesized by using Li2O, MnO2and Nd2O3powder compounds with high purity (> 99.99%) in the desired stoichiometric ratios as starting materials with the general formula Li2Mn1-xNdxO3(x = 0.05, 0.10, 0.15 and 0.20) by the solid-state reaction method.
The samples were prepared in several steps. The powders were mixed and milled for 6 h initially with RETSCH PM 100 at 200 rpm and all the milled samples were annealed in the furnace at 673 K (400 °C) for 6 h accordingly. 673 K was chosen because of the MnO2activity in the samples. MnO2powder may dissolve around 500 °C (with melting point at 535 °C) and can strongly interact with other elements. For the next step, mixed powders milled for 2 h and annealed up to 1023 K (750 °C) for 6 h in the furnace. As the last step, powders remilled for 2 h and annealed in the furnace at 1123 K (850 °C) for 12 h.
To study the crystal structure properties of the prepared cathode materials, such as crystal geometry, porosity, crystallite sizes, x-ray diffraction (XRD) measurements were taken using Bruker D8 Advance x-ray diffractometer with Cu Kα radiation (=1.54059 Å) at Selcuk University ILTEK (Advanced Technology Research & Application Center) laboratory in Konya, Turkey. The diffraction data was collected over the range of 10° < 2θ < 80°. SEM images for the morphologies of the samples were also taken at the ILTEK laboratory with Zeiss/EVO LS10 SEM imaging machine. The electronic structure of the samples was probed by using XAFS spectroscopy technique. XAFS data collec-tion process was performed at the XAS beamline (Beamline-BL8:XAS) of the Siam Photon (SLRI) Synchrotron Radiation facility (Nakhon Ratchasima, Thailand) [17].
3. Results and discussion
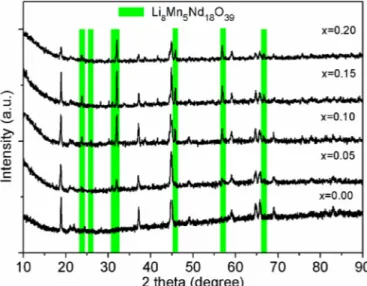
XRD patterns for all samples are presented inFig. 1.Fig. 1shows that the substituted and non-substituted samples had partially or en-tirely similar reflection peaks. In XRD patterns belonging to all Nd-substituted samples the extra reflection peaks emerged. The sample with x = 0.0 had a uniform pattern as expected and highlighted a one-type crystal structure in the entire bulk. However, the XRD patterns for the other samples indicated a polycrystalline feature. According to Fig. 1, as the peak intensities belonging to Li2MnO3crystal structure partially decreased with increasing Nd addition, ones belonging to Li8Mn5Nd18O39crystal structure increased with Nd addition.
The detailed crystal structure analysis of the samples was achieved via a Rietveld method using MAUD software which was a diffraction/
reflectivity analysis code [18]. The analysis results are given inTable 1. WhenTable 1was examined, it is seen that the sample for x = 0.0 formed in only Li2MnO3crystal structure and in a monoclinic geometry with a“C2/c:b1” space group in the bulk. However, the x = 0.05, 0.10, 0.15 and 0.20 substituted samples have multiplet peak structures, which addresses a polycrystalline feature. Two different crystal struc-tures Li2MnO3and Li8Mn5Nd18O39were determined for these samples. Li2MnO3had a monoclinic geometry with a“C2/c:b1” space group and, Li8Mn5Nd18O39had a cubic geometry with a“Pm-3n” space group at different percentages.
The average crystallite sizes addressed the morphology of the pure and substituted samples were calculated via Scherrer's equation [19] given as:
=
A Kλ/(βCosθ) (1)
by using the taken XRD pattern data. In Eq. (1), A is the average crystallite size, K is the Scherrer constant (0.94),λ is the wavelength of the x-ray beam, θ is the Bragg angle and β is the full width at half maximum (FWHM) of the diffraction peak. According to the obtained results for all samples, the average crystallite size of Li2MnO3 and Li8Mn5Nd18O39crystal structures were 21.5 nm and 34.92 nm, respec-tively.
InFig. 2, SEM images are served for both pure and Nd-substituted Li2MnO3samples. Looking at the SEM images, a general morphology having dominant small and sharp-edge attracts the attention. In the picture belonging to Li2MnO3 was observed a low porosity and smoother-edged structure. The sharper edged and porous structure of the particles increased as the contribution rate increased. It is obviously found that the changing substitution amounts caused change in the sample morphology. The increase or decrease in grain size with sub-stitution amounts can be observed. It has been reported that the grain size decrease leads to the electrical conductivity increase in the litera-ture [20–24]. Thus, the changing substitution amounts have the in flu-ence on their electrical properties. The substituted sample images in-cluding both Li2MnO3and Li8Mn5Nd18O39structures exhibited mixed smooth and sharp-edged small particles emphasizing polycrystalline structures. Therefore, we can say that the XRD patterns and SEM images of the samples are in agreement.
To study the electronic structure of the samples, x-ray absorption fine structure data were collected in transmission mode (TM) from Mn K-edge. The collected x-ray data for analysis was calibrated by adjusting the energy from a Mn foil. XAFS is one of the most useful element specific technique and an ideal tool for materials study [25]. The col-lected raw XAFS data of the samples were processed with the ATHENA
and ARTEMIS codes to achieve best results [26]. The studied sample series have an important content with their electronic properties due to the rich molecular interplay among Li, Mn, O and Nd atoms.
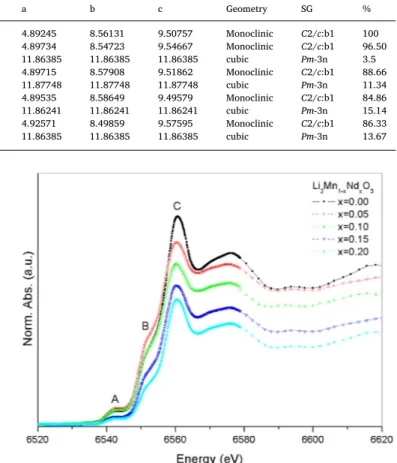
Mn K-edge XAS spectra of the sample series are given inFig. 3. The absorption spectra rised at 6530 eV and had a weak pre-edge peak at 6542 eV which appeared (assigned as“A”) as a result of 1s-3d quad-rupole transition, where a dipole transition was forbidden, i.e., Δl = ± 1.
The peak features on the Mn K-edge spectra had a high agreement with each other and a decrease at the normalized peak intensities was observed. The decrease in the peak intensities are related with the de-crease in the Mn amounts. The agreement among the substituted and unsubstituted samples is a confirmation about the weak interaction of electronic levels of Nd with Mn valence or conduction bands. Besides, no energy shifts were observed at the peak symmetries in the spectra. The symmetry of the peak energies emphasizes the ionic stability of the manganese atoms in the sample environment. Besides, despite the neodymium substitution in the sample, the stability at the edge features of the manganese reflects an indirect interplay between Mn and Nd atoms via the oxygens. Beyond the pre-edge structure, a shoulder like a peak which is assigned as“B” emerges as a high energy levels (eg) of Mn dp hybridized bands. This edge peak can be treated as the lower part of the main edge region and related with the low concentration of triva-lent manganese atoms found in the sample. The peak energy of this edge was determined at 6551 eV. At 6560.6 eV, the main absorption
edge of the tetravalent manganese atoms were determined as thefinal state for the 1s electrons dipole transition to unoccupied 4p levels. Heavy Nd atoms had unoccupied f-levels which do not support any
Table 1
Crystal structure analysis of the Li2Mn1-xNdxO3samples.
Substitution (Li2Mn1-xNdxO3) Crystal α β γ a b c Geometry SG %
0% Li2MnO3 90 99.25004 90 4.89245 8.56131 9.50757 Monoclinic C2/c:b1 100 5% Li2MnO3 90 99.27276 90 4.89734 8.54723 9.54667 Monoclinic C2/c:b1 96.50 Li8Mn5Nd18O39 90 90 90 11.86385 11.86385 11.86385 cubic Pm-3n 3.5 10% Li2MnO3 90 99.24552 90 4.89715 8.57908 9.51862 Monoclinic C2/c:b1 88.66 Li8Mn5Nd18O39 90 90 90 11.87748 11.87748 11.87748 cubic Pm-3n 11.34 15% Li2MnO3 90 99.43304 90 4.89535 8.58649 9.49579 Monoclinic C2/c:b1 84.86 Li8Mn5Nd18O39 90 90 90 11.86241 11.86241 11.86241 cubic Pm-3n 15.14 20% Li2MnO3 90 100.03146 90 4.92571 8.49859 9.57595 Monoclinic C2/c:b1 86.33 Li8Mn5Nd18O39 90 90 90 11.86385 11.86385 11.86385 cubic Pm-3n 13.67
Fig. 2. SEM images of the Nd-substituted samples. (a) x = 0.0, (b) x = 0.05, (c) x = 0.10, (d) x = 0.15, (e) x = 0.20. Fig. 3. Mn K-edge XAS spectra of the sample series.
coupling between outer shells of manganese which has p-levels due to the selection rules. So, Mn and Nd atoms tend to interact weakly with each other.
Beyond the main edge part (XANES) of the XAFS spectra, the EXAFS (Extended-XAFS) part (tail) lies. The strong and Gaussian shaped peak, which is assigned as“D”, is due to the interference of the wave func-tions of the photoelectrons with the incoming x-rays produced in the mechanism of powerful scatterings from the nearest neighbors (i.e. oxygen). The tail of the XAFS spectra above the XANES region spectra is called as the EXAFS region and can be extracted to study on the en-vironment of the source (Mn) atoms in the sample. The scattering in-tensity“chi” (χ) can be estimated from the collected EXAFS data as;
= − Δ
X [μ(E) μ (E)]/ μo o (2)
In the formula,μ is the absorption coefficient. With other experi-mental parameters, the formula giving the chi signal of the photoelec-trons can also be estimated from; the EXAFS equation
∑
= − σ +
X(k) [(N f (k)•exp( 2kj j 2 2j))/(KR )]sin[2kR2j j δ (k)]j (3) In this equation, N is the coordination number of the neighboring atom, fj(k) is the scattering amplitude, δj(k) is the scattering phase shift, R is the distance of the neighboring atom and σj2is the mean-square disorder with the neighboring atom distances.
The scattering data of the photoelectron can be used to study the local geometrical structures around the source atom, i.e. bond lengths, coordination numbers and the angles between atoms [27]. Besides, the periodicity of the oscillations in the region also allows us to determine the exact bond lengths and can provide information about the co-ordinations in the samples.
In Fig. 4, the scattering intensity (chi (χ)) spectra of the un-substituted parent oxide cathode material (Li2MnO3) and 10% Nd substituted sample are given in comparison. The intensity of the scat-tering data is given with its k2power to make the influence of Nd original disturbances more obvious. In the figure, high scattering in-teractions takes place in the low k values, which has an opposite rela-tion with the wavelength. In other words, the fatal scattering interac-tions occur at longer mean free paths. So, it is clear that, the Nd atoms are placed at distant locations and light atoms (Li, O) are placed in the region between Mn and Nd. The parent oxide sample scattering spectra has more smooth spectra than the substituted one. The multiple peak feature also reflects the inhomogeneous interstitial potentials formed by polycrystalline feature of the sample and presence of heavier atom in the crystal structure. The Fourier transform of the scattering intensity yields the radial distribution function (RDF), where the locations of the neighbor atoms are given on a one dimensional axis from the source
atom.
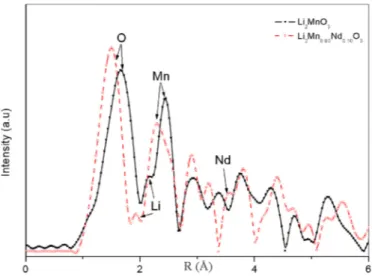
The RDF spectra comparisons of the samples are given inFig. 5. The peaks contain information about atomic coordinations and their dis-tances from the source atom. In case of closer atoms which have short distances to the source atom, but with different azimuthal or polar angles, their peaks overlap and may give broader peaks. So,fits on the RDF data should be performed by using the generated scattering paths by using the FEFF code, and the coordination numbers may be defined [27]. According to the analysis using pathfits for Li2MnO3parent oxide and Li8Mn5Nd18O39sample, thefirst strong peaks are determined as the signals from the closest neighbors of manganese, oxygens, where six oxygen atoms sit in close distances to each other around 1.932 ( ± 0.02) Å. The second closest peak (weak) is from the two Li atoms which locate at about 2.827 Å distance from the Mn atom at the origin. The closest Mn atom is determined at a distance of 2.830 Å. For the Nd substituted samples, the closest Nd atom is determined to sit at a dis-tance of 4.14 Å from the source Mn atom. The closest neighboring atoms are also pointed on the graph according to the atomic types.
4. Conclusions
The crystal structure and electronic properties of pure and Nd-doped materials with the general formula Li2Mn1-xNdxO3 have been reported. As a results of analysis, while the sample for x = 0.0 forms in 100% Li2MnO3 crystal, the other samples (for x = 0.05, x = 0.10, x = 0.15, x = 0.20) form in two crystal phase in different ratios to be Li2MnO3and Li8Mn5Nd18O39. Therefore it is believed that heavy Nd atoms didn't sit into Cr locations as expected. The electronic structure and influence of the Nd substitution into the Mn coordinations as well as its environment have been studied via the collected XAFS data from the Mn K-edge. The scattering intensities of the undoped (Li2MnO3) and 10% Nd doped samples show un-harmony at the high k-values, which denotes that low amount of different crystal formation is present in the substituted samples, i.e. Li8Mn5Nd18O39. Briefly, Nd atoms with larger atomic size and unmatched ionic properties of the neodymium atoms prefer to form different crystal structure and refuse to sit into the Mn coordinations. Besides, the change in the crystal properties appears in the radial distribution function of the samples with shifts at the atomic locations on the one dimensional axis.
Appendix A. Supplementary data
Supplementary data to this article can be found online athttps:// doi.org/10.1016/j.pnsc.2019.03.010.
Fig. 4. Scattering intensity (chi (χ)) spectra of the unsubstituted parent oxide cathode material (Li2MnO3) and 10% Nd substituted sample.
References
[1] L. Xue, S.V. Savilov, V.V. Lunin, H. Xia, Adv. Funct. Mater. 28 (2018) 1705836.
[2] C. Zhao, L. Wang, H. Wu, J. Chen, M. Gao, Mater. Res. Bull. 97 (2018) 195.
[3] K. Wu, K. Du, G. Hu, J. Mater. Chem. A 6 (2018) 1057.
[4] K. Wu, D. Liu, Y. Tang, Electrochim. Acta 263 (2018) 515.
[5] P.C. Lian, X.F. Zhu, S.Z. Liang, Z. Li, W.S. Yang, H.H. Wang, Electrochim. Acta 55
(2010) 3909.
[6] Y. Ren, L.J. Hardwick, P.G. Bruce, Angew. Chem. Int. Ed. 49 (2010) 2570.
[7] S. Goriparti, E. Miele, F. De Angelis, E. Di Fabrizio, R.P. Zaccaria, C. Capiglia, J.
Power Sources 257 (2014) 421e443.
[8] Y. Xiang, X. Wu, Ionics 24 (2018) 83.
[9] G. Liu, S. Zhang, Int. J. Electrochem. Sci. 11 (2016) 5545.
[10] H. Yu, H. Zhou, J. Phys. Chem. Lett. 4 (2013) 1268.
[11] S. Li, D. Lei, AIP Conf. Proc. 1890 (2017) 040037, ,https://doi.org/10.1063/1.
5005239.
[12] A. Yuzer, O.M. Ozkendir, J. Electron. Mater. 45 (2016) 2.
[13] J. Wang, H. Wu, Y. Cui, S. Liu, X. Tian, Y. Cui, X. Liu, Y. Yang, ACS Appl. Mater.
Interfaces 10 (2018) 5125.
[14] T. Matsunaga, H. Komatsu, K. Shimoda, T. Minato, M. Yonemura, T. Kamiyama,
S. Kobayashi, T. Kato, T. Hirayama, Y. Ikuhara, H. Arai, Y. Ukyo, Y. Uchimoto,
Z. Ogumi, J. Phys. Chem. Lett. 7 (2016) 2063.
[15] H.J. Lee, S.B. Lim, J.Y. Kim, M. Jeong, Y.J. Park, W.S. Yoon, ACS Appl. Mater.
Interfaces 10 (2018) 10804.
[16] Y. Zuo, B. Li, N. Jiang, W. Chu, H. Zhang, R. Zou, D. Xia, Adv. Mater. 30 (2018)
1707255.
[17] W. Klysubun, P. Sombunchoo, N. Wongprachanukul, P. Tarawarakarn, S. Klinkhieo,
J. Chaiprapa, P. Songsiriritthigu, Nucl. Instrum. Methods Phys. Res. 582 (2007) 87.
[18] L. Lutterotti, D. Chateigner, S. Ferrari, J. Ricote, Thin Solid Films 450 (2004) 34.
[19] H.O. Abd-Alkader, N.M. Dearz, Int. J. Electrochem. Sci. 8 (2013) 8614.
[20] R. Hariharan, P. Gopalan, J. Mater. Res. 27 (2012) 2017.
[21] E.T. Wefring, F.H. Schader, K.G. Webber, M.A. Einarsrud, T. Grande, J. Eur. Ceram.
Soc. 36 (2016) 497.
[22] M.I. Mohammed, A.A. Elbadawi, H.H. Abuellhassan, J. Appl. Ind. Sci. 1 (2013) 12.
[23] T.Šalkus, E. Kazakevičius, J. Banys, M. Kranjčec, A.A. Chomolyak, Yu.Yu. Neimet,
I.P. Studenyak, Solid State Ionics 262 (2014) 597.
[24] W. Luo, L. Zhu, X.J. Zheng, Chin. Phys. Lett. 26 (2009) 117502.
[25] M. Balasubramanian, J. McBreen, NSLS Activity Report vol. 2, (2001), p. 10.
[26] B. Ravel, J. Synchrotron Radiat. 8 (2001) 314.