INCREASED TAXES DECREASE ALCOHOL CONSUMPTION
Seyfettin Gürsel*, Gökçe Uysal-Kolaşin ve Duygu Güner
Executive Summary
This research brief investigates the effects of highly debated alcoholic beverage regulation on product prices, tax revenues, consumption and production in alcoholic beverage market. Following numerous increases in taxes, alcoholic beverage price index increased by 129 percent from 2003 to September 2010, the CPI rose only by 79 percent. The increase in tax revenues during the same period was more than 50 percent in real terms. The number of households declaring that they consume alcoholic beverages and the average alcoholic beverage consumption of households also decreased. These numbers imply a one third decrease in aggregate consumption. The decrease in production is consistent with the decline in consumption. Tax revenues more than doubled as prices increase
The increase in special consumption tax (SCT) rates of alcoholic beverages attracted a lot of attention in the media in the past weeks. The government insists that the tax increases aim to collect the 900 million that is needed to achieve the primary surplus target of 2011 budget. Meanwhile the opposition groups argue that continuous increases in alcoholic beverage prices reflect the hidden ideological agenda of Justice and Development Party. This research brief does not aim to clarify who is right. However, it aims to investigate the effects of highly debated increases in alcoholic beverage prices on tax revenues, consumption and production and thus base the discussion on more objective ground.
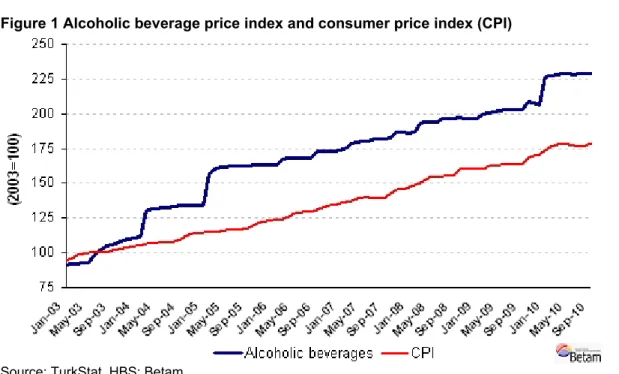
Figure 1 Alcoholic beverage price index and consumer price index (CPI)
Source: TurkStat, HBS; Betam
In Turkey, two thirds of total tax revenues are gathered from indirect taxes such as VAT and SCT. Hence, when setting taxes on consumption, Ministry of Finance should consider the price elasticity of the product’s demand carefully. That is, the magnitude of the decrease in demand due to an increase in price caused by the increase in taxes is an important parameter. The amount of increase in tax revenues depends on how much of the tax increase is reflected in product prices and how the consumption is affected by it. If the aim is * Prof. Dr. Seyfettin Gürsel, Betam, Director, seyfettin.gursel@bahcesehir.edu.tr
Assist. Prof. Gökçe Uysal-Kolaşin, Betam, Vice Director, gokce.kolasin@bahcesehir.edu.tr
Duygu Güner, Betam, Research Assistant, duygu.guner@bahcesehir.edu.tr
Research Brief 10/96
to generate a major increase in tax revenues, the demand of the product is required to be less responsive to price increases. In other words, certain conditions should be met, such as not the product not having close substitutes, the expenditure on the product constituting a small portion of the aggregate household budget, etc. We conclude that the demand for alcoholic beverages is inelastic given that these conditions seem to be satisfied and that the tax increases has increased tax revenues.
Justice and Development Party imposed tax increases, be it small or large, on alcoholic beverages several times. As a result, the alcoholic beverage prices increased more then the prices of other consumption goods (CPI). Figure 1 displays the change in both price indices; the 2003 average is set to be 100 for both CPI and alcoholic beverage price index.1 Price indices are available until September 2010 and hence, do not reflect the effect of the final increase in alcoholic beverage prices. Even when the last price increases in alcoholic beverages is left out of the analysis, alcoholic beverage prices increased by 129 percent, the CPI rose only by 79 percent. The relative price increase of alcoholic beverages amounts to 28 percent from 2003 to September 2010.
During this period, SCT revenues increased considerably despite the increase in prices and associated decreases in demand (Figure 2). SCT revenues gathered from the consumption of alcoholic beverages increased to 1 billion 986 million TL in 2008 from its 1 billion 502 million TL level in 2003.2 The corresponding figure is 1 billion 902 million TL for the first nine months of 2010. Even if the recent SCT increases are ignored, we estimate that the SCT revenues will rise to 2 billion 463 million TL at the end of 2010.3 This indicates a 64 percent increase in SCT revenues.
Figure 2 Alcoholic beverages SCT revenues (in 2008 prices)
Source: Ministry of Finance, TDM, Betam
The number of households consuming alcoholic beverages and their aggregate consumption decreased
Price increases triggered by increases in SCT resulted in a decrease in consumption as well as in the number of households declaring that they consume alcoholic beverages. Household Budget Survey data4 shows a parallel decline in households’ alcoholic beverage consumption for the period of 2003 – 2008 (Figure 3). Aggregate household alcoholic beverage consumption, which was 827 million 399 thousand TL in 2003, decreased to 549 million 452 thousand TL in 2008. All prices are given in December 2008 prices. Aggregate consumption decreased by 34 percent. This decline has two possible sources: a decrease in the average household alcoholic beverage consumption or a decrease in the number of households that declare consuming alcoholic beverages.
1TurkStat releases a pooled price index for alcoholic beverages and tobacco products. Turkey Data Monitor (TDM) computes a price
index that only covers alcoholic beverages, using the consumption weights of these two products. The price index computed by TDM is used in this research brief.
2Prices are transformed into 2008 prices using the GDP deflator.
3The estimation is based on the average share of 4th quarter (October- November- December) SCT revenues in annual SCT revenues
in previous periods.
4Household Budget Surveys are conducted by TurkStat annually. However the data for 2009 is not released yet. Hence, this research
Figure 3 Annual alcoholic beverage consumption of households (in December 2008 prices)
Source: TurkStat, HBS; Betam
According to the Household Budget Survey data, the number of households consuming alcoholic beverages decreased to 1 million 64 thousand in 2008 from 1 million 300 thousand in 2003; so did their share in the total population, 8 percent in 2003 to 6 percent in 2008 (Table 1). The fact that only less then 10 percent of households are consuming alcoholic beverages is consistent with Family Structure Survey conducted in 2006 by TurkStat; the survey reveals that 84.5 percent of the whole population does not consume any alcoholic beverage.
Table 1 Number of households consuming alcoholic beverages (2003-2008) Total number of
households Number of householdsthat consume alcohol Share
2003 16,744,495 1,340,452 8.0% 2004 17,096,537 1,443,341 8.4% 2005 17,549,020 1,428,687 8.1% 2006 17,689,552 1,079,621 6.1% 2007 17,337,894 1,174,662 6.8% 2008 17,794,238 1,064,666 6.0%
Source: TurkStat, HBS; Betam
Figure 4 displays the average alcoholic beverage consumption per household. The average consumption per household decreased by 16 percent form 617 TL to 516 TL, from 2003 to 2008.
Figure 4 Alcoholic beverage consumption per household (in December 2008 prices)
Source: TurkStat, HBS; Betam
A simple decomposition shows that at least half of the decrease in aggregate consumption is caused by the decrease in the number of households that consume alcoholic beverages. 5 This is an unexpected result and 5Computations will be provided upon request.
the underlying reasons should be investigated more thoroughly. Pinpointing the factors behind the decrease in number of households declaring alcohol consumption will provide a more objective ground for discussion. Production decreased along with consumption
Household Budget Surveys do not provide information on the alcoholic beverage consumption outside the home, i.e. bars, hotels and restaurants etc. Hence, we also examine alcohol production figures. The decrease in household consumption is inline with the change in domestic demand figures. Aggregate net domestic demand consists of three elements: domestic production, imports and exports. Domestic demand is met partially by domestic production and partially by imports and a fraction of domestic production is exported to other countries. Figure 5 reveals the changes in domestic demand through the changes in these three components.6
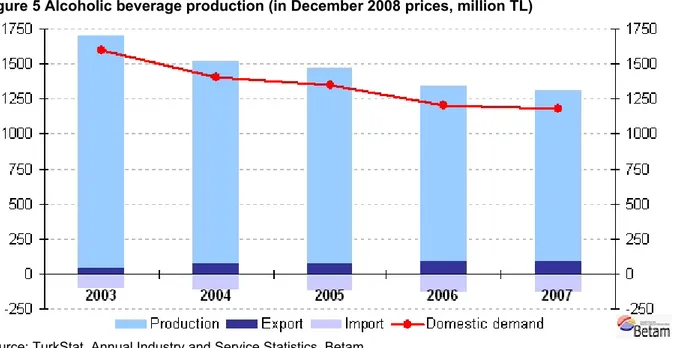
Figure 5 Alcoholic beverage production (in December 2008 prices, million TL)
Source: TurkStat, Annual Industry and Service Statistics, Betam
Within this period alcoholic beverage production is reduced by 26.7 percent from 1 billion 667 million TL in 2003 to 1 billion 221 million TL in 2007. 7 Alcoholic beverage export, of which 2003 level was 108 million TL, rose to 127 million TL in 2007, while import increased from 37million TL in 2003 to 87 million TL in 2008. Net domestic demand, which is the sum of production and import volumes minus exports, indicates a 26.1 percent decrease from 1billion 596 million TL in 2003 to 1 billion 180 million TL in 2007 (given in December 2008 prices). To sum up, production and net domestic demand decrease by 26.7 and 26.1 percent
respectively and this reduction is inline with the decrease observed in household consumption.
6Production, import, export and consumption volumes represented in this research brief are inflation adjusted figures, which are given
in December 2008 prices. In order to adjust production figures we used the CPI series, since a producer price index is not available for alcoholic beverage producers. Therefore, a certain portion of price increases are due to tax increases levied on the final consumer. It should be taken into account that adjusting the production series with CPI will lead to a downward bias which may overestimate decreases in alcohol production.
7 Production figures are gathered from Annual Industry and Service Statistics, Some basic indicators by economic activity (TurkStat).